Transcription
Expert Reference Series of White PapersTroubleshootingSlow Networks withWireshark1-800-COURSES www.globalknowledge.com
Troubleshooting Slow Networks withWiresharkLaura Chappell, Founder, Wireshark University and Chappell UniversityIntroductionYour phone begins ringing before you find a suitable spot to put down your first comforting cup of coffee in themorning. Users are complaining that the network is slow – web browsing sessions are painfully sluggish andemail takes forever to download. They state that they simply can’t work this way.The problem appears to be widespread as your coffee cools faster than the users’ tempers. A lack of error messages or network alarms makes the problem more elusive and guarantees you’ll be hunting down the problemwell through lunchtime – at least.Could the problem be related to the infrastructure devices? Is a rogue switch dropping packets periodically?What about the servers? Could the email server finally be giving in to the pressure of handling all those emailchain letters the users pass amongst themselves? What is the chance that the users’ systems have been compromised with a virus or bot that is spreading stealthily through the shadows of the network like the plague?In this white paper, we examine how to use Wireshark, the world’s most popular open-source network analyzer,to troubleshoot some of the top causes of poor network performance, including High latency Packet loss Inefficient window sizes Intercepting devices Application dependenciesFirst, we’ll look at Wireshark and examine methods used to “see” network communications.Wireshark: The Open-Source Network SaviorWireshark, formerly Ethereal, is the world’s most popular open-source network analyzer and the ideal first-responder tool on a troubled network. Wireshark enables you to “see” the network communications and definitively point to where the problem lies. Although it cannot tell you why the problem exists, Wireshark reducesthe troubleshooting time and effort drastically by providing a definitive answer to the location of the problem –removing the guesswork that typically consumes the IT professional’s time while users impatiently wait for theirnetwork services to be restored.Copyright 2009 Global Knowledge Training LLC. All rights reserved. 2
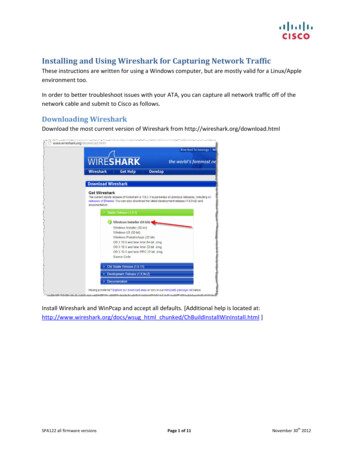
A system loaded with Wireshark is connected to the network using one of the methods defined below. Networktraffic is captured and decoded by Wireshark’s dissectors, predefined code that breaks apart the packets intotheir fields and field contents. Wireshark also contains an Expert system that identifies possible problems innetwork communications, thereby shortening the problem isolation process further. For more information onWireshark, visit www.wireshark.org.The Naked NetworkThe first step in analyzing network performance is to capture the network traffic. Ideally, you’ll capture the traffic to and from a complaining host system from a location as close to that user as possible. You want to experience the slow performance from their perspective and their location on the network.There are four basic options available to capture network traffic. Load Wireshark directly on one of the host systems. Insert a network hub between a host and a switch (half-duplex). Insert a network tap between a host and a switch (full-duplex). Span the switch port of a user to an analyzer port.Loading Wireshark on the User’s SystemThis option makes my skin crawl a bit. I detest the idea of being so invasive and have nightmares imagining theusers running Wireshark on their systems with little or no knowledge of network communications. This would bemy least-favorite recommendation.Hubbing OutThis is a great option for half-duplex networks. Simply remove the cable from the user’s system and connect itto a hub. With another cable, connect the user’s system and your analyzer to the hub as shown in the diagrambelow. Hubs are stupid – they only know 1s and 0s, and forward all bits down all active ports. All traffic to orfrom your user’s system will be copied to your analyzer as well.Tapping OutHubs work great on half-duplex networks, but most of us have migrated to full-duplex networks. Hubs can’thandle these full duplex communications; this is the job for a full-duplex tap. The connection process would bethe same as shown in Figure 1, provided you have an aggregating full-duplex tap. An aggregating tap combinesboth transmit and receive channel information between the user and the switch into a single data stream to theanalyzer system.Copyright 2009 Global Knowledge Training LLC. All rights reserved. 3
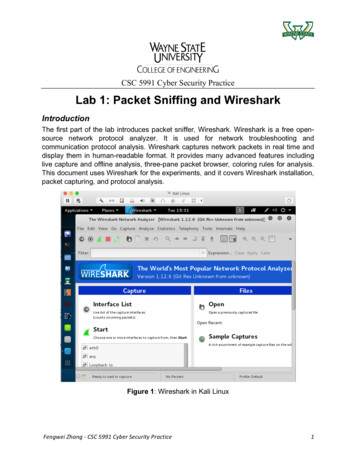
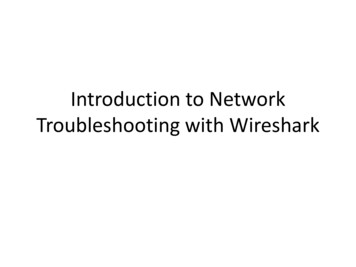
Figure 1: Use full-duplex taps to listen in on all traffic to and from the user’s system on a full-duplex network.SpanningSpanning requires reconfiguration of the switch that the user’s system connects to. A switch that is configuredwith a spanned port sends a copy of all traffic to/from that spanned port down another port – the port that theanalyzer is connected to. This method of tapping-in is ideal for listening to traffic to/from a server as you areunlikely to break the server’s network connection to install a hub or tap.High Latency: Somebody’s Dragging their FeetLatency is a measurement of travel time from one host to another or the roundtrip between hosts. Althoughpackets on a 100Mbps network always travel at a rate of 100Mbps, latency is introduced by distance and interconnecting devices that process packets.Slow travel from one endpoint to another is defined as high latency. High latency has a tremendously negativeeffect on network communications. As an example, in Figure 2, we examine the roundtrip time of a file download process on a high-latency path. At times, the roundtrip latency time reaches 1 second, which is completelyunacceptable.Copyright 2009 Global Knowledge Training LLC. All rights reserved. 4
Figure 2: Use Wireshark’s Statistics TCP Stream Graph Round Trip Time Graph to determine the current roundtriplatency for a file download.We use Wireshark to determine the roundtrip time on a path to determine if this is the reason for poor network performance for Transmission Control Protocol (TCP) communications. TCP is used for web browsing,email receipt and transmission, file transfer protocol, and many other popular applications. In many situations,especially when hosts are using Windows XP, the operating system can be adjusted to work more efficiently onhigh-latency paths.Packet Loss: Losing Data in Bits and PiecesPacket loss is one of the most common problems I see on networks. When a user accesses a web site and beginsto download the elements of the site, lost packets trigger retransmissions, increasing the overhead required todownload the site elements and delaying the total download process.In addition, when an application uses TCP, the effect of lost packets is especially detrimental. Each time a TCPconnection senses a lost packet, the throughput rate automatically throttles back dramatically to account forCopyright 2009 Global Knowledge Training LLC. All rights reserved. 5
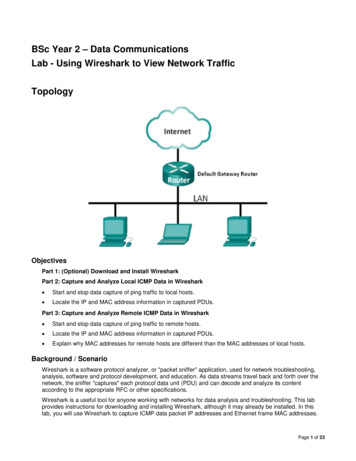
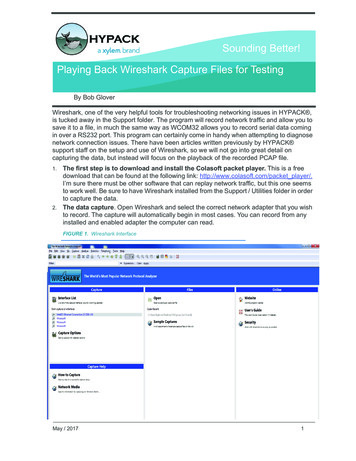
network problems. Slowly, it recovers to a more acceptable rate until the next packet is lost again, causing adrastic cut-back in data throughput. Packet loss has a tremendously negative effect on large file downloads thatshould otherwise stream across a network smoothly.What does packet loss look like? It depends. If the application is running over TCP, packet loss has two differentlooks. In one case, the receiver tracks packets based on their sequence numbers and notices a packet is missing.The client requests the missing packet three times (duplicate acknowledgments) which triggers a retransmission.If the sender times-out when it notices the receiver has not acknowledged receipt of a data packet, the senderretransmits the data packet.In Figure 3, Wireshark indicates that packet loss has occurred and duplicate acknowledgments trigger theretransmission. A high number of duplicate acknowledgments indicates that a network has experienced packetloss and is also facing high latency.Figure 3: Wireshark indicates that packet loss has occurred by color coding the problematic traffic.Locating the exact point of packet loss is imperative in improving network performance. When packet loss isexperienced, we move the Wireshark along the path until we can no longer see packet loss. At this point, we are“upstream” from the packet loss point, and we know where to concentrate our troubleshooting efforts.Copyright 2009 Global Knowledge Training LLC. All rights reserved. 6
Inefficient Window Sizes: Peering Through Small WindowsThere are several “windows” in TCP/IP networking besides the Microsoft operating system. Sliding window Receiver window Congestion windowAs a set, these windows define the TCP-based communication performance on the network. First, let’s defineeach of these windows and their individual effect on network throughput.The Sliding WindowThe sliding window is a process used to send the next TCP segments onto the network as data is acknowledged.The sliding window expands as the sender receives acknowledgments for previously transmitted segments.Larger amounts of data can be sent on the network as long as there are no dropped packets on the network.When packet loss occurs, the sliding window shrinks under the assumption that the network cannot handle thelarger amount of data on the wire.The Receiver Window (rwin)The receiver window is a buffer space in the TCP stack. When data is received, it is held in this buffer spaceuntil an application picks up the data. When an application does not keep up with the receive rate, the receiverwindow fills and may eventually lead to a “zero window” condition. When a receiver advertises a zero windowcondition, all data transmission to the host must stop. Throughput drops to zero. A process called Window Scaling (RFC 1323) enables a host to scale the receiver window to a larger value and reduce the chance of a zerowindow condition occurring.Figure 4, below, depicts a zero window condition that caused a 32-second delay in network communications.The Congestion Window (cwnd)The congestion window defines the actual amount of data that the network can support. It is defined by thesender’s packet transmission rate, the network packet loss rate, and the receiver’s window size. During a healthynetwork communication, the congestion window increases consistently until the transfer completes or it hits a“ceiling” defined by the network health, the sender’s transmit capabilities, or the receiver’s window size. Eachnew connection begins the process of window size negotiation anew.Copyright 2009 Global Knowledge Training LLC. All rights reserved. 7
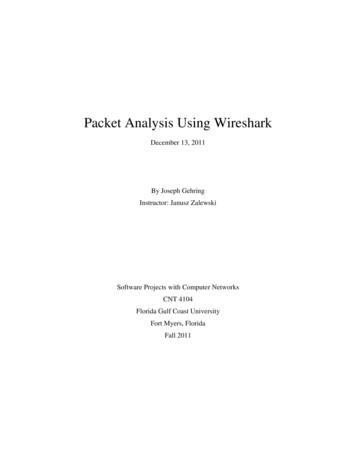
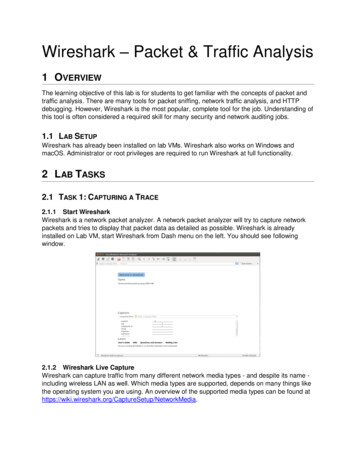
Figure 4: It took over 32 seconds to resolve the zero window condition, denoted by Wireshark’s Expert system.Intercepting Devices: When Network Traffic Cops Go Bad“Network Traffic Cops” are interconnecting devices, such as switches, routers, and firewalls that make forwarding decisions. When packet loss occurs, it is best to look at these devices as the possible cause.These interconnecting devices can also add latency to the path. For example, if traffic prioritization is in use, wecan see additional latency injected into a stream that meets a low priority level.Application Dependencies: Choose Your Application FriendsCarefullySome applications have dependencies on other applications, processes or communications with other hosts. Forexample, if your database application relies on connecting to numerous servers to pull database elements, slowperformance to those other servers can affect the local application’s load time.As a simple example, we can look at a web browsing session in which the target server references numerousother websites. In order to load the main page of the site, www.espn.com, for example, you must access 16hosts that provide advertisements and content for the main www.espn.com page. Figure 5 shows the list ofhosts that you must contact when you load the www.espn.com home page.Copyright 2009 Global Knowledge Training LLC. All rights reserved. 8
Figure 5: Wireshark’s HTTP Load Distribution window lists all servers referenced by the www.espn.com home page.In addition, poorly-written applications can affect the performance on both the sending side and the receivingside. No matter how healthy and free of dropped packets the network is, an application may not take advantageof the network’s capabilities, because it has its own throttling mechanisms limiting the amount of data that itsends. On the receiving side of the connection, an application that does not pull data out of the receive buffer ina timely manner can lead to a limited or zero window condition. In the case of poorly performing applications,consider researching the possibility that the application can be tuned for better performance.Copyright 2009 Global Knowledge Training LLC. All rights reserved. 9
First Steps to a Healthier NetworkMost networks can be tuned for better performance through a series of tasks. L earn to use Wireshark as a first-responder task to identify the cause of poor performance quickly andefficiently. D etermine the source of latency on the network path and, if possible, reduce the latency to an acceptablevalue. Identify the location of packet loss and resolve the problem. E xamine the window size in use on data transfers and consider optimizing the receiver window size, ifpossible. E xamine the performance of intercepting devices to determine if they are adding latency or droppingpackets. O ptimize applications to send larger amounts of data and pull data out of the receiver window, ifpossible.We’ve discussed the primary causes of network performance problems, but one cause – lack of insight intonetwork communications behavior – cannot be overlooked. After 20 years of analyzing network traffic andteaching traffic interpretation and problem resolution, it is clear that network analysis is a skill that every ITprofessional should possess.Wireshark offers an insight into networks in a similar way that X-rays and CAT scans offer an insight into thehuman body for accurate and timely diagnoses. And, just like those indispensable technologies in the medicalfield, Wireshark has become an essential tool to locate and diagnose the cause of network problems in the mostefficient and cost-effective method possible.Note: This white paper was developed as a follow-up to the Global Knowledge webinar by the same name.Visit our Knowledge Center at www.globalknowledge.com/knowledgecenter to view the related webinar.Learn MoreLearn more about how you can improve productivity, enhance efficiency, and sharpen your competitive edge.Check out the following Global Knowledge courses:Analyzing TCP/IP Networks with WiresharkTroubleshooting and Securing TCP/IP Networks with WiresharkTCP/IP NetworkingFor more information or to register, visit www.globalknowledge.com or call 1-800-COURSES to speak with asales representative.Our courses and enhanced, hands-on labs offer practical skills and tips that you can immediately put to use. Ourexpert instructors draw upon their experiences to help you understand key concepts and how to apply them toCopyright 2009 Global Knowledge Training LLC. All rights reserved. 10
your specific work situation. Choose from our more than 700 courses, delivered through Classrooms, e-Learning,and On-site sessions, to meet your IT and management training needs.About the AuthorLaura Chappell is the Founder of Wireshark University and Chappell University, and has been researching, writing, and lecturing on network analysis for over 20 years. Laura designed and created Wireshark University incooperation with Gerald Combs, the creator of Ethereal/Wireshark. In March 2009, the Wireshark CertificationProgram was released to validate a candidate’s knowledge of Wireshark functionality, TCP/IP troubleshooting,and network forensics/security.Wireshark University (www.wiresharkU.com)Chappell University (www.chappellU.com)Copyright 2009 Global Knowledge Training LLC. All rights reserved. 11
Wireshark: The Open-Source Network Savior Wireshark, formerly Ethereal, is the world’s most popular open-source network analyzer and the ideal first-re-sponder tool on a troubled network. Wireshark enables you to “see” the net