Transcription
UPDATE FROM WASHINGTONRegion 3 Standing Trustee TrainingFlorham ParkApril 14-15, 2016
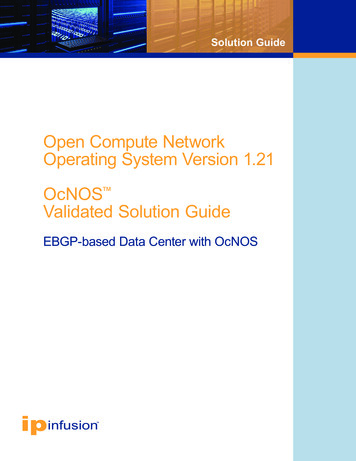
STATISTICAL TRENDS IN CHAPTER 133/28/2016FISCAL YEAR# CH13 TSTSGROSSRECEIPTS% OF TOTALDISBURSED TO % OF TRUSTEES%AVG. RECEIPTSTOTALGENERALWHOSE %FEEAVERAGE % TRUSTEESPER TRUSTEE DISBURSEMENTS UNSEC'DAVERAGED 10.0%FEEMAX COMPFILINGSENDINGCASELOADBudget 2016177 .0%270,187770,5662015177 6.0%269,801814,0472014179 5.5%280,231893,3612013181 6.1%303,559955,9422012182 6.7%341,500980,6412011183 4.5%384,600954,9982010186 94.0%400,387882,0962009188 89.6%362,843798,0522008189 91.0%323,591756,8742007189 1.0%281,337756,0372006190 4.2%253,482792,655Source: Audited Annual Reports as reported at http://www.justice.gov/ust/eo/private trustee/data statistics/ch13.htm except 2015 and 2016.Note: Gross Receipts and Total Disbursements include constructive receipts.Note: % of Total Disbursed to General Unsecured does not include Constructive Receipts (not available).EOUST: Office of Oversight
REGION 3 STANDING TRUSTEE DATAFISCAL 8,794298,557,321200819,255304,970,293Source: audited annual reports; FY 2016 from budgets.3/29/2016
Source: FY 2015 audited annual reportsCATEGORY3/16/2016NATIONALREGION 3AVG. % FEE5.9%5.3%% MAX COMP96.0%100.0%AVG. FILINGS1,5241,951AVG. EOY CASELOAD4,5995,460% TO UNSECURED - TRUSTEES WITH ONGOING MORTGAGES23.0%17.2%% TO UNSECURED - TRUSTEES WITH NO ONGOING MORTGAGES35.0%32.4%RECEIPTS PER CASE - TRUSTEES WITH ONGOING MORTGAGES9,11115,486RECEIPTS PER CASE - TRUSTEES WITH NO-ONGOING MORTGAGES6,4906,05938,406,27544,109,162AVG. DISBURSEMENTSNote: Assumes Winnecour runs ongoing mortgage payments through the plans on a regular basis.EOUST: Office of Oversight
STATISTICAL TRENDS IN CHAPTER 123/28/2016FISCAL YEAR(2) % OF TOTAL % OF TRUSTEESAVERAGEAVERAGE(1) TOTALDISBURSED TO WHOSE %FEE%FEE ALL%FEEDISBURSEMENTSAVERAGEDGENERALCH12TRUSTEES# TRUSTEES ALL TRUSTEES10.0%UNSEC'DTRUSTEES ALSO CH13AVERAGE%FEETRUSTEESNOT CH13TOTAL ENDINGTOTALAVERAGE FILINGS ALL CASELOAD .6%8.6%32,424207817Budget 2016Source: Annual Reports(1) Total Disbursements include constructive receipts.(2) % of Total Disbursed to General Unsecured Creditors does not include constructive receipts.EOUST: Office of Oversight
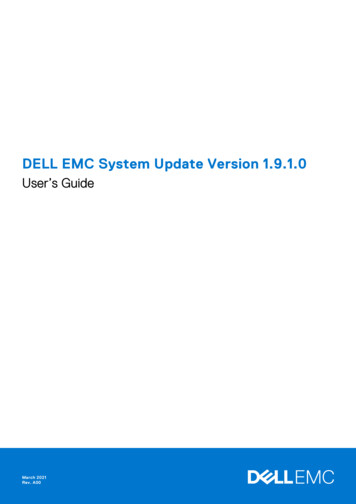
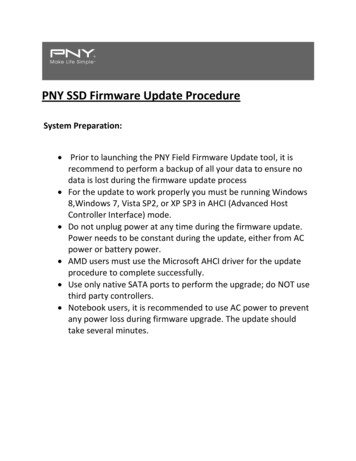
Region 3 Chapter 13 FilingsMarch 2015 – February 2016FY14 Avg. Monthly Filings (1,316)FY15 Avg. Monthly Filings (1,302)16001400120010008006004002000Mar-15 Apr-15 May-15 Jun-15 Jul-15 Aug-15 Sep-15 Oct-15 Nov-15 Dec-15 Jan-16 Feb-16February 2016 filings are approximately 108%of FY15 average monthly filingsEOUST: Office of Oversight 3/17/2016
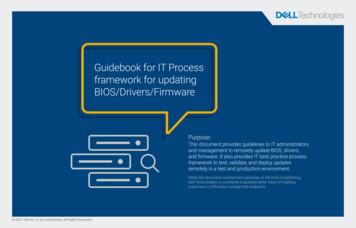
District of DelawareoMichael Joseph
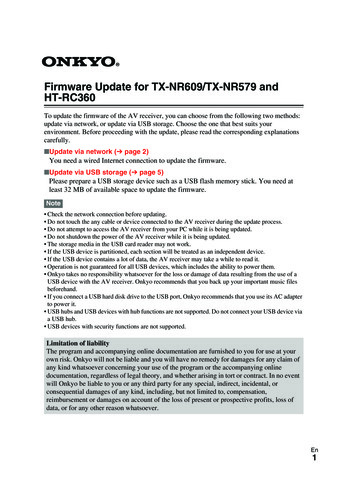
MICHAEL JOSEPHFY14 Avg. Monthly Filings (60)FY15 Avg. Monthly Filings (56)706050403020100Mar-15 Apr-15 May-15 Jun-15 Jul-15 Aug-15 Sep-15 Oct-15 Nov-15 Dec-15 Jan-16 Feb-16
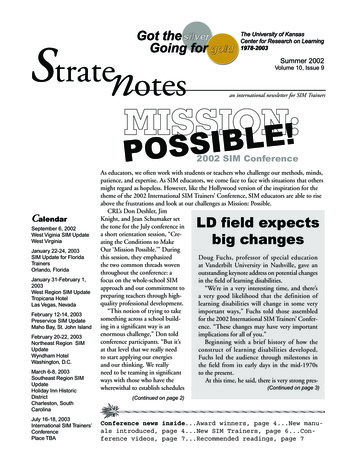
District of New JerseyIsabel Balboao Marie-Ann Greenbergo Albert Russoo
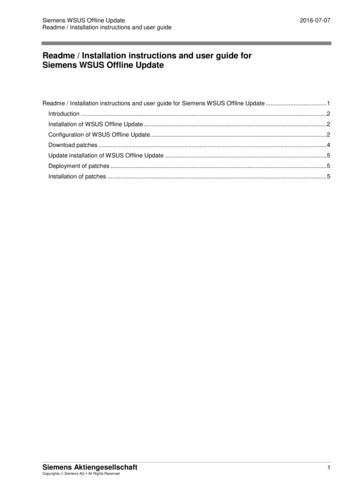
ISABEL BALBOAFY14 Avg. Monthly Filings (209)FY15 Avg. Monthly Filings (208)250200150100500Mar-15 Apr-15 May-15 Jun-15 Jul-15 Aug-15 Sep-15 Oct-15 Nov-15 Dec-15 Jan-16 Feb-16
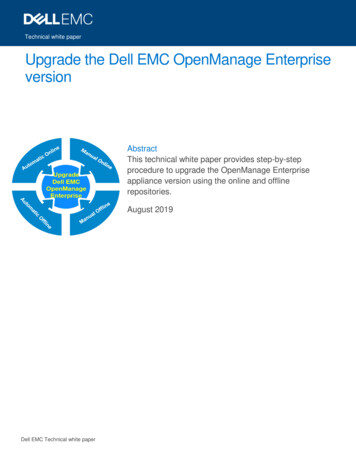
MARIE-ANN GREENBERG250FY14 Avg. Monthly Filings (157)FY15 Avg. Monthly Filings (171)200150100500Mar-15 Apr-15 May-15 Jun-15 Jul-15 Aug-15 Sep-15 Oct-15 Nov-15 Dec-15 Jan-16 Feb-16
ALBERT RUSSOFY14 Avg. Monthly Filings (193)FY15 Avg. Monthly Filings (198)250200150100500Mar-15 Apr-15 May-15 Jun-15 Jul-15 Aug-15 Sep-15 Oct-15 Nov-15 Dec-15 Jan-16 Feb-16
Eastern District of PennsylvaniaWilliam Millero Frederick Reigleo
WILLIAM MILLERFY14 Avg. Monthly Filings (214)FY15 Avg. Monthly Filings (205)300250200150100500Mar-15 Apr-15 May-15 Jun-15 Jul-15 Aug-15 Sep-15 Oct-15 Nov-15 Dec-15 Jan-16 Feb-16
FREDERICK REIGLEFY15 Avg. Monthly Filings (112)FY14 Avg. Monthly Filings (115)140120100806040200Mar-15 Apr-15 May-15 Jun-15 Jul-15 Aug-15 Sep-15 Oct-15 Nov-15 Dec-15 Jan-16 Feb-16
Middle District of PennsylvaniaoCharles DeHart
CHARLES DEHARTFY14 Avg. Monthly Filings (172)FY15 Avg. Monthly Filings (161)250200150100500Mar-15 Apr-15 May-15 Jun-15 Jul-15 Aug-15 Sep-15 Oct-15 Nov-15 Dec-15 Jan-16 Feb-16
Western District of PennsylvaniaoRonda Winnecour
RONDA WINNECOURFY15 Avg. Monthly Filings (191)FY14 Avg. Monthly Filings (196)250200150100500Mar-15 Apr-15 May-15 Jun-15 Jul-15 Aug-15 Sep-15 Oct-15 Nov-15 Dec-15 Jan-16 Feb-16
Top Ten National Audit FindingsFY 2014DESCRIPTIONFREQUENCYExpense Account59Case Monitoring47Computer Access Level Security47Receipts Processing29Disbursements Processing26Fixed Assets (ledger, insurance)24Segregation of Duties23Safeguarding of Accounting Records(backups, physical security)Reconciliation of Trust Ledgers withBank BalancesBank Reconciliation Process201515NO FINDINGS – 36Note: FY 2015 findings not available.5/13/2015
Audit Findings Region 3FY 2014DESCRIPTIONFREQUENCYDocumentation of Staff Procedures2Computer Access Level Security1Computer Password Security1Safeguarding of Accounting Records(backups, physical security)Excess Compensation1Stale Dated Checks1NO FINDINGS – 3Note: FY 2015 findings not available.1
Region 3 Chapter 13 Filings March 2015 - February 2016 0 200 400 600 800 1000 1200 1400 1600 Mar-15 Apr-15 May-15 Jun-15 Jul-15 Aug-15 Sep-15 Oct-15 Nov-15 Dec-15 Jan-16 Feb-16 FY14 Avg. Monthly Filings (1,316) February 2016 filings are approximately 108% of FY15 average monthly filings FY15 Avg. Monthly Filings (1,302)