Transcription
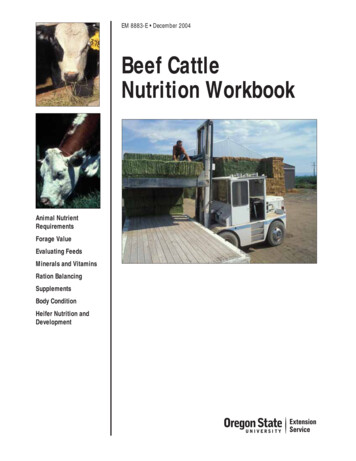
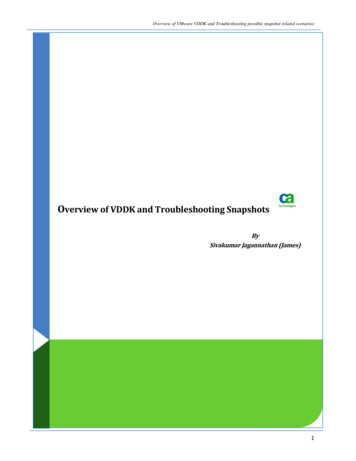
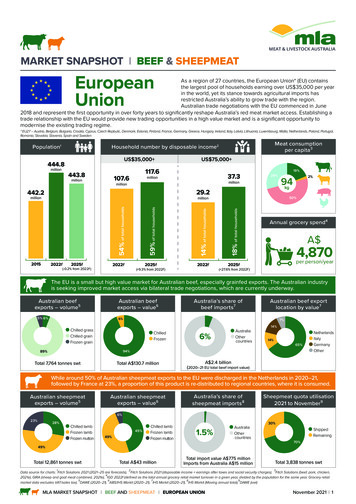
MARKET SNAPSHOT l BEEF & SHEEPMEATEuropeanUnionAs a region of 27 countries, the European Union* (EU) containsthe largest pool of households earning over US 35,000 per yearin the world, yet its stance towards agricultural imports hasrestricted Australia’s ability to grow trade with the region.Australian trade negotiations with the EU commenced in June2018 and represent the first opportunity in over forty years to significantly reshape Australia’s red meat market access. Establishing atrade relationship with the EU would provide new trading opportunities in a high value market and is a significant opportunity tomodernise the existing trading regime.* EU27 – Austria, Belgium, Bulgaria, Croatia, Cyprus, Czech Repbulic, Denmark, Estonia, Finland, France, Germany, Greece, Hungary, Ireland, Italy, Latvia, Lithuania, Luxembourg, Malta, Netherlands, Poland, Portugal,Romania, Slovakia, Slovenia, Spain and Sweden US 35,000 Meat oc nsumptionper capita 32US 75,000 fi fi fiflff fi ff fi fi fiflff fi ff fi fi fiflfififf fiflfiff ff ff fffifl ff4Annual grocery spendfiflff fi ff fi fi Household number by disposable incomefiflff fi ff fi fi Population 1 ff fi flff ff ff The EU is a small but high value market for Australian beef, especially grainfed exports. The Australian industryis seeking improved market access via bilateral trade negotiations, which are currently underway.Australian beefexports – volume5Australian beefexports – value65% 6%Australia’s share ofbeef imports7Australian beef exportlocation by value76%7%Chilled grassChilled grainFrozen 5%94%89%Total 7,764 tonnes swtNetherlandsItalyGermanyOtherA 2.4 billion(2020–21 EU total beef import value)Total A 130.7 millionWhile around 50% of Australian sheepmeat exports to the EU were discharged in the Netherlands in 2020–21,followed by France at 23%, a proportion of this product is re-distributed to regional countries, where it is consumed.Australian sheepmeatexports – volume5Australian sheepmeatexports – value6Australia’s share ofsheepmeat imports8Sheepmeat quota utilisation2021 to November96%23%28%Chilled lambFrozen lambFrozen mutton45%49%Chilled lambFrozen lambFrozen ng70%49%Total 12,861 tonnes swt1Total A 43 millionTotal import value A 775 millionImports from Australia A 15 million2Total 3,838 tonnes swt3Data source for charts: Fitch Solutions 2021 (2021–25 are forecasts), Fitch Solutions 2021 (disposable income earnings after taxes and social security charges), Fitch Solutions (beef, pork, chicken,42021e), GIRA (sheep and goat meat combined, 2021e), IGD 2022f (defined as the total annual grocery retail market turnover in a given year, divided by the population for the same year. Grocery retail56789market data excludes VAT/sales tax), DAWE (2020–21), ABS/IHS Markit (2020–21), IHS Markit (2020–21), IHS Markit (Moving annual total), DAWE (swt)MLA MARKET SNAPSHOTBEEF AND SHEEPMEATEUROPEAN UNION November 20211
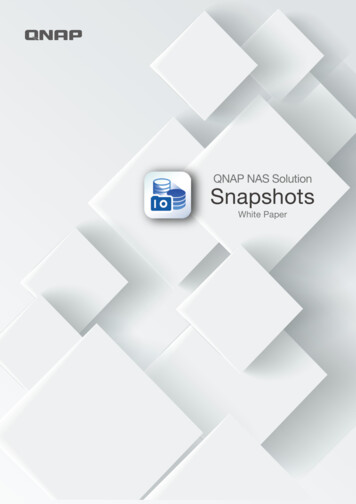
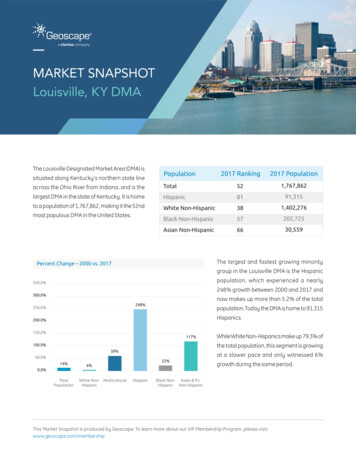
BeefCONSUMERS EU beef consumption has been in long-term decline – the resultof reduced local production, restricted imports, an ageingpopulation, changing lifestyles and consumer concernsregarding health, animal welfare and environmental impact.These societal concerns will continue to play a prominent role inshaping demand for meat and will also drive increased demandfor organic products, with consumers becoming increasinglyaware of food safety, taste and origins. It is forecast that asthese trends evolve over the coming years, EU per capita beefconsumption will decline by 500g/year on average to reach9.93kg per person in 2030. (Source: OECD-FAO Agricultural OutlookConsumers are increasingly paying more attention to theproduction process, with a greater emphasis on local, organicand quality. Dietary adjustments, health considerations andconvenience are key drivers that will influence the demand formeat moving forward.EU beef 0Although limited in volume, Australia predominantly exportshigh-value primal cuts typically destined for foodservice tothe EU, such as loin. However, with restrictive access andvolume in the market, consumer awareness of Australian beefremains low.FranceGermany‘000 tonnes cweItalySpainGreeceRomaniaPolandkg per capita The EU is a large per capita consumer of beef by globalstandards, but consumption levels range between countries,driven by varying degrees of economic development and therole of beef within traditional cuisines. France, Germany andItaly are the region’s largest consumers.'000 tonnes cwe 0kg/person/year (RHS)Source: Fitch Solutions 2022fCOMPETITIVE LANDSCAPEEU-27 total beef imports by 0165–1201320UK14–1340–1The South American trade bloc Mercosur – made up ofArgentina, Brazil, Uruguay and Paraguay – concluded freetrade agreement negotiations with the EU in June 2019. Theoutcome was that the bloc was granted 99,000 tonnes cwe ofbeef access (Source: USDA). However, the agreement still needsto be ratified by both sides’ parliaments, with the distributionmechanism and transition timeline yet to be determined.Political hurdles remain on both sides that may delayratification.After the conclusion of the EU-Canada ComprehensiveEconomic and Trade Agreement (CETA), which entered intoforce provisionally in 2017, Canada has attained access for50,000 tonnes cwe of beef to the EU (Source: Government ofCanada) – a significant improvement on previous access via theexisting shared US/Canada Hilton quota – but little trade hassince materialised. Regardless, the EU requires all importedbeef to be strictly hormone growth promotant-free, restrictingthe majority of US, Canadian and Australian product, whichmust be European Union Cattle Accreditation Schemeaccredited.2012 The UK is an important supplier of beef to the EU, and in 2020exported 81,000 tonnes swt, the most of any supplier to theregion. Currently, product can be traded between the EU andthe UK under a duty-free/quota-free trading relationshipthrough the EU-UK Trade and Cooperation Agreement. Operating off a much lower cost base, South Americansuppliers can pay additional tariff duties and trade outside theirrestrictive country-specific Hilton quotas, allowing them toaccount for the bulk of imports. However, in the last couple ofyears, strong demand from China has captured the focus ofSouth American exporters.11–12 In 2021, it is expected that domestic beef production willaccount for 95% of total EU beef consumption, with importedbeef making up the remainder. Imported beef volumes areexpected to slowly rise, a result of the gradual increase ofimport quotas and free trade agreements with variouspartners. As EU beef production declines, imported beefvolumes will begin to account for a larger proportion of totalconsumption. ‘000 tonnes swt The EU is a significant producer of beef, but most production isderived from dairy-based herds and consumed domestically.After an increase from 2013–2019 due to a restructuring of thedairy sector, EU beef production is expected to continue itslong-term decline out to 2030. Nevertheless, in 2020 beefproduction was estimated at 6.8 million tonnes cwe (Source:Eurostat) – more than three times that of Australia. In 2021,France is expected to account for 18% of EU production,followed by Germany and Italy with 14% and 12% productionshare, respectively.20 OtherSource: IHS Markit, Australian Fiscal YearMLA MARKET SNAPSHOTBEEF AND SHEEPMEATEUROPEAN UNION November 20212
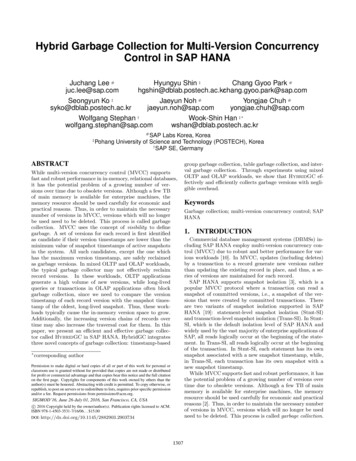
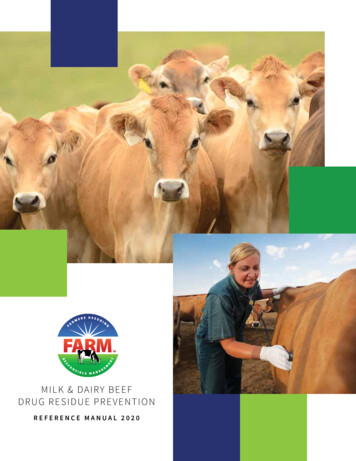
MARKET ACCESSAustralia has predominantly exported beef to the EU under twoquotas: High Quality Beef (HQB) ‘Hilton’ country specific quota: 2,481tonnes with 20% in-quota tariff. Global HB grainfed quota: 19,600 tonnes quota in 2022,allocated on a first come,first serve basis, shared betweenUruguay, New Zealand, Argentina and Australia.Upon the conclusion of the transition period at the end of2020, Australia’s existing HQB Hilton beef quota was splitbetween the EU-27 and UK. Of the existing 7,150 tonnesavailable within the quota, 4,669 tonnes were allocated to theUK and 2,481 tonnes to the EU-27, with the 20% in-quota tariffmaintained for both markets.Australian EU beef High Quality Beef Hilton utilisation100790680570460503403022010% utilised Australia’s current beef access with the EU is in stark contrastto the majority of other export markets, which have progressedin liberalising trade. Transformation of punitive EU marketaccess (low volume import quotas and high out of quota importtariffs) will be an important component of ongoing Australia-EUfree trade agreement negotiations.‘000 tonnes swt ��202020–210% utilised (RHS)Source: DAWE.While Australia has historically been a strong contributor to theHQB global grainfed quota, changes to the administration ofthe quota have limited access for Australian grainfed beef. Dueto an agreement between the EU and US in 2020, Australia’sability to maximise the value of this quota will be lessened overthe coming years. In January 2020, the EU gave the USexclusive access to 18,500 tonnes swt of the quota (increasingincrementally to 35,000 tonnes swt over a seven-year phase-inperiod), with the remainder of the 45,000-tonne quotaavailable to other suppliers (Uruguay, Argentina and Australia)on a first-come first-served basis.Within the EU, the majority of Australian beef is typicallyexported to the Netherlands. However, this may not be thepoint of consumption, as importing countries often serve ascentral distribution points for the beef to be transported toneighbouring countries.MLA MARKET SNAPSHOTBEEF AND SHEEPMEATEUROPEAN UNION November 20213
Market access overview – beef Trade agreementsImport tariffsCompetitorsVolume restrictionsTechnical accessAustralia-EU Free TradeAgreement negotiationscommenced in July 20182021–22:Argentina, Brazil andUS/Canada havelarger allocations thanAustralia under theHilton quota 2021–22:HGP free complianceadds costs to doingbusiness with the EU Up to November 2021there have been elevennegotiating rounds held2,481 tonnes countryspecific HQB quota: 20%in-quota tariff; abovequota tariff 12.8% 3/kgAccess to 5,500 tonnesper quarter grainfedquota shared withArgentina, Canada, NewZealand and Uruguay:0% in-quota tariff; abovequota tariff 12.8% 3/kgOngoing pressureon reduced sharedgrainfed quota – withquarterly allocationbeing filled withinweeks2,481 tonnes undercountry specific HighQuality Beef quota Shared access to 5,500tonnes per quarter globalgrainfed quota All beef suppliedto market must beEUCAS accreditedAccess (via EU importerheld licences) to sharedfrozen beef quota andfrozen beef for processingquota, which at timessource Australian productBest accessMajor challengesSource: Trade agreements, DFAT, MLAAustralian beef exports to EU – summary table Volume – in tonnes swtStorageMeat typeStorage/meat type2020–21% oftotal2019–20% oftotal8,687five-year average(2015–16 to2019–20)% oftotal11,524change 2020–21vs five-year average%in tonnes 30-2,900Chilled grassfed32251,196141,91917-83-1,597Chilled grainfed6,273907,221839,00978-30-2,736Frozen grassfed130.2120.1781-84-66Frozen grainfed353525835184-32-164%in A 000Source: DAWE, figures are roundedValue – in A 767,66156,0973251,530%in tonnes swt-466Source: ABS/IHS MarkitVolume – by major cut (in tonnes 0-526Cube roll/ribeye roll75011848101,0079-26-258Thick flank/knuckle544853967537-28-208Chuck -40-4,5638,68711,524Source: DAWEMLA MARKET SNAPSHOTBEEF AND SHEEPMEATEUROPEAN UNION November 20214
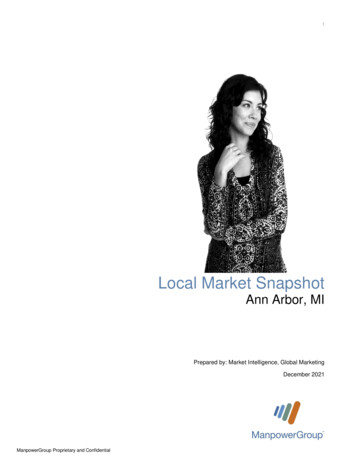
SheepmeatCONSUMERS The role and prevalence of sheepmeat consumption variessignificantly between EU members. For instance, in Greece,consumption is traditionally linked to the seasonal productioncycle, while in other countries, demand is tied to culturallysignificant occasions such as Easter. In general, sheepmeatdemand in the EU is fairly inelastic, fluctuating in line withapplicable religious celebrations. Sheepmeat consumption isforecast to be 1.34kg per capita in 2030, unchanged from 2020levels (Source: OECD-FAO Agricultural Outlook 2021-2030).Sheepmeat plays a minor role in European consumer diets.Consumption is primarily concentrated in Western Europe,particularly France and Spain, but Romania and Greece are alsosignificant producers and consumers. However, similar to otherdeveloped markets, social factors such as health concerns,animal welfare and environmental issues remain a challenge forincreasing sheepmeat consumption in the EU, with consumersbecoming increasingly aware of food safety and provenance.Australia predominantly exports lamb legs to the EU, which aredirected into foodservice channels. However, restrictive marketaccess means that New Zealand lamb has a larger footprint inretail due to superior trade access. Australian lamb is perceived as having strong food safetycredentials – likely tied to a history of no major animal diseaseoutbreaks – but is perceived as less fresh compared to locallysourced product.Lamb sales as percentage of total food sales3.53.02.5% lgariaSource: Fitch Solutions 2022f. Based on lamb sales through all channelsCOMPETITIVE LANDSCAPE After declining 25% over the 10 years to 2014, EU sheepmeatproduction has since stabilised and is forecast to increaseonly modestly, if at all, over the next decade.UK sheepmeat production accounts for a third of lamb andmutton consumption within the EU, followed by Spain andFrance. EU markets accounted for 94% of all UK sheepmeatexports in 2019, highlighting the importance of the traderelationship between the two –2065–1201620114–1514AustraliaUKA (RHS)2013––132020121–12However, imports from New Zealand over the last five yearshave been stretched by supply constraints (New Zealand landis increasingly being reallocated to the dairy sector) and Asianmarkets emerging as major buyers of imported New Zealandsheepmeat.00201 New Zealand’s preferential market access with the EU hasallowed it to capture the majority of import market share. NewZealand also produces a lighter carcase than Australia,resulting in cut sizes more in line with local product, providingan advantage into the imported UK leg roast market.A million‘000 tonnes swtEU sheepmeat imports (UK inclusive) OtherSource: IHS Markit Imports have accounted for 20% of EU sheepmeatconsumption over the last decade. Australia and New Zealandhave remained the only significant external suppliers.MLA MARKET SNAPSHOTBEEF AND SHEEPMEATBraised lamb shank on mashed potatoEUROPEAN UNION November 20215
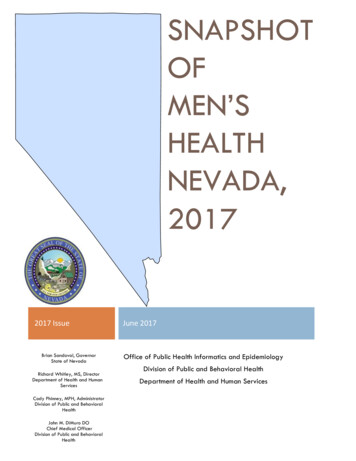
MARKET ACCESS Australia has a 3,838 tonne cwe (combined sheepmeat/goatmeat) country-specific import quota into the EU. Out-ofquota imports from Australia incur prohibitive import duties of12.8%, plus up to an additional 3.10/kg.EU-27 sheepmeat quota volume: Australia compared toNew ZealandAustraliaThere is also a 200 tonne erga omnes sheepmeat andgoatmeat quota that is accessible to a number of countries.3,838tonnesAustralian sheepmeat access is currently disadvantagedcompared to New Zealand, which has a 114,184 tonne quota.Australia’s original EU-28 sheepmeat quota was 19,186 tonnes.However, since the UK left the EU with Brexit, the quota hasbeen split, with 80% directed to the UK. New Zealand split itsoriginal 228,389 quota by directing 50% to the EU.Although New Zealand has not fully utilised its quota in recentyears, reaching just 46% (across EU-28) of the allotted volume in2020, their sheepmeat export volumes to the EU were 9 timeslarger compared to Australia within the 2020–2021 period.Transformation of the EU’s restrictive import quotas will be akey component of ongoing Australia-EU Free Trade Agreementnegotiations.MLA MARKET SNAPSHOTBEEF AND SHEEPMEATNew Zealand114,184tonnes0204060‘000 tonnes cwe80100120Source: IHS Markit, Australian Fiscal YearEUROPEAN UNION November 20216
Market access overview – sheepmeat Trade agreementsImport tariffsCompetitorsVolume restrictionsTechnical accessOngoing AustraliaEU Free TradeAgreement negotiationscommenced in July20182021:NZ:Has a quota of 114,184tonnes (carcase weightequivalent, calendaryear basis)Access is limited to3,838 tonnes countryspecific quota (carcaseweight equivalent,calendar year basis)No trade restrictive nontariff barriers currentlyoperationalIn quota – 0%Above quota – 12.8% 90.2 311.8 /100kgUK:No quota or tariffapplicableBest accessMajor challengesSource: Trade agreements, DFAT, MLAAustralian sheepmeat exports to EU – summary table Volume – in tonnes swtTotalStorageMeat type% oftotal2019–203,845% oftotal4,275five-year average(2015–16 to2019–20)% oftotal4,591change 2020–21vs five-year average%in tonnes 77181468515-58-399%in A 000MuttonChilled lambStorage/meat type2020–21Chilled muttonFrozen lambFrozen muttonSource: DAWE, figures are roundedValue – in A 000Meat 283-19-9,7462,75962,504510,24617-73-7,487%in tonnes swt-24-545Mutton52,78960,618Source: ABS/IHS MarkitAustralian lamb exports to EU – by major cut (in tonnes swt)Leg1,699482,45460Shank83223480Boneless e: DAWE Meat & Livestock Australia, 2021. ABN 39 081 678 364. MLA makes no representations as to the accuracy of any information or advice contained in MLA’s Market snapshot and excludes all liability,whether in contract, tort (including negligence or breach of statutory duty) or otherwise as a result of reliance by any person on such information or advice. All use of MLA publications, reports andinformation is subject to MLA’s Market Report and Information Terms of Use. Please read our terms of use carefully and ensure you are familiar with its content.MLA MARKET SNAPSHOTBEEF AND SHEEPMEATEUROPEAN UNION November 20217
MLA MARKET SNAPSHOT BEEF AND SHEEPMEAT EUROPEAN UNION November 2021 2 CONSUMERS The EU is a large per capita consumer of beef by global standards, but consumption levels range between countries, . The EU is a significant producer of beef, but most production is derived from dairy-based herds and consumed domestically.