Transcription
Estimated “Crush” Margins for Hog Producers, 2006-2015Lee Schulz1Iowa State UniversityBuying weaned pigs, corn, and soybean meal and selling hogs at discrete times throughoutthe year exposes wean to finish producers to both input and output price risk. Weaned pig,corn, and soybean meal prices account for a significant share of total cost and are volatile,adding to a producer’s risk. Managing the crush margin between the hog revenue and themajor input costs, weaned pigs corn, and soybean meal that change with market conditionsis very important. The term “crush” comes from the soybean processing sector wheresoybeans are crushed to produce oil and meal. Traders use the soybean, soybean oil, andsoybean meal futures to find and mange profit opportunities as the three related marketstrade months before the beans are physically processed. Similarly, prices for hogs, weanedpigs, corn, and soybean meal can be managed to protect a margin for a wean to finishproducer.ProcedureA basic model was created to estimate the margin made on the sale of a hog in each monthover a ten-year period from January 2006 through December 2015. This historicalperspective provides a benchmark with which to compare current conditions as producersevaluate their marketing alternatives. It is assumed that weaned pigs are placed, corn andsoybean meal is purchased, and hogs are sold on the first Wednesday of each month. In thisanalysis the crush margin (CM) is defined as the value of the hog less the cost of theweaned pig, corn, and soybean meal. Specifically,CMT (2 LHFBT ) WPT 5 (10 CFBT 5 ) (0.075 SBMFBT 5 )LHFBT is the lean hog futures that expire in month T (or one month after T in the case ofoff contract months) adjusted for the Iowa/Southern Minnesota basis (B) for month T. Thisprice is multiplied by 2 for a 200 pound carcass. WPT-5 is the weaned pig price atplacement, five months prior to slaughter. Prior to purchasing the weaned pig the firstWednesday of the placement month the weaned pig price per head is estimated to be 50percent of the 5-month-out lean hog futures price not adjusted for basis. Fifty percent is theaverage ratio of USDA reported national weaned pig price per head and the 5-month-outlean hog futures price. CFBT-5 is the corn futures price at placement adjusted by the NorthCentral Iowa basis multiplied by 10 bushels per hog. SBMFBT-5 is the soybean meal futuresprice at placement adjusted by the Iowa basis multiplied by 0.075 tons or 150 pounds perhog. For example, a hog sold in January of 2006, CM was calculated daily based on theprice for February 2006 lean hog futures, September 2005 corn futures, and August 2005soybean meal futures from February 16, 2005 to Wednesday, January 4, 2006. This processwas followed for hog sales in each month from 2005 through 2014.At placement, the first Wednesday of the month, it is assumed that the weaned pig, corn,and soybean meal are purchased in the spot market (S). The CM then becomes:CMT (2 LHFBT ) WPS (10 CS) (0.075 SBMS)1Assistant professor, Department of Economics, Iowa State University.1
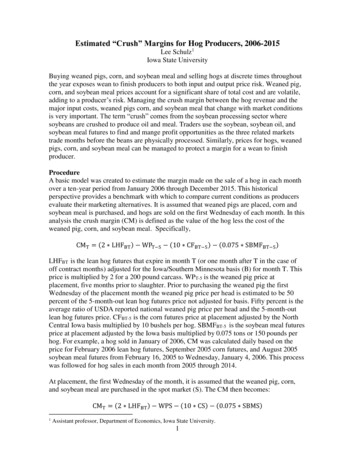
The last day, or the day of marketing, the CM is:CMT (2 LHS) WPS (10 CS) (0.075 SBMS)The lean hog selling price is the producer sold Iowa/Southern Minnesota barrows and giltprice. Upon such the final margin is calculated.ResultsA crush margin of approximately 40 per head is needed to breakeven (see “Using theCrush Margin to Manage Profits Rather than Price: Wean to Finish”). Figure 1 shows thecrush margin by selling month over the 2006 to 2015 period. The “average” is the averageof each trading day crush margin for up to one year prior to marketing. The “placement”and “last” is the crush margin calculated on placement day and the day of marketing,respectively. From placement-day to last-day margin uses basis adjusted lean hog futuresand the placement date spot market prices for weaned pigs, corn, and soybean meal. Thus,the last-day margin reflects the spot market for all three variables and would be similar to aspot-market strategy.Figure 1. Crush Margins: Last Day, Average, and Placement 160Margin (dollars per head) 140 120 100 80 60 40 20 0- 20- 40PlacementLast Day2Average
The margins are above the 40 line in most months and the last-day margin was oftenhigher than the average and placement, but not always. The last-day strategy is alsotypically the most volatile. Margins reached very low levels in late 2008 as hog pricestrended lower from highs in August and last-day margins were negative meaning that feedcosts were not covered when the hogs were marketed. In 2013 margins were negative for ashort period. Margins reached very high levels in 2014 as feed prices decreased and hogprices were significantly higher. In 2015, margins returned to more “typical levels” withaverage and placement margins being much higher than last-day margins for the first threequarters of the year.Table 1 shows the ten-year average for each month’s average margin, high margin, lowmargin, at placement margin, last-day margin, average margin before placement, andaverage margin after placement. The “high” is the average of the highest daily margin forthat selling month averaged across the ten years. The “low” is similarly the average of thelowest daily margin for each selling month. Averaging across selling months indicate thatMay-August have the highest crush margins. The months of March-April and SeptemberOctober are similar to each other and are second level margins. The months of January,February, November, and December are roughly equal over the period and provide thelowest margin on average. While the last-day margin is higher than placement-day andaverage margin in some months, the high and low indicate the potential range of marginoffered by forward pricing. Also note that on average the placement-day margin was higherthan last-day in January, February, March, April, May, June, September, October,November, and December.Table 1. Crush Margin, Average by Selling Month, per head, cementDayPlacement PlacementJan 35.82 53.52 18.90 38.11 32.35 41.59 45.89Feb 40.50 60.45 19.89 41.31 34.24 49.02 50.48Mar 46.60 67.47 26.08 50.72 46.76 52.51 57.85Apr 43.90 67.08 22.02 46.64 43.12 52.10 52.38May 36.95 56.06 63.68 56.89 77.41 60.65 66.67Jun 56.24 76.83 34.99 57.07 51.94 64.47 64.72Jul 56.17 76.40 57.78 63.25 66.54 35.02 58.11Aug 54.81 71.95 34.70 56.99 57.36 60.88 64.38Sep 43.12 61.78 25.39 44.31 40.93 49.64 52.82Oct 41.66 60.70 23.90 42.19 41.90 49.31 51.17Nov 31.20 48.87 12.59 32.75 23.52 38.80 39.80Dec 32.20 53.65 10.87 33.36 26.78 41.49 39.90Notes: Bold text indicates the highest value and underlined indicates the lowest valueTable 2 shows the percent of trading days by selling month and year, up to a year prior tomarketing, that the margin was higher than the last-day margin. The last-day marginreflects a spot market result using cash prices for lean hogs, corn, and soybean meal. Onaverage, 55 percent of the trading days prior the last-day had a higher margin than the lastday. Over 50 percent of the trading days leading to January, February, March, April, May,June, July, September, November, and December marketings were above the last-day3
margin, but only 39 percent of the trading days leading to August were above the last-daymargin. Some years provided better opportunities than others; for example, 2008, 2009, and2015 had a large percent of trading days with margins above the last-day margin while 2006, 2010,2011, and 2014 had fewer opportunities. Chronological patterns did also develop reflectingbull and bear periods in the markets. For example, from the July 2006 through the February2007 marketings, few trading days exceeded the last-day margin, but from March 2007through December 2009 marketings and November 2014 through December 2015, mostdays were higher. The challenge is recognizing when the change occurs and adjustingmarketing accordingly.Table 2. Average Percent of Trading Days Crush Margin Higher than Last-DayMarginJan Feb Mar Apr May Jun Jul Aug Sep Oct Nov2006 29% 83% 39% 87%62%24%4%7%0%10%5%2007 49%9%32%68%44%75% 99%95%40%99%99%2008 100% 90% 100% 98%67%72% 98%9%84%92%98%2009 85% 98% 90% 94%92%100% 96% 100%91%85%61%2010 10% 11%0%0%8%31% 35%2%30%35%98%2011 44%1%10%1%60%98% 64%0%85%0%40%2012 93% 71% 48% 90%98%74% 40%62%97%72%37%2013 56% 49% 99% 91%75%17%0%0%0%4%12%2014 33% 44%1%0%17%26%1%42%38%28%99%2015 85% 100% 89% 94%68%69% 89%70%63%21%100%Avg 58% 56% 51% 62%59%59% 53%39%53%45%65%Table 3 indicates the percent of trading days, up to a year prior to marketing, which thecrush margin was in one of four categories. As noted earlier, it is estimated thatapproximately 40 per head is needed to breakeven.Table 3. Average Percent of Trading Days by Margin Category and Selling MonthDollars per Head 30 30-40 40-50 3%90%78%60%55%
Over 85 percent of the days in May, June, July, and August offered over a 40 crushmargin. February, March, April, September, and October had over 50 percent of the tradingdays above 40. January and November had the fewest days with margins over 40.Margins over 50 are for the most part less common, but do occur and should be viewed asa hedging opportunity.SummaryThe purpose of this analysis was to provide information to hog producers to help themmanage profitability and risk. The crush margin is the value of lean hogs less the cost ofweaned pigs, corn, and soybean meal. Basis adjusted futures were used until the positionwas taken in the cash market. The analysis calculated daily crush margins for up to a yearprior to marketing by month for 2006 through 2015. Across all months and years 55 percentof the trading days offered a larger margin than was available on the last-day. Often themost profitable pricing opportunity is prior to marketing and may be even prior toplacement. Lean hog, corn, and soybean meal futures trade far enough into the future that ispossible to calculate and protect a margin twelve to fifteen months in advance if it appearsattractive compared to an individual operation’s cost structure and the historic levelspresented in this analysis.5
marketing, that the margin was higher than the last-day margin. The last-day margin reflects a spot market result using cash prices for lean hogs, corn, and soybean meal. On average, 55 percent of the trading days prior the last-day had a higher margin than the last-day. Over 50 percent of the trading days leading to January, February, March .