Transcription
AEB 0061March 2020Blueberry Economics:The Costs ofEstablishing andProducingConventionalBlueberries in theWillamette ValleyScout Sutton and James Sterns
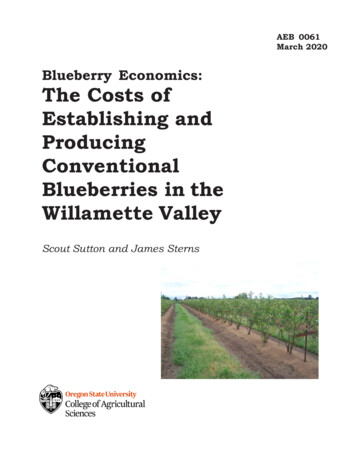
Blueberry Economics: The Costs ofEstablishing and Producing Conventional Blueberriesin the Willamette ValleyScout Sutton, and James Sterns*December 15, 2019INTRODUCTIONThe production of blueberries in theWillamette Valley, Oregon has increaseddramatically in the last twenty years. Figure1 shows that in 1995 there were 1,950 acresof blueberries harvested in the WillametteValley. By 2017, the acreage of harvestedblueberries had increased to 11,700. Thisrepresents a 500 percent increase in acreageover a 22-year period. The relationship ofblueberry prices per pound to totalproduction in the Willamette Valley isillustrated in Figure 2. The grower price forfresh and processed blueberries has variedfrom year to year, often related to nationalsupply and demand for fruit. While pricesreached record highs from 2005-2007 andagain from 2010-2012, recent prices havedeclined from the 2007 peak. In 2017 and2018, the price for fresh and processed hasbeen slowly trending upwards compared tothe previous few years. It is important tounderstand that returns for blueberries varyfrom year to year and to plan for this whendeveloping your own budgets for a farm.This study uses available price data as of the2019 growing season combined with a set ofassumptions about management practices fora “representative” (i.e. hypothetical) twentyacre blueberry farm enterprise.Blueberries are an expensive crop to produce.Profit and loss depend greatly on yield andprice per pound. Yield for a mature farm willvary with cultivar or variety grown, soil type,and management practices. The number ofyears to reach full production may also varyby farm, with poorer performing farms takinglonger than the 7 years assumed in thisanalysis. This cost of establishment andproduction study provides growers with a toolfor economic management and decisionmaking. This study is a product ofcooperative input from interviewed growers,field representatives, researchers, and farmsuppliers. The study provides typical costsand returns for a well managed 20-acreblueberry farm in the Willamette Valley ofOregon. Growers are encouraged tosubstitute their own costs to get an accurateaccounting for their farms.*Scout Sutton, Agricultural Business Management Research Student; James Sterns Agricultural Economist andAssociate Professor; Department of Applied Economics, Oregon State University.Page 1
Figure 1. Harvested acres of blueberries in Oregon, 1995–2017.Source: USDA/NASS Fr Nt 1-3 (96 to 11).Figure 2. Oregon fresh and processed market blueberry production and prices, 1995–2010.Source: USDA/NASS Fr Nt 1-3 (94 to 11).Page 2
ASSUMPTIONSAssumptionsMany individuals were involved in thisstudy including growers, universityresearchers, and Extension faculty. Basedupon insights and suggestions from theseindustry stakeholders, the followingassumptions were made, which provided abasis for this analysis.purpose of this study, are also handharvested at full production.11) Full production pruning labor hours forhand harvested production is 100hours.12) Blueberry fresh market price is 1.50per lb. and the processed market priceis 0.40 per lb.13) A machine shed and all farmequipment are owned by the operator.14) The machinery and equipment used inthe budget reflect the typicalmachinery complement of aWillamette Valley blueberry grower.A detailed breakdown of machineryvalues is shown in Table 1. Table 2provides estimated machinery costsfrom the American Society ofAgricultural Engineers. Table 3 liststhe estimated cost of each operation.15) Gasoline and diesel costs per gallonare 3.00 and 3.25, respectively.16) General labor in year 0 is valued at 14.70 per hour and equipmentoperator labor is valued at 21.10 perhour, which includes worker’scompensation, unemploymentinsurance, and other labor overheadexpenses. These numbers weregathered from the USDA ERS.17) During field preparation the field iswatered with hand lines. Thepermanent irrigation system is installedin early spring of year 1, after planting,at a cost of 50,000 (pump, filter,injector, manifold, lines and emitters)for the 20-acre field and has a 15-yearexpected life. Pumping cost estimatesare in Table 5. Repairs andmaintenance for the system costs onepercent of the purchase price per year.18) The trellis is installed in year 2 at acost of 34,000 ( 1,700/acre). This1) A typical producer of blueberries in theWillamette Valley has 20 acres ofblueberries on a 100-acre farm.2) The plant spacing is 3ft x 10ft (1,452plants/acre). Plants cost 4.00 eachand are planted in October of year 03) The field has a 25-year life includingall establishment years.4) The soil is uniform throughout the 20acre field and is well suited toblueberry production.5) Pre-planting land preparation(plowing, disking, etc.) is contractedwith custom farming providers.6) Sawdust is incorporated prior toforming raised beds and plantingblueberries.7) Sawdust mulch is used and replenishedevery three years during planting life.Note that use of weed mat instead ofsawdust mulch would change costs ofproduction (for materials and weedmanagement costs).8) Commercial production begins in year2 with typical yields of 1,500 lbs./acre.Full production begins in year 7 withtypical yields of 16,000 to 18,000lbs./acre depending upon harvestmethod.9) Various types of techniques, includingcannons and a rented AV alarm, areused to reduce bird depredation.10) Berries are hand harvested throughyear 6 of establishment and for thePage 3
owner’s investment.22) Unrecovered establishment costs areamortized over the remaining 18 yearsof assumed field life and included as afixed cost in the full productionbudget.23) Additional assumptions are listed forvariable, fixed cash, and fixed noncash costs in Table 5.24) 1,140 per year was budgeted under“Compliance”. Compliance includesrecord keeping, inspection fees,auditing, certification, documentation,training, and lab testing (e.g. waterquality). Additional information aboutCompliance can be found in Table 4.25) No adjustments were made to accountfor year to year fluctuations in yieldsand prices.26) Price inflation for the time period ofthis study is ignored.27) Owner management, family living,State and Federal income taxconsequences are ignored for thisstudy.trellis system is comprised of t-posts,metal end posts, wire, and cross arms.This figure also accounts for the costof marking out the field using a GPSsystem. This budget assumes the use ofcontract workers to drive the posts at arate of 200 per acre. Repairs andmaintenance for the system costs 1%of the purchase price per year.19) The interest rate on operating funds is8.5 percent and treated as a cashexpense. One-half of the cashexpenses are borrowed for a six-monthperiod.20) Machinery and land are owned by theoperator and assessed 8.5 and 5percent rates of interest, respectively,as a return on owner’s investment.Land is valued at 15,000 per acre.The 5 percent return on land isequivalent to the current rate landowners could charge for rent to othergrowers.21) Previous year’s net establishment costsare funded by the operator at a chargeof 10 percent interest as a return onPage 4
Page 5
Table 4. Compliance Costs and EstimationsVarious categories of compliance include legal, regulatory, and market programs. For this enterprise budgetcompliance costs are estimated to be 1,140. Specific examples by general categories are listed below. Since not allgrowers participate in all programs, we recommend that growers compliance costs be based upon specific programparticipation.For purposes of this enterprise budget, “compliance” includes: record keeping, inspection fees, auditing,certification, documentation, training, and lab testing.CategoryExamplesRange of CostsLaborOSHA Outreach Training 79-179 per certification per operationEnvironmentWater testing 70-150 per test (completed biannually) 750-1200 (valid for three years)Food AllianceMarket ChannelsFood SafetyLIVE 350/acre up to 20 acres. Plus 5/acre foradditional acres above 20.Salmon Safe 95 AnnuallyGlobal GAP 153 certificate license fees 175 for producer registration fee (foroperations between 30-100 acres)ISO (such as ISO 22000) 1,500-2,500 Initial certification 600-900 annual cost (annual audits andtrainings)FISMA – Produce Rule complianceVery small Farm: 25,000- 250,000 inannual sales, 4,477/yearSmall Farm: 250,001- 500,000 in annualsales, 12,384/yearPage 6
Table 5. Input assumptions for variable, harvest, and fixed cost, per acre.Prices per lb, fresh marketPrices per lb, processed marketLbs per acre, fresh marketLbs per acre, processed marketCost of general farm labor, per hourCost of tractor driver, per hourCost to load & haul berries, per lbBerry commission fee, per lbCost of fertilizerCost of herbicideCost of insecticideCost of fungicidesCost of tissue analysis, per acreCost of soil analysis, per acreCost of bird controlCost of bee hivesCost of plantsCost of hand-harvest labor, per lbCost of irrigation water and powerCost of cover crop seedCost of sawdust, per unitCost of loader rentalUnits of sawdustHours of labor, pruningHours of labor, spot spray herbicideHours of labor, hand weedingHours of irrigating laborHours of fertigation laborHours of labor to plantHours of trellis laborHours of IPM scoutingHours of bird controlHives per acrePortable toilets per acreTimes to herbicide spot sprayTimes to herbicide strip sprayTimes to fertilize (Dry)Times to apply fungicides&insecticideComplianceTimes to mowProperty taxesProperty insuranceLand valuesMiscellaneous & overheadFuel use gal/hr for tractorGasoline priceDiesel fuel priceOperating interest rateMachinery interest rateLand interest rateEstablishment interest rate% of operating capital borrowedMonths to borrow operating capitalPlanted bushesYear 0 0.00 0.0000 14.70 21.10 0.00 0.00 120 100 0 0 0 8 0 0 4 0.00 150 25 85 1,25019.000003205000000011211400 30 25 15,000 2003.25 3.00 3.256.0%6.0%6.0%6.0%50.0%61452Year 1 0.00 0.0000 15.39 21.24 0.00 0.00 170 100 0 0 0 0 0 0 4 0.00 150 0 85 1,25011.00021333500000.50221211403 30 25 15,000 2003.25 3.00 3.256.0%6.0%6.0%6.0%50.0%635Year 2 1.50 0.001,5000 16.34 22.56 0.03 0.04 350 100 100 50 10 0 150 80 0 0.75 150 0 0 0.000.0025213330305130.502221011405 30 25 15,000 2003.25 3.00 3.256.0%6.0%6.0%6.0%50.0%60Page 7Year 3 1.50 0.003,6000 17.30 23.89 0.03 0.04 350 100 100 250 10 0 150 80 0 0.75 150 0 0 0.000.00402033015130.752221011405 30 25 15,000 2003.25 3.00 3.256.0%6.0%6.0%6.0%50.0%60Year 4 1.50 0.007,2000 17.82 24.61 0.03 0.04 350 100 100 250 10 8 150 80 0 0.75 150 0 85 1,25011.00602033015130.752221011405 30 25 15,000 2003.25 3.00 3.256.0%6.0%6.0%6.0%50.0%60Year 5 1.50 0.0010,8000 18.36 25.34 0.03 0.04 350 100 100 250 10 0 150 80 0 0.75 150 0 0 00.00852033015130.752221011405 30 25 15,000 2003.25 3.00 3.256.0%6.0%6.0%6.0%50.0%60Year 6 1.50 0.0014,4000 18.91 26.10 0.03 0.04 350 100 100 250 10 0 150 80 0 0.75 150 0 0 00.001002033015130.752221011405 30 25 15,000 2003.25 3.00 3.256.0%6.0%6.0%6.0%50.0%60Full 1.50 0.4016,2001,800 19.47 26.89 0.03 0.04 350 100 100 250 10 2 150 80 0 0.75 150 0 85 3343.671002033015130.752221011405 30 25 15,000 2003.25 3.00 3.256.0%6.0%6.0%6.0%50.0%60
Results of establishing and producing blueberries in the Willamette Valley,OregonAs noted in Figure 4, cash net returns areexpected to exceed economic net returnsstarting in year 4 and are projected tocontinue to become increasingly higherthroughout the lifespan of theestablished operation.Cash flow analysisTable 6 shows a cash flow analysis ofestablishing blueberries in the WillametteValley. Cash costs include: labor, plants,trellis, irrigation system, fertilizer,chemicals, machinery repairs, fuel, lube andoil, operating interest (short-term),machinery insurance, and property taxes. Asnoted, earlier yields become harvestable inyear 2 with full production occurring byyear 7.Figure 5 shows the economic costs ofestablishing an operation by categorialpercentages of total economic costs. Similarto cash costs, harvesting accounted for thelargest percentage of economic costs at 41percent. Interest accounted for the secondhighest percentage of the total economicscosts at 19 percent. Other notable economiccosts include plants and fertilizer/chemical.A positive cash flow begins in year 4 withgross income exceeding total cash cost by 88.50.Figure 6 shows the impact on operation size(as measured by harvested acres) oneconomic costs. Given the assumptions inthis study, blueberry operations with lessthan 5 acres do not generate sufficient grossrevenue to recover economic costs ofproduction. This study predicts that at 5acres the operation would leave the growerin a deficit of 45,000 over 25 years. Incomparison, 10-acre, 20-acre, 40-acre and80-acre operations have cumulative returns(rounded to 1000s) of approximately 27,000, 66,000, 83,000, and 90,000.respectively. A further note on operationsize can be found in appendix B: A look atthe Oregon Blueberry Industry.As presented in Figure 3, the majority ofcash costs are associated with harvest at 51percent. The category with the next highestassociated cash costs is hired labor, whichaccounted for 15 percent of all cash costs.Other notable cash costs includedfertilizer/chemicals and plants, which eachaccounted for 6 percent of total cash costs.Economic Costs and ReturnsThis section presents the economic analysisof establishing blueberries in the Willamettevalley. This economic analysis differs fromthe cash flow analysis since interest anddepreciation costs are included in the costestimate. Also included as economic costsare returns to investments in land andequipment (reference assumption #20).Table 7 shows the economic costs andreturns associated with establishing anoperation. Net projected returns becomepositive in year 6 with net projected returnsestimated to be 1,656.In addition to Tables 6 and 7, detailedannual budgets for each year ofestablishment are provided in Appendix A,Tables 8-15.Page 8
Table 6. Cash Costs and Returns of Establishing and Producing Blueberries in Oregon's Willamette Valley.Income:Year 0Year 1Year 2Year 3Year 4Year 5Year 6Yield (lbs/acre) Price (dollars/lb) Fresh001.501.501.501.501.50Price (dollars/lb) Processed0.000.000.000.000.000.000.00Gross Variable Costs (per acre):Custom work/Rental equipt.Blue berry bushesFertilizerSoil testChemicalsSawdustCover crop seedHarvest costsPruning LaborGeneral laborMachine costsIrrigationTrellisBee hivesBird ControlPortable toiletsShop and machine shedMiscellaneous & overheadInterest: operating capitalTotal variable 6310,530.69Gross Income - Variable xed cash costs (per acre):ComplianceInsuranceProperty taxesTotal fixed cash costTotal cash 000.000.000.000.008,866.00 37.5056.4956.49200.00200.00192.32241.7013,013.98 16,355.13Full 194.7916,535.9418,564.94#REF!Net projected returns-9,357.86 -5,370.32 ative returns-9,357.86 -14,728.18 -18,919.19 -19,822.01 -19,733.51 -16,728.30 -11,664.24-5,209.19 ** Cumulative retuns for full production years is the sum of net projected returns for that year and cumulative returns from year 6.Page 9Full Prod MH0#REF!00.75#REF!#REF!#REF! *
Table 7. Economic Costs and Returns of Establishing and Producing Blueberries in Oregon's Willamette Valley.Income:Year 0Year 1Year 2Year 3Year 4Year 5Yield (lbs/acre) fresh0.000.001,500.003,600.007,200.00 10,800.00Processed0.000.000.000.000.000.00Price (dollars/lb) Fresh0.000.001.501.501.501.50Price (dollars/lb) Processed0.000.000.000.000.000.00Gross Income(dollars/acre)0.000.002,250.005,400.00 10,800.00 16,200.00Variable Costs (per acre):Custom work/Rental equipt.Blue berry bushesFertilizerSoil testChemicalsSawdustCover crop seedHarvest costsPruning LaborGeneral laborMachine costsIrrigationTrellisBee hivesBird ControlPortable toiletsShop and machine shedMiscellaneous & overheadInterest: operating capitalTotal variable costsGross revenue - Variable costsFixed cash costs (per acre):ComplianceInsuranceProperty taxesTotal fixed cash costTotal cash costFIXED NON-CASH COSTSMach. & equip. - dep., & int.Pickup - dep. & intIrrig. and Trellis - dep. & int.Shop & machine shedLand interest chargeInt. on prior year's est. costsAmortized establishment costsTotal fixed non-cash costsTotal fixed costsYear 6 Full Prod HH Full Prod ,58019,94424,186#REF!Net projected ulative 26,574* Cumulative retuns for full production years is the sum of net projected returns for that year and cumulative returns from year 6.Page 10834-25,740 F!#REF!#REF!#REF!#REF!#REF!0.00#REF!#REF!#REF! *
200,000 150,000 100,000 50,000 0- 50,0000 1 2 3 4 5 6 7 8 9 10 11 12 13 14 15 16 17 18 19 20 21 22 23 24 25Cash returnsEconomic returnsFigure 4. Comparison of cumulative net cash returns and cumulative net economic returns per acre forestablishment and production of fresh market blueberries in Oregon's Willamette Valley over 25years.Page 11
Figure 5. Economic costs per acre from years 0 - 7 to establish and produce fresh market blueberries inOregon's Willamette Valley.Figure 6. Projected annual economic returns per acre by farm size for hand harvestedblueberries, over 25 years of establishment and production.Page 12
ConclusionsReferencesThis cost-of-establishment study is abaseline benchmark to be used as areference point for fresh and processedmarket blueberry producers andinvestors who are considering plantingberries. Like any other enterprisebudget, however, the intent is thatproducers use their own estimates ofcurrent costs in the budget to make itmore relevant and specific to theiroperations. Many tools are availableto assist in budgeting such as templatesfrom university farm managementspecialists and computer softwareprograms such as AgProfitTM.AgProfitTM is available as a downloadfor free at (www.agbizprofit.org).Talk with your local extension agent tofind the latest in tools and budgetinformation.Burton, J. (2017, April). Top 10 BlueberryProducing States in America. hetop-blueberry-states-in-america.html.Stills, S. Stark, R. (2016). Estimating FarmMachinery Costs: Agricultural EngineersYearbook of Standards. University ofArkansas. Retrieved f.USDA. Farm labor. Economic Research Service.Retrieved rm-labor/#wages.Growers should consider the impactthat a particular enterprise such as ablueberry planting can have on theoverall financial stability of the farmbusiness. Financial managers canrecommend planting one crop overanother to improve profitability, butthe financial requirements to completethe planting could jeopardize cashflows, increase the debt-to-asset ratio,and diminish the solvency of the farm.There are many economic andfinancial considerations to reviewbefore such decisions are made.Seeking advice from universityextension and research faculty,industry representatives, or consultantscan help in those decisions and keep afarm profitable and economicallyviable over time.Page 13
Appendix AAnnual Enterprise Budgets – Establishment through Full ProductionPage 14
Table 8. Year 0, Blueberry Establishment, /acre economic costs and returns.VARIABLE CASH COSTSDescriptionLabor Machinery MaterialsTotalSoil sample0.2 x / -----------Land prep, custom operation200.00Rip, plow, drag and roll2 x / ---------Weed Control 114.93Herbicide spray application1 x / acre 9.75 5.18Herbicide 100 / acre -----Sawdust application1,677.50Sawdust19 units @ 85 / unit1,615.00Loader rental 1250 / 20 acre --------Fertilizer, preplant application2 x / acre9.244.70133.94Fertilizer 120 / ---------Incorporate fert.2 x / acre10.445.3525.79Rototiller, rental 200 / 20 acre --------Mark field2 hrs / acre @ 15.38502 / hr29.4010.0039.40Shape beds, custom2 x / ---------------Plant bushes5,817.00Plant material 3.5 / plant @ 1452 plants / acre5,082.00Labor50 hrs / acre @ 15.38502 / -------Drag field1 x / ----------------Seed cover crop between rows1 x / acre11.095.6741.76Seed 25 / --------Irrigation169.70Handline labor, preplant1 hr / acre @ 15.38502 / hr14.70Handline rental5.00Power 150 / ---------Pickup42.1242.12ATV3.933.93Shop and machine shed56.4956.49Miscellaneous and overhead200.00200.00Interest: operating capital6 months132.55132.55Total variable costs828.8671.65 8,276.549,177.05FIXED CASH COSTSCompliancePickup & ATV insuranceProperty insuranceProperty taxesTotal fixed cash 180.81FIXED NON-CASH COSTSMach. & equip. - dep., & int.Pickup & ATV - dep. & intShop & machine shedLand interest chargeTotal fixed non-cash 001,210.51Total fixed costs1,391.32Total of all costs per acreProjected Net Returns 10,568- 10,568Page 15
Table 9. Year 1, Blueberry Establishment, /acre economic costs and returns.VARIABLE CASH COSTSDescriptionLabor MachineryMaterialsTotalWeed Control 391.41Herbicide sprayer2 x / acre19.5010.36Spot spray2 x / acre61.54Spot spray labor2 hrs / acre @ 15.38502 / hrHand weeding13 hrs / acre @ 15.38502 / hr200.01Herbicide 100 / -Sawdust application997.50Sawdust11 units @ 85 / unit935.00Loader rental 1250 / 20 acre Fertilization230.10Spreader appliation2 x / acre9.244.70Fertigation labor3 hrs / acre @ 15.38502 / hr 46.16Fertilizer 170 / -Irrigation620.40Labor, installation32 hrs / acre @ 14.7 / hr470.40Water and power 150 / -Plant bushes196.00Blueberry bush 3.5 / plant @ 35 plants / acre122.50Labor5 hrs / acre @ 15.38502 / hr ng between rows3 x / acre26.0914.7640.86Portable toilet0.5 unit / acre18.7518.75Pickup42.1242.12ATV3.933.93Shop and machine shed56.4956.49Miscellaneous and overhead200.00200.00Interest: operating capital6 months41.9641.96Total variable costs906.4375.871,857.202,839.51FIXED CASH COSTSCompliancePickup & ATV insuranceProperty insuranceProperty taxesTotal fixed cash 180.81FIXED NON-CASH COSTSMach. & equip. - dep., & int.Pickup & ATV - dep. & intIrrig. - dep. & int.Shop & machine shedLand interest chargeInt. on prior year's establishment costsTotal fixed non-cash 6.67198.95900.00634.102,134.03Total fixed costs2,314.84Total of all costs per acreProjected Net Returns 5,154.35- 5,154.35Page 16
Table 10. Year 2, Blueberry Establishment, /acre economic costs and returns.TOTAL GROSS INCOMEQuantityUnitBlue berries, fresh market1,500lbsTotal gross income /Unit1.50Total 2,250 2,250VARIABLE CASH COSTSPruning and brush mgmtDescriptionLabor Machinery MaterialsTotal Cost /lb25 hr / acre @ 16.340429742408.51/ Weed Control 407.650.27Herbicide sprayer2 x / acre19.5010.36Spot spray2 x / acre65.36Spot spray labor2 hrs / acre @ 16.340429742 / hrHand weeding13 hrs / acre @ 16.340429742212.43/ hrHerbicide 100 / sease and insect control399.340.27Pesticide applications10 x / acre147.86101.48Fungicide 50 / acre50.00Insecticide 100 / rtilization426.900.28Spreader appliation2 x / acre18.489.40Fertigation labor3 hrs / acre @ 16.34042974249.02/ hrFertilizer 350 / rd control166.340.11Labor1 hr / acre @ 16.34042974216.34/ hrEquipment 150 / rvest1,240.000.83Contract laborers 0.75 / lb.1,125.00Load & haul berries 0.03 / lb.45.00Berry commission fees 0.04 / lb.60.00Tissue analysis0.2 x / igation224.020.15Labor3 hrs / acre @ 16.34042974249.02/ hrRepairs & maint. 25 / acre25.00Water and power 150 / ellis490.210.33Installation labor30 hrs / acre @ 16.340429742490.21/ ----------------------------------------Mow between rows5 x / acre43.4924.6168.090.05Bee hives3 hives @ 80 / hive240.00240.000.16IPM scouting5 hrs / acre @ 16.34042974281.70/ hr81.700.05Portable toilet0.5 unit / .00Shop and machine shed56.4956.490.04Miscellaneous and overhead200.00200.000.13Interest: operating capital6 months67.3967.390.04Total variable costs######191.902,766.38 4,560.203.04FIXED CASH COSTSCompliancePickup & ATV insuranceProperty insuranceProperty taxesTotal fixed cash costsUnitacreacreacreacreTotal Cost IXED NON-CASH COSTSMach. & equip. - dep., & int.Pickup & ATV insuranceIrrig. & trellis - dep. & in
12) Blueberry fresh market price is 1.50 per lb. and the processed market price is 0.40 per lb. 13) A machine shed and all farm equipment are owned by the operator. 14) The machinery and equipment used in the budget reflect the typical machinery complement of a Willamette Valley blueberry grower. A detailed breakdown of machinery