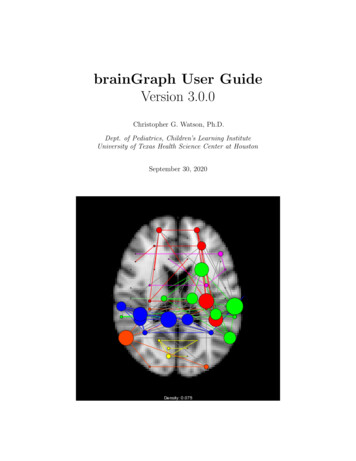
Transcription
brainGraph User GuideVersion 3.0.0Christopher G. Watson, Ph.D.Dept. of Pediatrics, Children’s Learning InstituteUniversity of Texas Health Science Center at HoustonSeptember 30, 2020
Table of ContentsList of Tables . . . . . . . . . . . . . . . . . . . . . . . . . . . . . . . . . . . . . . . . . . . .viiiPreface . . . . . . . . . . . . . . . . . . . . . . . . . . . . . . . . . . . . . . . . . . . . . . . .ixIIntroductory Material1Chapter 1: Installation and Requirements . . . . . .1.1: System Requirements . . . . . . . . . . . . . . . . .1.2: GUI-related note . . . . . . . . . . . . . . . . . . . .1.3: OS-specific instructions and notes . . . . . . . . . . .1.3.1 Preferred method, any OS . . . . . . . . . . .1.3.2 Linux . . . . . . . . . . . . . . . . . . . . . .1.3.3 Mac . . . . . . . . . . . . . . . . . . . . . . .1.3.4 Windows . . . . . . . . . . . . . . . . . . . .1.4: Compatible neuroimaging software . . . . . . . . . .1.5: Compatible atlases . . . . . . . . . . . . . . . . . . .1.5.1 Using your own atlas: required format . . . .1.5.2 Atlases to be added (potential) . . . . . . . . . . . . . . . . . . . . . . . . . . . . . . . . . . . . . . . . . . . . . . . . . . . . . . . . . . . . . . . . . . . . . . . . . . . . . . . . . . . . . . . . . . . . . . . . . . . . . . . . . . . . . . . . . . . . . . . . . . . . . . .223333444566Chapter 2: Getting Help and Other Resources . . .2.1: Getting help . . . . . . . . . . . . . . . . . . . . . . .2.2: Learning resources . . . . . . . . . . . . . . . . . . .2.2.1 Graph theory . . . . . . . . . . . . . . . . . .2.2.2 R programming . . . . . . . . . . . . . . . . .2.3: Other R packages . . . . . . . . . . . . . . . . . . . .2.3.1 Other network-related packages . . . . . . . .2.3.2 Medical Imaging Task View . . . . . . . . . .2.3.3 Neuroconductor . . . . . . . . . . . . . . . .2.3.4 Implementations of popular MRI software . .2.3.5 Other . . . . . . . . . . . . . . . . . . . . . .2.4: Validation of graph metrics . . . . . . . . . . . . . . . . . . . . . . . . . . . . . . . . . . . . . . . . . . . . . . . . . . . . . . . . . . . . . . . . . . . . . . . . . . . . . . . . . . . . . . . . . . . . . . . . . . . . . . . . . . . . . . . . . . . . . . . . . . . . . . . . . . . . .777788888899Chapter 3: Getting data from Freesurfer and3.1: Structural data from Freesurfer . . . . . . .3.2: Tractography . . . . . . . . . . . . . . . . .3.2.1 Create/convert parcellated volume .3.2.2 Get individual seed ROI’s . . . . . . . . . . . . . . . . . . . . . . . . . . . . . . . . . . . . . . . . . . . . . . . . . . . . . . .1111111212IIFSL . . . . . . . . . . . . . . . . .brainGraph Basics14Chapter 4: Overview of the brainGraph Package . . . . . . . . . . . . . . . . . . . . . . .4.1: Concepts/workflow . . . . . . . . . . . . . . . . . . . . . . . . . . . . . . . . . . . . . . . .ii1515
4.1.1 “Step 0”: Setting up data and scripts . . .4.1.2 Step 1: Import data and create connectivity4.1.3 Step 2: Create graphs and calculate metrics4.1.4 Step 3: Perform group analyses . . . . . . .4.1.5 Step 4: Visualize results . . . . . . . . . . .4.2: Functions . . . . . . . . . . . . . . . . . . . . . . .4.2.1 Graph creation . . . . . . . . . . . . . . . .4.2.2 Graph metrics . . . . . . . . . . . . . . . .4.2.3 Group comparison . . . . . . . . . . . . . .4.2.4 Visualization . . . . . . . . . . . . . . . . .4.2.5 Random graphs, small world, and rich club4.2.6 Generic methods . . . . . . . . . . . . . . .Chapter 5: Getting started . . . . .5.1: Setting up files for your project .5.1.1 Project scripts . . . . . .5.1.2 Package global options . .5.1.3 Loading required packages5.1.4 Project data . . . . . . .5.1.5 Data Compatibility . . . .5.2: Graph object attributes . . . . .5.2.1 The summary method . .5.2.2 Graph-level attributes . .5.2.3 Vertex-level attributes . .5.2.4 Edge-level attributes . . .5.3: Community detection . . . . . .5.4: Plotting . . . . . . . . . . . . . .5.4.1 MNI152 template . . . . .5.4.2 Axial . . . . . . . . . . .5.4.3 Sagittal . . . . . . . . . .5.4.4 Circular . . . . . . . . . .III. . . . . .matrices. . . . . . . . . . . . . . . . . . . . . . . . . . . . . . . . . . . . . . . . . . . . . . . . . . . . . . . . . . . . . . . . . . . . . . . . . . . . . . . . . . . . . . . . . . . . . . . . . . . . . . . . . . . . . . . . . . . . . . . . . . . . . . . . . . . . . . . . . . . . . . . . . . . . . . . . . . . . . . . . . . . . . . . . . . . . . . . . . . . . . . . . . . . . . . . . . . . . . . . . . . . . . . . . . . . . . . . . . . . . . . . . . . . . . .151516161616161717181818. . . . . . . . . . . . . . . . . . . . . . . . . . . . . . . . . . . . . . . . . . . . . . . . . . . . . . . . . . . . . . . . . . . . . . . . . . . . . . . . . . . . . . . . . . . . . . . . . . . . . . . . . . . . . . . . . . . . . . . . . . . . . . . . . . . . . . . . . . . . . . . . . . . . . . . . . . . . . . . . . . . . . . . . . . . . . . . . . . . .202020212222232323252626272727282829Graph Creation31Chapter 6: Structural covariance networks . . . . . .6.1: Overview . . . . . . . . . . . . . . . . . . . . . . . .6.1.1 Complete example . . . . . . . . . . . . . . .6.2: Import the data . . . . . . . . . . . . . . . . . . . . .6.2.1 Custom atlas . . . . . . . . . . . . . . . . . .6.3: Model residuals . . . . . . . . . . . . . . . . . . . . .6.3.1 Function arguments . . . . . . . . . . . . . .6.3.2 Return value . . . . . . . . . . . . . . . . . .6.3.3 Example . . . . . . . . . . . . . . . . . . . . .6.4: Data checking . . . . . . . . . . . . . . . . . . . . . .6.4.1 Summary . . . . . . . . . . . . . . . . . . . .6.4.2 Plot . . . . . . . . . . . . . . . . . . . . . . .6.5: Correlation Matrix and Graph Creation . . . . . . .6.5.1 Excluding regions . . . . . . . . . . . . . . . .6.5.2 Graph creation . . . . . . . . . . . . . . . . .6.6: Getting measures of interest . . . . . . . . . . . . . .6.7: Long and wide data tables . . . . . . . . . . . . . . .3232323334343435353535363737373840Chapter 7: Tractography and fMRI . . . . . . . . . . . . . . . . . . . . . . . . . . . . . .41iii. . . . . . . . . . . . . . . . . . . . . . . . . . . . . . . . . . . . . . . . . . . . . . . . . . . . . . . . . . . . . . . . . . . . . . . . . . . . . . . . . . . . . . . . . . . . . . . . . . . . . . . . . . . . . . . . . . . . . . . . . . . . . . . . . . . . . . . . . . . . . . . . . . . . . . . . . . . . . . . . . . . . . . . . . .
7.1: Setting up . . . . . . . . . . . . . . . . . . . . . . . . .7.1.1 Tractography . . . . . . . . . . . . . . . . . . .7.1.2 fMRI . . . . . . . . . . . . . . . . . . . . . . . .7.2: Import, normalize, and filter matrices for all subjects .7.2.1 Function arguments . . . . . . . . . . . . . . .7.2.2 Return value . . . . . . . . . . . . . . . . . . .7.2.3 Code example . . . . . . . . . . . . . . . . . . .7.2.4 Applying the same thresholds to other matrices7.3: Graph creation . . . . . . . . . . . . . . . . . . . . . .7.4: Graph- and vertex-level measures . . . . . . . . . . . .7.5: Example commands . . . . . . . . . . . . . . . . . . .IV.Group Analyses: GLM-based414142424344454545474749Chapter 8: Vertex-wise group analysis (GLM) . . . . .8.1: Function arguments . . . . . . . . . . . . . . . . . . .8.1.1 Mandatory . . . . . . . . . . . . . . . . . . . .8.1.2 Optional . . . . . . . . . . . . . . . . . . . . . .8.1.3 Unnamed: design matrix arguments . . . . . .8.2: Return object . . . . . . . . . . . . . . . . . . . . . . .8.2.1 Return object: DT . . . . . . . . . . . . . . . .8.3: Tutorial: design matrix coding . . . . . . . . . . . . .8.3.1 Suggested reading . . . . . . . . . . . . . . . .8.3.2 Dummy coding . . . . . . . . . . . . . . . . . .8.3.3 Cell means coding . . . . . . . . . . . . . . . .8.3.4 Effects coding . . . . . . . . . . . . . . . . . . .8.4: Examples . . . . . . . . . . . . . . . . . . . . . . . . .8.4.1 Two-group difference . . . . . . . . . . . . . . .8.4.2 Two-group difference adjusted for covariate . .8.4.3 Two-group difference with continuous covariate8.4.4 Two-way between subjects ANOVA: 2x2 . . . .8.4.5 Two-way between subjects ANOVA: 2x3 . . . .8.4.6 Three-way between subjects ANOVA: 2x2x2 .8.5: Permutation testing . . . . . . . . . . . . . . . . . . .8.5.1 Example . . . . . . . . . . . . . . . . . . . . . .8.6: Plotting LM diagnostics . . . . . . . . . . . . . . . . .8.7: Create a graph of the results . . . . . . . . . . . . . .8.8: Plotting a graph of the results . . . . . . . . . . . . . . . . . . . . . . . . . . . . . . . . . . . . . . . . . . . . . . . . . . . . . . . . . . . . . . . . . . . . . . . . . . . . . . . . . . . . . . . . . . . . . . . . . . . . . . . .interaction. . . . . . . . . . . . . . . . . . . . . . . . . . . . . . . . . . . . . . . . . . . . . . . . . . . . . . . . . . . . . . . . . . . . . . . . . . . . . . . . . . . . . . . . . . . . . . . . . . . . . . . . . . . . . . . . . . . . . . . . . . . . . . . . . . . . . . . . . . . . . . . . . . . . . . . . . . . . . . . . . . . . . . . . . . . . . . . . . . . . . . . . . . . . . . . . . . . . . . . . . . . . . . . . . . . . . . . . . . . . . . . . . . . . . . . . . . . . . . . . . . . . . . . . . . . . . . . . . . . . . . . . . . . . . . . . . . . . . . . . . . . . . . . hapter 9: Multi-threshold permutation9.1: Background . . . . . . . . . . . . . . .9.1.1 MTPC procedure . . . . . . . .9.2: Function arguments . . . . . . . . . .9.2.1 Mandatory . . . . . . . . . . .9.2.2 Optional . . . . . . . . . . . . .9.2.3 Unnamed . . . . . . . . . . . .9.3: Return value . . . . . . . . . . . . . .9.4: Code example . . . . . . . . . . . . . .9.5: Plotting the statistics . . . . . . . . .9.6: Create a graph of the results . . . . .9.7: Plotting a graph of the results . . . . . . . . . . . . . . . . . . . . . . . . . . . . . . . . . . . . . . . . . . . . . . . . . . . . . . . . . . . . . . . . . . . . . . . . . . . . . . . . . . . . . . . . . . . . . . . . . . . . . . . . . . . . . . . . . . . . . . . . . . . .717171727272737374777979Chapter 10: Network-based statistic (NBS) . . . . . . . . . . . . . . . . . . . . . . . . . .81correction. . . . . . . . . . . . . . . . . . . . . . . . . . . . . . . . . . . . . . . . . . . . . . . . . . . . . . . . . . . . . . . . . . .iv.
10.1: Background . . . . . . . . . . .10.2: Function arguments . . . . . .10.3: Return value . . . . . . . . . .10.4: Code example . . . . . . . . . .10.5: Creating a graph of the results10.6: Plotting the results . . . . . . .10.7: Testing . . . . . . . . . . . . .81818283848585Chapter 11: Graph- and vertex-level mediation analysis11.1: Background . . . . . . . . . . . . . . . . . . . . . . . . .11.1.1 Suggested reading . . . . . . . . . . . . . . . . .11.2: Notation . . . . . . . . . . . . . . . . . . . . . . . . . . .11.3: Function arguments . . . . . . . . . . . . . . . . . . . .11.3.1 Mandatory . . . . . . . . . . . . . . . . . . . . .11.3.2 Optional . . . . . . . . . . . . . . . . . . . . . . .11.4: Return value . . . . . . . . . . . . . . . . . . . . . . . .11.5: Code example . . . . . . . . . . . . . . . . . . . . . . . .11.5.1 Printing a summary . . . . . . . . . . . . . . . .11.6: Create a graph of the results . . . . . . . . . . . . . . .11.7: Plot a graph of the results . . . . . . . . . . . . . . . . .11.8: Benchmarks . . . . . . . . . . . . . . . . . . . . . . . . . . . . . . . . . . . . . . . . . . . . . . . . . . . . . . . . . . . . . . . . . . . . . . . . . . . . . . . . . . . . . . . . . . . . . . . . . . . . . . . . . . . . . . . . . . . . . . . . . . . . . . . . . . . . . . . . . . . . . . . . . . . . . . . . . .87878888888989909192949495V.Group Analyses: Other96Chapter 12: Random graphs, small world, and rich-club12.1: Random graph generation . . . . . . . . . . . . . . . . .12.1.1 Simple random graph generation . . . . . . . . .12.1.2 Control for clustering . . . . . . . . . . . . . . .12.1.3 Random covariance matrices . . . . . . . . . . .12.2: Small-worldness . . . . . . . . . . . . . . . . . . . . . . .12.3: Rich-club Analysis . . . . . . . . . . . . . . . . . . . . .12.3.1 Rich-core . . . . . . . . . . . . . . . . . . . . . .12.3.2 Rich-club plots . . . . . . . . . . . . . . . . . . .12.3.3 Rich-club attributes . . . . . . . . . . . . . . . .12.4: Single-subject networks . . . . . . . . . . . . . . . . . . . . . . . . . . . . . . . . . . . . . . . . . . . . . . . . . . . . . . . . . . . . . . . . . . . . . . . . . . . . . . . . . . . . . . . . . . . . . . . . . . . . . . . . . . . . . . . . . . . . . . . . . . . . . . .979797989899102102102102103Chapter 13: Bootstrapping and permutation13.1: Bootstrapping . . . . . . . . . . . . . . . .13.1.1 Function arguments . . . . . . . .13.1.2 Return value . . . . . . . . . . . .13.1.3 Code example . . . . . . . . . . . .13.1.4 Plotting the results . . . . . . . . .13.2: Permutation testing . . . . . . . . . . . .13.2.1 Function arguments . . . . . . . .13.2.2 Return value . . . . . . . . . . . .13.2.3 Graph-level . . . . . . . . . . . . .13.2.4 Vertex measures . . . . . . . . . .13.2.5 Area-under-the-curve (AUC) . . .13.2.6 Custom function . . . . . . . . . .Chapter 14: Further analysis14.1: Robustness . . . . . . .14.1.1 Targeted attack .14.1.2 Random failure .testing . . . . . . . . . . . . . . . . . . . . . . . . . . . . . . . . . . . . . . . . . . . . . . . . . . . . . . . . . . . . . . . . . . . . . . . . . . . . . . . . . . . . . . . . . . . . . . . . . . . . . . . . . . . . . . . . . . . . . . . . . . . . . . . . . . . . . . . . . . . . . . . . . . . . . . . . . . . . . . . . . . . . . . . . . . . . . . . . . . . . . . . . . . . . . .105105105106106107107107108109111112114. . . . . . . . . . . . . . . . . . . . . . . . . . . . . . . . . . . . . . . . . . . . . . . . . . . . . . . . . . . . . . . . . . . . . . . . . . . . . . .116116116117v
14.2: Euclidean distance . . .14.3: Individual contributions14.3.1 Add one patient14.3.2 Leave one out . .14.3.3 Plot types . . . .VI.Visualization125Chapter 15: GUI and other plotting functionality . .15.1: The GUI . . . . . . . . . . . . . . . . . . . . . . . . .15.1.1 Orientation . . . . . . . . . . . . . . . . . . .15.1.2 Hemi/Edges . . . . . . . . . . . . . . . . . . .15.1.3 Annotations . . . . . . . . . . . . . . . . . . .15.1.4 Vertex “decorations” . . . . . . . . . . . . . .15.1.5 Edge “decorations” . . . . . . . . . . . . . . .15.1.6 Vertex groups . . . . . . . . . . . . . . . . . .15.1.7 Keyboard shortcuts . . . . . . . . . . . . . .15.2: Other plotting . . . . . . . . . . . . . . . . . . . . .15.2.1 Adjacency matrix plots . . . . . . . . . . . .15.2.2 Plot global graph measures . . . . . . . . . .15.2.3 Save a three-panel plot of the brain graphs .15.2.4 Save a single view for multiple brain graphs .15.2.5 Plot vertex-level measures . . . . . . . . . . .15.2.6 Plot group-wise volumetric data for ROI’s . .15.2.7 Save a list of graph plots . . . . . . . . . . .15.2.8 Other visualization tools . . . . . . . . . . . . . . . . . . . . . . . . . . . . . . . . . . . . . . . . . . . . . . . . . . . . . . . . . . . . . . . . . . . . . . . . . . . . . . . . . . . . . . . . . . . . . . . . . . . . . . . . . . . . . . . . . . . . . . . . . . . . . . . . . . . . . . . . . . . . . . . . . . . . . . . . . . . . . . . . . . . . . . . . . . . . . . . . . . . . . . . . . . . . . . .AppendicesChapter A: Attributes created by setA.1: Graph-level . . . . . . . . . . . . .A.1.1 Housekeeping . . . . . . . .A.1.2 Unweighted . . . . . . . . .A.1.3 Weighted . . . . . . . . . .A.2: Vertex-level . . . . . . . . . . . . .A.2.1 Housekeeping/Other . . . .A.2.2 Unweighted . . . . . . . . .A.2.3 Weighted . . . . . . . . . .A.3: Edge-level . . . . . . . . . . . . . 29129129129130130130130. . . . . . . . . . . . . . . . . . . . . . . . . . . . . . . . . . . . . . . . . . . . . . . . . . . . . . . . . . . . . . . . . . . . . . . . . . . . . . . . . . . . . . . . . . . . . . . . . . . .143143143143144144144145146146. . . . . . . . . . . . . . . . . . . . . . . . . . . . . . . . . . . . . . . . . . . . . . . . . . . . . . . . . . . . . . . . . . . . . . . . . . . . . . . .147147147148149150151151Chapter C: Functions for generic data . . . . . . . . . . . . . . . . . . . . . . . . . . . . .153Chapter D: Benchmarks . . . . . . . . . . . . . . . . . . . . . . . . . . . . . . . . . . . . .D.1: GLM-related benchmarks . . . . . . . . . . . . . . . . . . . . . . . . . . . . . . . . . . . .155155brainGraph. . . . . . . . . . . . . . . . . . . . . . . . . . . . . . . . . . . . . . . . . . . . . . . . . . . . . . .attr. . . . . . . . . . . . . . . . . . . . . . . . . . . .Chapter B: GLM Statistics . . . . . . . . . . . . . . .B.1: Model fitting . . . . . . . . . . . . . . . . . . . . . .B.2: Contrast-based statistics . . . . . . . . . . . . . . . .B.3: GLM methods . . . . . . . . . . . . . . . . . . . . .B.3.1 Basic information . . . . . . . . . . . . . . . .B.3.2 Model fit statistics . . . . . . . . . . . . . . .B.3.3 Diagnostic/Influence measures . . . . . . . .B.3.4 Other statistics . . . . . . . . . . . . . . . . .vi.
D.1.1 Randomise . . . .D.1.2 NBS . . . . . . . .D.1.3 Mediation . . . . .D.2: Random graph generation.155156156156Chapter E: Computing environment . . . . . . . . . . . . . . . . . . . . . . . . . . . . . .158vii.
List of Tables1.1List of atlases. . . . . . . . . . . . . . . . . . . . . . . . . . . . . . . . . . . . . . . . . .52.1Network packages . . . . . . . . . . . . . . . . . . . . . . . . . . . . . . . . . . . . . . . . .84.1Class names and graph creation functions. . . . . . . . . . . . . . . . . . . . . . . . . . . .188.1GLM graph attributes. . . . . . . . . . . . . . . . . . . . . . . . . . . . . . . . . . . . . . .699.1MTPC graph attributes. . . . . . . . . . . . . . . . . . . . . . . . . . . . . . . . . . . . . .7910.1 NBS graph attributes. . . . . . . . . . . . . . . . . . . . . . . . . . . . . . . . . . . . . . .8511.1 Mediation graph attributes. . . . . . . . . . . . . . . . . . . . . . . . . . . . . . . . . . . .9412.1 Rich-club graph attributes. . . . . . . . . . . . . . . . . . . . . . . . . . . . . . . . . . . .102D.1 Benchmarks, randomise . . . . . . . . . . . . . . . . . . . . . . . . . . . . . . . . . . . . .D.2 Benchmarks, NBS . . . . . . . . . . . . . . . . . . . . . . . . . . . . . . . . . . . . . . . .D.3 Benchmarks, mediation analysis. . . . . . . . . . . . . . . . . . . . . . . . . . . . . . . . .155156156viii
PrefacebrainGraph is an R package for performing graph theory analysis of brain MRI data. It started out essentiallyas one long script I wrote while taking a course in Fall 2013 on the statistical analysis of network data.Initially, the functionality was specific to cortical thickness data only (from Freesurfer), but I have sinceextended it to include functionality for DTI tractography (e.g., fdt network matrix from FSL’s probtrackx2,and matrices from PANDA (21)) and resting-state fMRI (e.g., DPABI (132) and AFNI (17)). It should work forany data that can be represented as a connectivity matrix.There is some plotting functionality, but it doesn’t look as “polished” as other software. (However, it lookscomparable to figures I have seen in publications; see Plotting for some example plots and a function toexport the network data, and The GUI for a few screenshots of the GUI).Organization of this ManualAt the highest level of organization, there are several Parts. The general contents of each part are:Introductory material contains installation information, validity of graph metrics calculated by igraphand brainGraph, neuroimaging software and brain atlas compatibility, how to get help, other R packagesthat may be of interest to neuroimaging researchers, and some code examples for getting data fromFreesurfer and FSL.brainGraph basics contains information for starting to use the package. This includes a general overviewof the package, a brief introduction to R notation/conventions, a recommended workflow/script organization,and an introduction to the package’s features and most basic operations.Graph creation covers the necessary steps for creating graphs from your neuroimaging data. Thereare separate chapters for structural covariance networks and data for which single-subject networks canbe created (e.g., DTI tractography or resting-state fMRI). The code blocks in these chapters start withimporting your data and end with some example operations you can perform on the graphs.Group analyses detail the available methods for comparing groups (or performing within-group analyses).These include the standard GLM, the Network-Based Statistic (NBS), and statistical mediation analysis forsingle-subject graphs. For covariance networks, this includes bootstrapping, permutation/randomizationtests, and individual contributions. And for both types of network, random graph generation, small worldcalculations, and rich club analysis.Visualization describes the components of the brainGraph GUI, in addition to other functions forvisualizing different aspects of your data, such as adjacency matrix plots, plotting global (graph-level)metrics by density, boxplots of vertex-level metrics, creating three-panel plots of the networks overlaid on abrain MRI slice, and saving a list of graph plots. The chapter closes with description of a function forexporting your data to work with the BrainNet Viewer tool.Appendices list the attributes set by the function set brainGraph attr, several benchmarks (i.e.,runtimes) for various functions/analyses, and the computing environment used in creating this document.ix
Intended AudienceThis User Guide is appropriate for researchers who use brain MRI to study connectivity. brainGraphis not strictly limited to human MRI data, but it does not contain atlases for animal brains (but thesecan be provided by the user). It is expected that the user has some experience with R (and/or otherprogramming languages), but this document should be appropriate for beginners. The user should have someunderstanding of network/graph theoretical concepts. This User Guide is quite long, but I have attempted tobe comprehensive in documenting the functions in the package and the types of analysis that are common inneuroimaging, with extensive code examples and figures. To learn more about the relevant topics (i.e., themathematics of networks, R programming), see some of my suggestions at Getting Help and Other Resources.If you are a non-MRI researcher, there are many functions you can still use. See Functions for generic datafor a list.Rationale“The nice thing about standards is that you have so many to choose from.”— Andrew S. TanenbaumOther tools for performing graph theory analysis of brain MRI data already exist. So why create a new one,and why do it in R?R is Free Software Using R does not require an expensive license (like Matlab), and does not involveany “red tape” (such as the need to upgrade annually, having to deal with a licensing office, etc.). You cansimply download and install it. R is also open source, so you can add features, fix bugs, etc. Finally, youcan write your own packages, either for personal or public use. This package is, and will remain tobe, free and open source, in line with the recent push for sharing your code along with publications(see Eglen et al. (32) for discussion).R was made to do statistics The designers of R were statisticians (as are most/all of the R coremembers). Many statisticians use R in their work. Additionally, there are currently more than 10,000packages in the CRAN repository (as of Sep. 2020), many of which are created and maintained by expertsin statistics. If there is a statistical analysis you would like to perform, there’s a good chance it is availablein R. The R community is very extensive, with multiple e-mail lists, blogs, and forums (such as StackOverflow) available for help.Package management Package management is very well done in R; downloading and updating packagesis nearly trivial. I have had a much easier time with R compared to dealing with dependencies for e.g., somePython-based software (I know there is pip, but I had some issues; see this Stack Overflow question, whichI’m sure is now out-of-date). I consider myself tech-savvy, so I imagine it would be even more frustratingfor beginners. Downloading and installing brainGraph and its dependencies should be very simple, so theuser can focus on learning graph theory and how to interact with their data.Documentation I have found the documentation for other tools/software specializing in graph theoryanalysis of MRI data to be lacking (and in some cases non-existent), particularly in terms of the first step:getting your data (cortical thickness/volumes, tractography, etc.) into a format that will just work. It hasbeen said that software is “only as good as its documentation”; I appreciate that many users just want atutorial to walk them through the steps, and I hope I have succeeded in that aspect.Good support for reproducible research It is very easy to generate reproducible reports (or documents such as this one) on-the-fly. For this User Guide, I used knitr (131) with LATEX, and all the code isin a git repository for version control. This system allows for easy documentation of analysis workflow andany changes in output resulting from parameter changes; (re-)running all the code is essentially automatic(I simply press \kp using Nvim-R with tmux to knit the pdf). I use the same process for generating resultsx
from other analyses I do in R, such as reporting summary statistics from DTI analyses of FA/MD/RD.1Furthermore, Tables are generated automatically, so I don’t have to type all entries by hand, or copy-pastethings and worry about formatting (reducing user error). In fact, my dissertation was written with knitrand LATEX because of these features.Why isn’t there a “main” GUI?Although GUI’s can be helpful to beginners, I chose not to create a “point-and-click” GUI for all of theprocessing/analysis steps (except for exploring the results visually with plot brainGraph gui) because Ithink it is of paramount importance to be “closer” to your data, instead of expecting a software package todo all of the work. That said, this User Guide will provide examples for data organization and example codeto be placed in scripts that you can then run from the R console. So technically, you could “copy-paste” thecode from this User Guide and complete your analyses without paying attention, but I don’t recommend it.Inspect your data at every step. I believe I have provided enough code to do that easily.Typographical conventionsI use different font styles to indicate different types of objects: Software tools/packages, R functions/objects (not in brainGraph), inline code, data objects (e.g.,function arguments or data column names), and filenames are printed in monospace font. Functions in the brainGraph package are highlighted and in monospace font. R code is printed in monospace font in a box with light gray background , with syntax highlighting applied. Linux command-line code is printed
brainGraph User Guide Version 3.0.0 Christopher G. Watson, Ph.D. Dept. of Pediatrics, Children's Learning Institute University of Texas Health Science Center at Houston

