Transcription
ISSN: 2546-0625Republic of the PhilippinesPhilippine Statistics AuthoritySolid Responsive World-class
Photos:Hogs on Farm. Retrieved on May 31, 2016, fromwww.cornbeanspigskids.com.Lechon. Retrieved on May 31, 2016 fromwww.kalderoatkusina.blogspot.comPiglets on Grass. Retrieved on May 31, 2016 from www.syfrettfeed.comPork in the market. Retrieved on August 16, 2016 fromwww.dreamstime.comNative pig. Retireved on May 22, 2017 from http://icanteach.blogspot.com
Republic of the PhilippinesPhilippine Statistics AuthoritySolid Responsive World-class
REPUBLIC OF THE PHILIPPINESPRESIDENT RODRIGO ROA DUTERTEREPUBLIC OF THE PHILIPPINESPHILIPPINE STATISTICS AUTHORITYLISA GRACE S. BERSALES, Ph.D.UndersecretaryNational Statistician and Civil Registrar GeneralCopyright 2018 by Philippine Statistics AuthorityPSA CVEA Building, East Avenue, Diliman,Quezon City, Philippinesii
SWINE SITUATION REPORTFOREWORDThis Swine Situation Report presents the industry situation in terms of inventory byfarm type and age group, volume and value of production, supply and disposition,number of heads slaughtered in slaughterhouses, volume and value of pork imports,and monthly average farmgate prices.The Livestock and Poultry Statistics Division (LPSD) of the Philippine StatisticsAuthority (PSA) disseminates the Swine Situation Report annually, every March,covering the previous year (January to December) as the reference period. Thereport is intended to serve as a ready reference for PSA’s various clients andstakeholders in the agriculture sector.The PSA would appreciate comments and suggestions from our data users andreaders for further improvement of this report.LISA GRACE S. BERSALES Ph.D.UndersecretaryNational Statistician andCivil Registrar GeneralQuezon City, PhilippinesMarch 2019iii
SWINE SITUATION REPORTiv
SWINE SITUATION REPORTTABLE OF CONTENTSForewordTechnical NotesStandard Symbols, Unit of Measure, Initials and AcronymsHighlightsInventoryDistribution of Swine Inventory by RegionVolume of ProductionValue of ProductionSupply and 567891011Changes in Swine Inventory by Farm TypePhilippines: as of January 1, 2017-2019pChanges in Hog Production, Philippines: 2016-2018pChanges in Farmgate Price of Hogs Upgraded for SlaughterPhilippines: 2016-2018pThematic Map of Swine Inventory, Philippines: as of 1 January 2019pDistribution of Swine Inventory by Age GroupPhilippines: as of 1 January 2019pDistribution of Total Swine Inventory by RegionPhilippines: as of 1 January 2019pDistribution of Swine Inventory in Backyard Farms by RegionPhilippines: as of 1 January 2019pDistribution of Swine Inventory in Commercial Farms by RegionPhilippines: as of 1 January 2019pThematic Map of Hog Production Philippines: January–December 2018Average Farmgate Prices of Hogs Upgraded for Slaughter by MonthPhilippines: 2016-2018pAverage Retail Prices of Pork Lean Meat by MonthPhilippines: 2016-2018pv11122333466
SWINE SITUATION REPORTTABLE OF CONTENTS -- ConcludedTABLE123456789101112Swine Inventory by Farm Type and Age GroupPhilippines: as of January 1, 2017-2019pVolume of Hog Production by Quarter, Philippines: 2016-2018pVolume of Hog Production by Region, Philippines: 2016-2018pValue of Hog Production at Current and Constant Prices by QuarterPhilippines: 2016-2018pSupply and Disposition of Swine, Philippines: 2016-2018pVolume and Value of Pork Imports by Quarter, Philippines: 2016-2018pAverage Farmgate Prices of Hogs Upgraded for Slaughterby Month, Philippines: 2016-2018pAverage Retail Prices of Pork Lean Meat by MonthPhilippines: 2016-2018pSwine Inventory in Backyard and Commercial Farms by Quarter andRegion, Philippines: 2017-2019pVolume of Hog Production by Quarter and RegionPhilippines: 2016-2018pVolume of Hog Production by Province, Philippines: 2016-2018pNumber of Hogs Slaughtered in Slaughterhouses by Quarter and RegionPhilippines: 2017-2018pvi899101011121213151619
SWINE SITUATION REPORTTECHNICAL NOTESThe data in this report are collected by the Philippine Statistics Authority (PSA) throughthe two (2) major surveys, namely:1) Backyard Livestock and Poultry Survey (BLPS) which covers one (1) of the four(4) replicate samples of the Palay and Corn Production Survey (PCPS). Itconsists of 14,612 sample households in 1,079 sample barangays nationwide;and2) Commercial Livestock and Poultry Survey (CLPS) which covers1,241 independent farms as of January 2018. A swine farm is consideredcommercial when it has a farm capacity of at least 21 heads of adult swine or10 adults and 22 heads of young.Both surveys are conducted every quarter simultaneously in all provinces.Another activity that supplements the statistical requirements of the livestock andpoultry sub-sector is the Compilation of Data from Slaughterhouses and PoultryDressing Plants (CDSPDP). This covers around 1,272 Accredited (AAA and AA) andLocally Registered Meat Establishments (LRMEs) nationwide and is undertaken incoordination with the National Meat Inspection Service (NMIS).Concepts and DefinitionsBackyard Farm refers to any farm or household whether farming or non-farmingtending at least one head of animal and does not qualify as a commercial farm.Commercial Farm refers to any livestock farm which satisfied at least one of thefollowing conditions: Tending at least 21 heads of adult and zero head of young Tending at least 41 heads of young animals Tending at least 10 heads of adult and 22 heads of youngDeaths/Losses refer to the number of animals that died due to pests, diseases andcalamities.Farmgate Price refers to the price received by livestock raisers for their produce at thelocation of farm. Thus, marketing costs such as transport and other marketing cost (ifany) incurred in selling the produce are not included in the farmgate prices. Data aregenerated from the Farmgate Price Survey (FPS) conducted by Price Statistics Division(PSD) of PSA.Continuedvii
SWINE SITUATION REPORTTECHNICAL NOTES -- ConcludedValue at Constant Price refers to the valuation of transactions, wherein the influence ofprice change from base year to the current year has been removed.Value at Current Price refers to the value based on prices during the reference year;nominal year.Inventory refers to the actual number of domesticated animals present in the farm as ofa specific reference date.Imports refer to the number of live animals originating from foreign country i.e. livebreeders and Feeders and meat importation compiled by the Trade Statistics Division(TSD) of PSA from the copies of Import Entry and Internal Revenue Declarationcollected from the Bureau of Customs (BOC).Locally Registered Meat Establishment (LRME) are slaughterhouses, meatprocessing plants, meat cutting plants and cold storages that are allowed to operate bythe city/municipal government but are not accredited by the NMIS.Retail Price refers to the price at which retailers sell their goods or commodities toconsumers in the marketplace. It is expressed in peso per kilogram.Slaughterhouse (SH) are premises that are approved and registered by the NMIS andLGUs in which food animals are slaughtered for human consumption.Slaughtered in Slaughterhouses refers to the number of animals slaughtered inaccredited (AAA, AA, A) slaughterhouses including number of animals slaughtered inLRMEs.Supply and Disposition refers to a framework that explains the population dynamics ofanimals in the farm including born live, imports, deaths and losses, number of animalsslaughtered in the farm/household and sold live for slaughter which serves assupporting information or indicators to the volume of production estimates.Value of Production this refers to the value of the animal with reference to its farmgateprice. It is derived by multiplying the volume of production by its farmgate price.Volume of Production this refers to the volume of locally-raised animals disposed forslaughter which include animals shipped-out for slaughter. This is expressed inthousand metric tons, liveweight.viii
SWINE SITUATION REPORTStandard Symbols, Units of Measure, Initials, and Acronyms-prKgMMTQ1Q2Q3Q4SEM1SEM2PhPUS C.I.FNCRCARCALABARZONMIMAROPA RegionSOCCSKSARGENARMMData not availableNo inventory/production during the reference periodPreliminaryRevisedKilogramMillionMetric tonFirst Quarter (January – March)Second Quarter (April – June)Third Quarter (July – September)Fourth Quarter (October – December)First Semester (January – June)Second Semester (July – December)Philippine PesoUS dollarCost, Insurance and FreightNational Capital RegionCordillera Administrative RegionCavite, Laguna, Batangas, Rizal, QuezonOccidental Mindoro, Oriental Mindoro, Marinduque,Romblon, PalawanSouth Cotabato, Cotabato City, Sultan Kudarat,Sarangani, General Santos CityAutonomous Region in Muslim Mindanaoix
SWINE SITUATION REPORTx
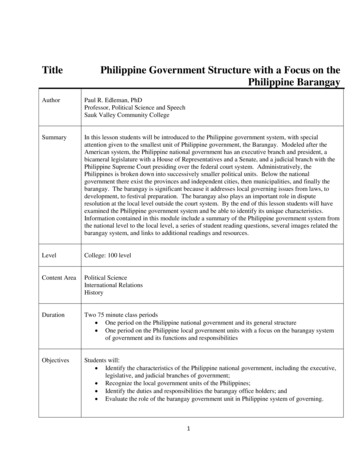
SWINE SITUATION REPORTHIGHLIGHTSFIGURE 1 Changes in Swine Inventory by Farm TypePhilippines: as of 1 January 2017-2019p4.735.004.00percent changeAs of 1 January 2019, the totalswine population in the country at12.71millionheadswas0.83 percent higher compared withits previous year’s inventory of12.60 million heads. Stocks inbackyard and commercial farmsregisteredanincreaseof0.93 percent and 0.66 percent,respectively. (Table lBackyard2018/2017Commercial2019/2018FIGURE 2 Changes in Hog ProductionPhilippines: 2016 -2018pIn 2018, the total volume of hogproduction at 2,319.76 thousandmetric tons, liveweight increased by2.42 percent compared with thepreviousyear’soutputof2,265.02 thousand metric tons,liveweight. (Table 2)3.002.42percent change2.502.001.491.501.000.500.002017/2016FIGURE 3 Changes in Farmgate Price of Hogs Upgradedfor Slaughter, Philippines: 2016-2018p12.7714.0012.00percent changeThe average farmgate price of hogsupgradedforslaughteratPhP 115.58 per kilogram, liveweightwas 8.29 percent higher comparedwith its previous year’s price ofPhP106.73perkilogram,liveweight. (Table - Preliminary12018/2017
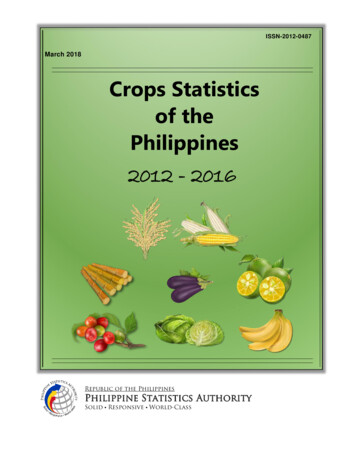
SWINE SITUATION REPORTINVENTORY As of 1 January 2019, the totalinventory of swine was estimated at12.71 million heads. Population ofswine in backyard farms wasregistered at 8.17 million heads, anincrease of 0.93 percent from theprevious year’s head count of8.09 million heads. Similarly, stocks incommercial farm at 4.54 million headsinched up by 0.66 percent from the2018 level of 4.51 million heads. The growth in swine inventory wasbrought by the increases in thenumber of sow, grower and otherages. These three age classificationshad a combined share of 66.85percent to the total swine inventory.(Table 1) Among the regions, Central Luzonrecorded the highest in terms ofinventory. This was followed byCALABARZON and Western Visayas.(Table 9)FIGURE 4 Thematic Map of Swine InventoryPhilippines: as of 1 January 2019 pFIGURE 5 Distribution of Swine Inventory by Age GroupPhilippines: as of 1 January 2019pOthers24%Growers29%Gilt5%Sow14%Fattener28%p- PreliminaryNote: Details may not add up to total due to rounding2
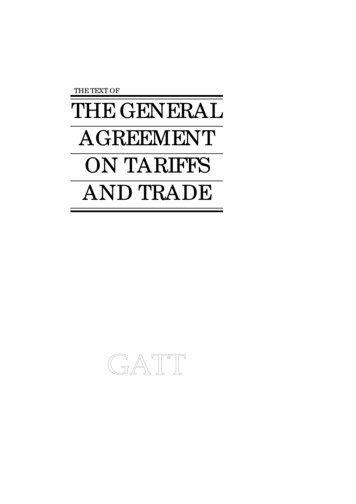
SWINE SITUATION REPORTDISTRIBUTION OF SWINE INVENTORY BY REGION In backyard farms, Western Visayas,Central Visayas and Bicol Region werethe top three regions in terms of inventory.Theseregionsaccountedfor33.58 percent of the country’s stocks inbackyard farms.FIGURE 6 Distribution of Total Swine Inventory by RegionPhilippines: as of January 1, 2019PregionAs of 1 January 2019, the top threeregions with highest inventory wereCentral Luzon, CALABARZON andWesternVisayas.Theseregionscontributed 38.35 percent to the country’stotal swine inventory.Central LuzonCALABARZONWestern VisayasCentral VisayasNorthern MindanaoBicol RegionDavao RegionSOCCSKSARGENIlocos RegionZamboanga PeninsulaMIMAROPA RegionCagayan ValleyEastern 6.434.944.564.423.602.221.851.800.38percentFIGURE 7 Distribution of Swine Inventory in Backyard Farmsby Region, Philippines: as of January 1, 2019Pregion Western VisayasCentral VisayasBicol RegionDavao RegionNorthern MindanaoZamboanga PeninsulaCentral LuzonIlocos RegionSOCCSKSARGENMIMAROPA RegionCagayan ValleyCALABARZONEastern 6.055.735.305.084.823.302.772.690.59percentIn commercial farms, Central Luzon,CALABARZON, and Northern Mindanaowere reported to have the highest swineinventories. The combined stocks fromthese regions accounted for 68.77 percentof the total inventory in commercial farms.FIGURE 8 Distribution of Swine Inventory in CommercialFarms by Region, Philippines: as of January 1, 2019Pregion pCentral LuzonCALABARZONNorthern MindanaoSOCCSKSARGENCentral VisayasDavao RegionBicol RegionWestern VisayasIlocos RegionMIMAROPA RegionCagayan ValleyCaragaEastern VisayasZamboanga 2.952.840.950.350.290.220.07percent- PreliminaryNote: Details may not add up to total due to rounding3
SWINE SITUATION REPORTVOLUME OF PRODUCTION The total volume of hog production in2018 was 2,319.76 thousand metrictons, liveweight. This was 2.42 percenthigher than the 2,265.02 thousandmetric tons, liveweight output in 2017. Increases in production were recordedin all quarters of 2018. The highestproduction was noted in October toDecember at 662.73 thousand metrictons, liveweight or an increase of2.01 percent from the 2017 productionlevel of 649.68 thousand metric tons,liveweight. (Table 2) Eleven regions recorded increases inproduction ranging from 0.27 percent(Western Visayas) to 6.12 percent(ARMM). ARMM reported the highestimprovement in production, from9,946 metric tons, liveweight in 2017 to10,555 metric tons, liveweight in 2018. Central Luzon was the highest producerof hog at 472,552 metric tons,liveweight. This was followed byCALABARZON and Northern Mindanaoat 381,590 metric tons, liveweight and196,623metrictons,liveweight,respectively. These three regionscontributed 45.30 percent to thecountry’s total hog production. (Table 3)FIGURE 9 Thematic Map of Hog ProductionPhilippines: January-December 2018p4- Preliminary
SWINE SITUATION REPORTVALUE OF PRODUCTION In 2018, the gross value of hog production at current prices was PhP 268,070.17 millionor 10.82 percent higher than the gross receipt of PhP 241,905.64 million in 2017.Likewise, gross value of production at constant prices increased by 2.42 percent fromthe previous year’s level of PhP 118,016.94 million. The value of production for current and constant prices posted increases in grossreceipts in all the periods of 2018. At current prices, the gross receipt was noted atPhP 63,446.75 million in January to March of 2018, an increase of 16.76 percent fromthe 2017 level of PhP 54,341.06 million. The highest value recorded at constant priceswas during the months of October to December. It improved by 2.01 percent, fromPhP 33,049.12 million in 2017 to PhP 33,713.18 million 2018. (Table 4)SUPPLY AND DISPOSITION In 2018, the total supply of live hogs was 41.44 million heads. It increased by1.54 percent compared with its previous year’s level of 40.82 million heads. An increaseof 5.91 percent was noted on the importation of live breeders from 2,149 heads in 2017to 2,276 heads in 2018. Likewise, total disposition of hogs at 28.73 million heads was 1.85 percent more thanthe previous year’s record of 28.21 million heads. The number of hogs slaughtered in2018 increased by 2.10 percent, while deaths/losses decreased by 4.55 percent.(Table 5)IMPORTS In 2018, the total volume of pork imports was recorded at 312,499 thousand metric tons.This was higher by 13.85 percent from the 274,487 thousand metric tons level in 2017.Volume of pork imports showed increases in all the quarters of 2018. The highestvolume of pork imports was noted in the second quarter at 87,061 metric tons. The value of pork imports grew by 14.99 percent, from US 390,438 CIF in 2017 toUS 448,980 CIF in 2018. Increases in value of pork imports were noted in all quartersof 2018. The highest value was reported during the second quarter at US 122,125 CIF.(Table 6)5
SWINE SITUATION REPORTPRICESFARMGATE PRICE The annual average farmgate price oflive hogs for slaughter in 2018 wasPhP 115.58 per kilogram, liveweight.This was 8.29 percent higher than the2017 price of PhP 106.73 perkilogram, liveweight. In 2018, thehighest price was recorded during themonth of June at PhP 119.55 perkilogram, liveweight, and the lowestwas in January at PhP 112.01 perkilogram, liveweight. (Table 7)FIGURE 10 Average Farmgate Prices of Hogs Upgraded forSlaughter by Month , Philippines: 2016-2018ppeso per kilogram, ONDMonth2016p20172018- PreliminaryRETAIL PRICEFIGURE 11 Average Retail Prices of Pork Lean Meat byMonth, Philippines: 2016-2018ppeso per kilogram, liveweight In 2018, the annual average retailprice of pork lean meat wasPhP 217.63 per kilogram, liveweight.It posted an increase of 7.11 percentcompared with the previous year’sprice of PhP 203.19 per kilogram,liveweight. The highest retail pricewas noted during the month of Augustat PhP 222.76 per kilogram,liveweight and the lowest was inJanuary at PhP 209.02 per kilogram,liveweight. (Table 0JFMAMJJASOMonth2016p- Preliminary620172018ND
STATISTICAL TABLES
SWINE SITUATION REPORTTABLE 1 Swine Inventory by Farm Type and Age GroupPhilippines: as of 1 January 2017-2019p(number of head)Percent .33)4.730.830.930.66Sow (Female, 6 months old and 92(2.63)(5.59)6.77Fattener (5 months old and 2,730(0.26)(2.71)4.74(1.27)(0.20)(3.31)Grower (2 months to 5 337.083.625.391.14Age Group/Farm TypeGilt (Female, less than 6 months old)BackyardCommercialp– PreliminaryInclude piglets, weanlings and boars1/8
SWINE SITUATION REPORTTABLE 2 Volume of Hog Production by Quarter, Philippines: 2016-2018p(thousand metric ton, liveweight)Quarter2016TOTALJanuary – MarchApril – JuneJuly – SeptemberOctober – December2018p20172,231.66 2,265.02 527.60541.03632.30649.68662.73Percent Change2017/2016 1p– PreliminaryNote: Details may not add up to total due to roundingTABLE 3 Volume of Hog Production by Region, Philippines: 2016-2018p(metric ton, liveweight)RegionPHILIPPINESCARIlocos RegionCagayan ValleyCentral LuzonCALABARZONMIMAROPA RegionBicol RegionWestern VisayasCentral VisayasEastern VisayasZamboanga PeninsulaNorthern MindanaoDavao 623154,784117,29140,68910,555p– PreliminaryNote: Details may not add up to total due to rounding9Percent 99(0.14)4.342.10(0.38)(3.55)6.12Percentshare 3.363.548.486.675.061.750.46
SWINE SITUATION REPORTTABLE 4 Value of Hog Production at Current and Constant Prices by QuarterPhilippines: 2016-2018p(million pesos)Percent Change2017/2016 2018/2017ITEM20162017r2018PCurrentJanuary – MarchApril – JuneJuly – SeptemberOctober - tJanuary – MarchApril – JuneJuly – SeptemberOctober - 3.50(1.32)0.912.752.422.392.812.552.01pr– Preliminary– RevisedTABLE 5 Supply and Disposition of Swine, Philippines: 2016-2018p(number of head)ITEMSTOTAL SUPPLYBeginning InventoryBorn Live1/Imports 2/DISPOSITIONSlaughteredDeaths/Losses 3/ENDING INVENTORYPercent Change2017/2016 12,709,2481.420.83p- Preliminary– Revised1/As of 1 January2/Live breeders recorded by Philippine Statistics Authority, Trade Statistics Division (PSA, TSD)3/Mortality due to pest and diseasesr10
SWINE SITUATION REPORTTABLE 6 Volume and Value of Pork Imports by Quarter, Philippines: 2016-2018p(Volume in metric ton and Value in CIF ‘000 US )Percent Change2017/2016 2018/201720162017r2018pVolumeJanuary – MarchApril – JuneJuly – SeptemberOctober – alueJanuary – MarchApril – JuneJuly – SeptemberOctober – 9.48ITEMp– Preliminary– RevisedCIF-Cost, Insurance and FreightNote: Details may not add up to total due to roundingSource: Trade Statistics Division, Philippine Statistics Authority (TSD, PSA)r11
SWINE SITUATION REPORTTABLE 7 Average Farmgate Prices of Hogs Upgraded for Slaughter by MonthPhilippines: 2016-2018p(peso per kilogram, liveweight)Percent Change201620172018p2017/20162018/2017Table 9. Hogs Slaughtered in Slaughterhousesby Region,by Quarter, Philippines, 2015-2016pAnnual Average94.64106.7312.778.29(number EMTABLE 8 Average Retail Prices of Pork Lean Meat by MonthPhilippines: 2016-2018p(peso per kilogram, liveweight)Percent Change2017/20162018/2017Table 9. Hogs Slaughtered in Slaughterhouses by Region,by Quarter,2015-2016pAnnual Average188.59 Philippines,203.19217.637.747.11(numberof 46ITEM201620172018pp- PreliminarySource: Price Statistics Division, Philippine Statistics Authority (PSD, PSA)12
SWINE SITUATION REPORTTABLE 9 Swine Inventory in Backyard and Commercial Farms by Quarterand by Region, Philippines: 2017-2019p(number of head)201720182019Table 7. Inventory of Swine in Backyard and Commercial Farms by Region,Region1 Jan1 Apr1 Jul1 Oct1 Jan1 Aprp1 Jul1 Oct1 JanPhilippines, by Quarter, 2015-2017################ ########(numberof head)TOTALPHILIPPINES################ ########12,427,790 12,514,004 12,547,245 13,013,912 12,604,441 12,753,923 12,780,069 13,127,670 12,709,248CARIlocos RegionCagayan ValleyCentral LuzonCALABARZONMIMAROPA RegionBicol RegionWestern VisayasCentral VisayasEastern VisayasZamboanga PeninsulaNorthern MindanaoDavao 15769,346226,77243,0727,857,7178,111,647 ,092,940 0248,556CARIlocos RegionCagayan ValleyCentral LuzonCALABARZONMIMAROPA RegionBicol RegionWestern VisayasCentral VisayasEastern VisayasZamboanga PeninsulaNorthern MindanaoDavao ,864Continued13
SWINE SITUATION REPORTTABLE 9 -- Concluded(number of head)Table 7. Inventory of Swine in2017Backyard and Commercial Farms2018by Region,2019pRegionPhilippines, by Quarter,2015-20171 Jan1 Apr1 Jul1 Oct1 Jan1 Apr1 Jul1 Oct1 Jan(number of head)COMMERCIAL4,217,4324,411,402 4,411,402 4,217,432 4,411,402 4,411,402 4,411,402 4CARIlocos RegionCagayan ValleyCentral LuzonCALABARZONMIMAROPA RegionBicol RegionWestern VisayasCentral VisayasEastern VisayasZamboanga PeninsulaNorthern MindanaoDavao ,64815,827-p- Preliminary14
SWINE SITUATION REPORTTABLE 10 Volume of Hog Production by Quarter and by RegionPhilippines: 2017-2018P(metric ton, Share ,6781,177,2802,265,015100.00CARIlocos RegionCagayan ValleyCentral LuzonCALABARZONMIMAROPA RegionBicol RegionWestern VisayasCentral VisayasEastern VisayasZamboanga PeninsulaNorthern MindanaoDavao .326.695.201.860.442018PercentShare 100.00CARIlocos RegionCagayan ValleyCentral LuzonCALABARZONMIMAROPA RegionBicol RegionWestern VisayasCentral VisayasEastern VisayasZamboanga PeninsulaNorthern MindanaoDavao RegionSOCCSKSARGENCaragaARMM5,81722,06117,63
SWINE SITUATION REPORT vi TABLE 1 Swine Inventory by Farm Type and Age Group 8 Philippines: as of January 1, 2017-2019p 2 Volume of Hog Production by Quarter, Philippines: 2016-2018p 9 3 Volume of Hog Production by Region, Philippines: 2016-2018p 9 4 Value of Hog Production at Current and Constant Prices by Quarter 10