Transcription
1286IEEE TRANSACTIONS ON VISUALIZATION AND COMPUTER GRAPHICS, VOL. 13, NO. 6, NOVEMBER/DECEMBER 2007Visualizing Changes of Hierarchical Data using TreemapsYing Tu and Han-Wei ShenAbstract—While the treemap is a popular method for visualizing hierarchical data, it is often difficult for users to track layout andattribute changes when the data evolve over time. When viewing the treemaps side by side or back and forth, there exist severalproblems that can prevent viewers from performing effective comparisons. Those problems include abrupt layout changes, a lackof prominent visual patterns to represent layouts, and a lack of direct contrast to highlight differences. In this paper, we presentstrategies to visualize changes of hierarchical data using treemaps. A new treemap layout algorithm is presented to reduce abruptlayout changes and produce consistent visual patterns. Techniques are proposed to effectively visualize the difference and contrastbetween two treemap snapshots in terms of the map items’ colors, sizes, and positions. Experimental data show that our algorithmcan achieve a good balance in maintaining a treemap’s stability, continuity, readability, and average aspect ratio. A software tool iscreated to compare treemaps and generate the visualizations. User studies show that the users can better understand the changesin the hierarchy and layout, and more quickly notice the color and size differences using our method.Index Terms—Treemap, tree comparison, visualize changes, treemap layout algorithm.1I NTRODUCTIONThe treemap is a popular method for visualizing hierarchical data. Bydividing the display area into rectangles recursively according to thehierarchy structure and a user-selected data attribute, treemaps can effectively display the overall hierarchy as well as the detailed attributevalues from individual data entries. Since the treemap was first introduced [5] in 1991, data from many applications have been visualizedwith treemaps. Examples include file systems [5], sports [10], stockdata [12], and social cyberspace data [7].While the treemap has already been accepted as a powerful methodfor visualizing hierarchical data, there still exist additional visualization requirements yet to be addressed by treemaps. One of the needs isfor users to visualize the difference when the data undergo changes. Asa data set evolves over time, for example, the changes can range frommajor structure differences that affect the relationships among data entries, to subtle attribute value changes in individual data entries. Howeasily viewers can capture the changes in the data often determineshow effective the visualization is to answer specific questions. Taking file systems as an example, it is preferable for the treemaps toclearly reflect the overall changes in the directory structure as well asthe changes of individual file attributes.Effective visualization of changes in hierarchical data usingtreemaps is still an open challenge. The primary goal of our workfor visualizing changes using treemaps is to compare treemaps whichrepresent snapshots of data in different time points. Currently, thecommon approaches to comparing treemaps are to view them side byside or switch back and forth. But those approaches suffer from severalcommon problems that can prevent viewers from performing effectivedata analysis: Abrupt layout changes: if small local changes in the data causerelatively large or global changes in the treemap layout, viewersare more likely to be overwhelmed by the differences and cannoteasily identify the changes in the data. Lack of prominent visual patterns to represent the layout: without a prominent visual pattern, it is difficult for viewers to scanthe map items in order and thus harder to track changes. Ying Tu is with the Computer Science and Engineering Department at theOhio State University, E-mail: tu@cse.ohio-state.edu. Han-Wei Shen is with the Computer Science and Engineering Departmentat the Ohio State University, E-mail: hwshen@cse.ohio-state.edu.Manuscript received 31 March 2007; accepted 1 August 2007; posted online27 October 2007. Published 14 September 2007.For information on obtaining reprints of this article, please send e-mail to:tvcg@computer.org.1077-2626/07/ 25.00 2007 IEEE Lack of direct contrast to highlight differences: if the attributesof the corresponding data entries are displayed separately in different places with different contexts, viewers have to do indirectvisual comparison, which creates difficulties in observing subtledifferences.In this paper, we take on this challenge and present strategies tovisualize changes in hierarchical data using treemaps. To achieveour goal, we first propose a new treemap layout, the spiral layout,to reduce abrupt layout changes and generate a consistent visual pattern. Based on this representation, we propose the method of contrasttreemaps to effectively compare two treemap snapshots and highlightthe changes in one view.The main idea of the spiral treemap is to use ‘spirals’ as the underlying visual pattern to guide the placement of treemap items. In ourspiral layout algorithm, items with the same parent in the tree are organized along a spiral. By doing so, any two adjacent data entries inthe hierarchy will remain adjacent in the layout, and the sibling dataentries together form a consistent spiral pattern. The use of spiralsreduces abrupt layout changes, so that neither the overall pattern northe specific order of data entries will change drastically as the datacontinue evolving. In addition, map items that belong to different subtrees can be easily distinguished as they are placed in different spirals.Moreover, our spiral layout algorithm provides a reasonably good aspect ratio, which is necessary for us to display the contrast betweendata attributes in two treemaps. We evaluated the spiral treemap layout using the metrics proposed by Shneiderman and Wattenberg [2].We also proposed two additional metrics to better measure the layoutwith respect to dynamic data. Experimental results show that the spiraltreemap is spatially continuous, relatively stable and readable, and hasadequately low aspect ratios.Besides the spiral treemap layout, we propose a contrast treemapmethod for comparing treemaps. The main idea of the contrasttreemap is to allow direct comparisons of the attributes in the corresponding data entries at two time points. A contrast treemap is atreemap that encodes the information from two different snapshots ofdynamically evolving data. Based on tree mapping techniques, correspondences between data entries can be formed automatically, andthen a contrast treemap is built upon the union of both trees. By mapping the corresponding items from two snapshots of data to a singleitem in the contrast treemap, we can use the item area to display theattributes from both snapshots and emphasize the difference in multiple ways. Effectively, the contrast treemap eliminates the need forusers to look back and forth between two separate items when comparing their data values. As a result, differences become more explicitand easier to capture by viewers. A user study with statistical data ofplayers in the National Basketball Association (NBA) shows that ourPublished by the IEEE Computer Society
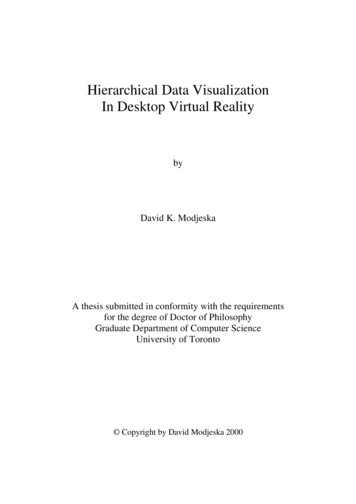
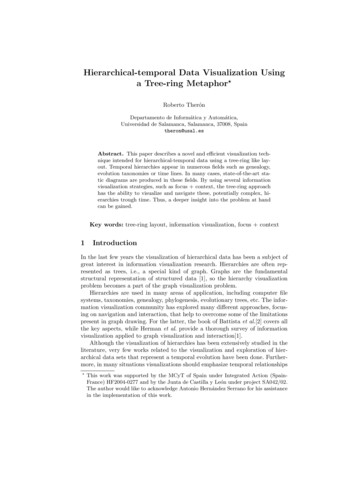
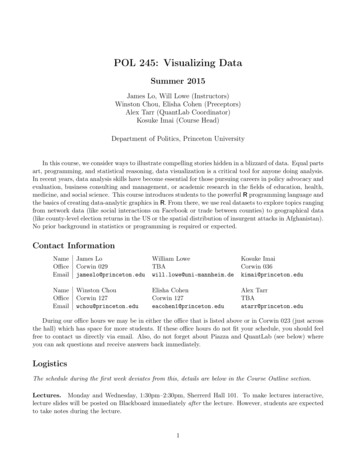
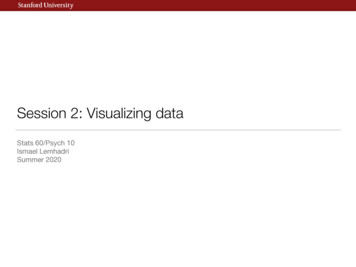
IEEE TRANSACTIONS ON VISUALIZATION AND COMPUTER GRAPHICS, VOL. 13, NO. 6, NOVEMBER/DECEMBER 2007contrast treemap can better assist viewers in capturing and analyzingdifferences.The rest of this paper is organized as follows: In Section 2, webriefly review the related work on treemap layouts and visualizationtechniques for tree comparison. In Section 3, we introduce the spiraltreemap layout and compare it with other popular treemap algorithms.In Section 4, we present the contrast treemap and the techniques usedfor visualizing changes. Our user study is described in Section 5. Finally, we summarize our work in Section 6.2 R ELATED W ORKTree Comparisons: Our visualization techniques are designed tocompare hierarchical data with treemaps. Using visualization to assist tree comparisons has been studied before. For example, Munzneret al. [8] compare phylogenetic trees. The focus of their comparisonis on the tree structures. In this paper, we mainly focus on attributedtrees, trees whose leaf nodes are associated with attributes. Our visualization not only highlights the structure differences of two trees, butalso emphasizes the attribute and treemap layout changes.Two previous works have compared trees with treemaps. One isthe Univ. of Maryland’s Treemap 4.1 [6]. This software includes aslider control feature for multiple time series, a useful way to viewtreemaps at different time steps. This feature allows users to detectwhether there are any changes to the treemaps, but it is not easy forthem to analyze what exactly the changes are. Our visualizations areparticularly designed for assisting change analysis.Another work is the market map application [12], which uses atreemap to show the rate of performance changes to popularly heldstocks. The methods presented in this application are different fromours in two ways. First, we introduce shadings to indicate rates, an alteration whose advantage will be explained in Section 4.2.3. Second,when displaying the change rates, we show hierarchical differences,a type of differences which is not handled in the market map. In addition, our visualization is a general solution which can help usersanalyze a variety of dynamic data types.Slice and diceS uarifiedivot by splitStripSpiralFig. 1. Examples of Layouts.Treemap layout algorithms: A treemap layout algorithm is asubdivision of rectangular areas representing internal tree nodes intosmaller rectangles representing the children of the nodes. When thetreemap was introduced [5], the slice-and-dice algorithm was the onlylayout. It uses parallel lines to divide the rectangle. Later, moretreemap layout algorithms were proposed. The most well known algorithms are listed below with comments about their characteristics [9].An example of each layout is shown in Figure 1. The intensity of therectangles represents the order of the nodes in the tree. Slice-and-dice: Ordered, poor aspect ratios, best stability Squarified: Unordered, best aspect ratios, medium stability Pivot (or called “ordered”): Partially ordered, medium aspect ratios, medium stability Strip: Ordered, medium aspect ratios, medium stabilityRecently, Viegen et al. [11] proposed variations to the squarifiedtreemap. In the standard squarified algorithm the nodes are sortedby decreasing node size, and the strips are placed along the longestedge, either the left or bottom edges, of the rectangle. In the extendedalgorithm, the nodes can be sorted by increasing node size and thestrips can be placed along the right and top edges. The variationsproduce different looks in terms of where the smallest and largest mapitems are placed.Our spiral treemap layout generates a continuous and consistent visual pattern, an advantage not possessed by many layout algorithmsexcept the slice-and-dice. However, since the slice-and-dice can have1287items of very poor aspect ratios, it is often not used. Our spiral layout has one thing in common with the extended squarified treemap:the strips can be placed along any edge in the rectangle. The biggestdifferences between these two layouts are the spatial continuity andthe primary design goal. In a later section, we show that the spiraltreemap performs well according to the metrics developed by Bederson, Shneiderman, and Wattenberg [2]. We also add several newmetrics to analyze the layouts from additional aspects.Content of treemap items: Typically treemap items are in a uniform color, which represents a value, but the information representedby an item can actually be more expressive. For example in [1], eachtreemap item is occupied by an image, so the treemap can be usedas an image browser. In this paper, we encode additional informationwhile displaying the treemap items to show the contrast between twotree nodes’ data.Furthermore, in order to highlight the spiral visual pattern, we useshading on the spiral treemap. Shading on treemaps was first introduced by van Wijk and Wetering [14]. Their goal of shading was toprovide insight into the hierarchical structure, in particular the parentchild relationship, but the neighboring relationships were not particularly emphasized. The original shading algorithm in the cushiontreemaps cannot completely satisfy our need, thus we modify theiralgorithm to obtain the desired effects.3 S PIRAL T REEMAPIn this section, we describe how the spiral treemap was designed to bea continuous layout with a clear and consistent visual pattern. We alsopresent an algorithm that creates the spiral layout with a good averageaspect ratio to ensure the map items’ visibility, with an evaluation ofthe layout at the end.3.1 Continuous LayoutsThe design goal of our treemap layout is to avoid abrupt layoutchanges for dynamic data and also produce a clear and consistent visual pattern, so that viewers can scan the items in order according tothe pattern, effectively search for specific items, and keep track of thechanges in the data. Among the existing treemap algorithms, the onethat can most nearly meet the requirement of our goal while maintaining a good aspect ratio for the treemap items is the strip treemap. Striptreemaps place treemap items in a set of strips, which form a consistent visual pattern. While the algorithm can produce relatively stablelayouts, it can occasionally show abrupt layout changes along with thechanges of the attribute values. For example in Figure 2, a map itemmay shift from the end of one row to the beginning of the next row orvice versa. Essentially, the abrupt layout change is caused by spatialdiscontinuity.Fig. 2. An example of the strip treemap’s spatial discontinuity. Becauseof size attribute changes, the item in green shifts from the end of thefirst row to the beginning of the second row. Its neighboring relationshipwith the blue item breaks, and a new neighboring relationship with theorange item is established.Spatial discontinuity is the opposite concept of spatial continuity.By spatial continuity, we mean that for any two nodes in the tree thatare next to each other in a given order, their corresponding map itemsare also neighbors in the treemap. Here we introduce the conceptsof adjacency arrows and flow contours to analyze the layouts’ spatialcontinuity.Adjacency arrows are the building blocks of a flow contour. Anadjacency arrow is a straight arrow from the center of a map item MAto the center of another map item MB if the node of MA , A, in the tree isright before the node of MB , B. Since A and B are adjacent tree nodes,the arrow indicates the adjacency information.A flow contour of an internal node is formed if all adjacency arrowsamong the node’s children are drawn on the treemap. The flow contour
TU AND SHEN: VISUALIZING CHANGES OF HIERARCHICAL DATA USING TREEMAPS1288starts from the first child’s map item, traverses through every child,and ends at the last child’s map item. Figure 3 shows an example ofa flow contour. We can deduce the following property related to flowcontours and spatial continuity: The flow contour of an internal nodewill go through the map item of every child of the node once and onlyonce, and be free of intersections if and only if the treemap is spatiallycontinuous, i.e. it holds spatial continuity. This property can be used todecide whether a treemap is spatially continuous. In addition, when atreemap layout algorithm guarantees to generate continuous treemaps,we say the layout of this algorithm is continuous.tain nested spirals, where the children of each internal tree node forma spiral inside the rectangular space assigned to the node. Since ouralgorithm runs recursively for each internal node of the tree, in the following, we describe our spiral layout algorithm only for a node and itschildren.Given a list of map items, the key to form a spiral and occupy theentire given rectangular area is to subdivide the item list into segments,as shown in Figure 5, and lay out those segments in an iterative northeast-south-west spiral pattern. 1st Seg.(a)(b)(c)Fig. 3. Tree nodes’ order and the flow contour. (a) shows the orderamong the tree nodes. (b) shows the adjacency arrows. The big pinkflow in (c) is the flow contour.3.2 Layouts with a Consistent Visual PatternWhen the flow contours of every treemap generated by a particularlayout algorithm has a similar appearance, we say this layout has aconsistent visual pattern. A consistent visual pattern can help viewerseffectively scan the tree nodes in order, and hence makes it easier tocreate a visual mapping between two treemaps. An ideal visual patternshould also clearly reflect the hierarchies of the data, i.e., the parentchild relationship is clearly reflected in the patterns.We use flow contours to aid the design of the treemap layout. Theflow contour is used as a topological abstract of the treemap layout.Using flow contours, the problem of creating a visual pattern of atreemap layout can be reduced to the problem of shaping the flow contours. If the resulting flow contour is of a visually consistent pattern,so will be the layout. In fact, the concept of flow contours is similarto that of space-filling curves by Wattenberg [13]; the major difference is that we want to use rectangular-shaped map items (internalor leaves) in the resulting treemap since rectangles make it easier todetect subtrees or branches. It is also easier to display additional content/visualizations inside a rectangular area.To find a flow contour pattern for our layout, we intend to use something that we are familiar with. We propose to use spirals as the underlying flow contour pattern to guide the placement of treemap items.The flow contours extracted from a spiral layout are visually consistent even when the sizes of individual map items change. Take thespirals, (a) and (b) in Figure 4 for example: (a) is smaller and the distance between the arcs shrinks as the spiral swirls in; (b) is larger andhas a constant distance between adjacent parallel arcs. Although theyare different, the visual pattern, which is a clockwise spiral shape, isclearly identical. Since we prefer rectangular-shaped map items, andwant to make the best use of the area in the bounding rectangle, weadapt the classic spirals to be rectangular spirals, such as (c) in Figure4.(a)(b)2nd Seg. 3rd Seg. 4th Seg. 5th Seg.(c)(d)Fig. 4. Spiral Examples and an S-Shape Example.Of course, a spiral is not the only flow shape that possesses a consistent visual pattern. The s-shape flow is an alternative, such as (d)in Figure 4. An s-shape flow flips orientation between east and west.The angle of each direction change is 180 degree. The spiral flowsproduced by our algorithm will only make 90 degree turns at a time,which are easier to follow, comparatively.3.3 Creating Spiral LayoutLike every other treemap layout algorithm, our spiral treemap is constructed in a recursive manner. In essence, the resulting treemaps con- (a)(b)(c)(d)(e)Fig. 5. Rectangular Spirals: In (a), the 1st segment fits in the northside of the given rectangle; in (b), the 2nd segment fits in the east sideof the remainder of the given rectangle; in (c) and (d), the 3rd and 4thsegment fit in the south and west; in (e), the 5th segment goes back tothe north and is placed under the first 1st segment. When a segmentfits into some place, its area does not change, but the width and heightare adjusted. The alignment of items in a segment is decided accordingto the orientation of a segment.A spiral layout is naturally continuous and has a consistent visualpattern, but the treemap items do not necessarily have good aspect ratios. Clearly, given some criteria, the optimal segment subdivisions toproduce the lowest aspect ratio can be found by a brute-force methodthat exhausts all the combinations. However, it would be prohibitivelyexpen
how effective the visualization is to answer speci c questions. Tak-ing le systems as an example, it is preferable for the treemaps to clearly re ect the overall changes in the directory structure as well as the changes of individual le attributes. Effective visualization of changes in hie