Transcription
User Guide2014 Interim Feedback Dashboard UserGuideCenters for Medicare & Medicaid Services, 7500 Security Boulevard, Baltimore, MD 21244V1.0 2/26/2014Page 1 of 24
DisclaimerThis information was current at the time it was published or uploaded onto the web. Medicare policy changes frequentlylinks to the source documents have been provided within the document for your reference.This document was prepared as a tool to assist eligible professionals and is not intended to grant rights or imposeobligations. Although every reasonable effort has been made to assure the accuracy of the information within thesepages, the ultimate responsibility for the correct submission of claims and response to any remittance advice lies with theprovider of services. The Centers for Medicare & Medicaid Services (CMS) employees, agents, and staff make norepresentation, warranty, or guarantee that this compilation of Medicare information is error-free and will bear noresponsibility or liability for the results or consequences of the use of this guide. This publication is a general summarythat explains certain aspects of the Medicare Program, but is not a legal document. The official Medicare Programprovisions are contained in the relevant laws, regulations, and rulings. Current Procedural Terminology (CPT ) only copyright 2013 American Medical Association (AMA). All rights reserved.CPT is a registered trademark of the American Medical Association. Applicable FARS\DFARS Restrictions Apply toGovernment Use. Fee schedules, relative value units, conversion factors and/or related components are not assigned bythe AMA, are not part of CPT, and the AMA is not recommending their use. The AMA does not directly or indirectlypractice medicine or dispense medical services. The AMA assumes no liability for data contained or not contained herein.Centers for Medicare & Medicaid Services, 7500 Security Boulevard, Baltimore, MD 21244V1.0 2/26/2014Page 2 of 24
Table of ContentsUser Guide . 12014 Interim Feedback Dashboard User Guide . 1User Guide. 42014 Interim Feedback Dashboard . 4Purpose . 4PQRS Program Overview . 4Dashboard Overview. 5Dashboard Data – Quarterly Claims Processing . 5Dashboard Content and Appearance . 5Example 1.1: Interim Reporting Summary for the Taxpayer Identification Number (Tax ID or TIN) . 7Example 2.1: Table 2a: Interim Reporting Summary for NPI . 9Example 2.2: Table 2b: Interim Reporting Individual Measure Detail for the NPI . 10Accessing the Dashboard . 11System Requirements for the Dashboard . 11Hardware . 11Software . 11Internet Connection . 11Step-by-Step Dashboard Instruction . 12STEP 1: Portal Sign-In (eligible professionals or authorized users must have IACS sign-in) . 12STEP 2: Accessing the Dashboard . 14STEP 3: “Interim 2014 Physician Quality Reporting System Dashboard” Page. 15STEP 4: Dashboard Request Report Page . 15STEP 5: Request Report Confirmation . 18STEP 6: Viewing the Dashboard Data . 18STEP 7: Exiting the Dashboard . 19Key Facts about the Dashboard . 20Help/Troubleshooting . 20Copyright, Trademark, and Code-Set Maintenance Information . 21Appendix A: Dashboard Definitions . 22Centers for Medicare & Medicaid Services, 7500 Security Boulevard, Baltimore, MD 21244V1.0 2/26/2014Page 3 of 24
User Guide2014 Interim Feedback DashboardPurposeThe 2014 Interim Feedback Dashboard User Guide is designed to assist eligible professionals, and their authorized users,with accessing and interpreting the 2014 interim Dashboard data. The Dashboard allows organizations and eligibleprofessionals (EPs) to log-in to a web-based tool and access their 2014 Physician Quality Reporting System (PQRS) dataon a quarterly basis in order to monitor the status of claims-based individual measures. Additional information about the2014 PQRS requirements is available on the Centers for Medicare & Medicaid Services (CMS) websiteat tient-Assessment-Instruments/PQRS.Note: The Dashboard does not provide the final data analysis for full-year reporting, or indicate 2014 PQRS incentiveeligibility or subjectivity to the 2016 PQRS payment adjustment or the value-based payment modifier to be implemented in2016. The Dashboard will only provide claims-based data for 2014 interim feedback. Data submitted via registryreporting, qualified clinical data registry (QCDR), Group Practice Reporting Option (GPRO) Web Interface, Centers forMedicare & Medicaid Innovation (CMMI, includes Pioneer Accountable Care Organizations [ACO] participants), MedicareShared Savings Program ACOs, or qualified Electronic Health Records (EHR) systems will not be included for purposesof the 2014 Dashboard data feedback. Data submitted for 2014 PQRS reporting via methods other than claims will beavailable for review in the fall of 2015 through the final PQRS feedback report.PQRS Program OverviewThe 2006 Tax Relief and Health Care Act (TRHCA) authorized a physician quality reporting system, including an incentivepayment, for EPs who satisfactorily reported data on quality measures for Medicare Part B Physician Fee Schedule (PFS)covered professional services furnished to Medicare Fee-for-Service (FFS) beneficiaries during the second half of 2007.CMS named this program the Physician Quality Reporting Initiative (PQRI), which was renamed Physician QualityReporting System or PQRS in 2011.PQRS was further modified as a result of The Medicare, Medicaid, and SCHIP Extension Act (MMSEA) and the MedicareImprovements for Patients and Providers Act of 2008 (MIPPA). MMSEA authorized CMS to establish two alternativereporting periods; the reporting of measures groups, and submission of data on PQRS quality measures through clinicaldata registries. The Affordable Care Act authorized payment adjustments beginning in 2015. For each program year, CMSimplements PQRS through an annual rulemaking process published in the Federal Register. The program has expandedthe number of measures and reporting options over time to facilitate quality reporting by a broad array of eligibleprofessionals.PQRS for the 2014 calendar year continues as a pay-for-reporting program that includes claims-, registry-, qualifiedclinical data registry-, electronic health record (EHR)-, CMS-certified survey vendor, and Group Practice Reporting Option(GPRO) Web Interface-based reporting of data on 284 total quality measures, 25 measures groups, 22 GPRO WebInterface measures (including subcomponents of composite measures), and 12 summary survey modules for CG CAHPS.The two reporting periods for this program year include: January 1, 2014-December 31, 2014, and July 1, 2014-December31, 2014 (for registry reporting of measures group[s] only). There are 13 options for satisfactorily reporting qualitymeasures data for 2014 PQRS that differ based on the reporting period, the reporting option (individual measures ormeasures group[s]), and the selected data collection method (claims, participating registry, qualified clinical data registry,qualified/participating EHR, CMS-certified survey vendor, or GPRO Web Interface). In 2016, the program also applies apayment adjustment to EPs who do not satisfactorily report data on quality measures for covered professional servicesduring the 2014 program year.For more information on the 2014 PQRS, please visit the CMS website at ient-Assessment-Instruments/PQRS.Centers for Medicare & Medicaid Services, 7500 Security Boulevard, Baltimore, MD 21244V1.0 2/26/2014Page 4 of 24
Dashboard OverviewThe Affordable Care Act of 2010 called for “timely feedback to eligible professionals on the performance of the eligibleprofessional with respect to satisfactorily submitting data on quality measures.” As timely feedback is already provided,CMS indicated in the 2012-2014 PFS final rule the introduction of the Dashboard as an additional tool for EPs to reviewtheir interim performance in PQRS. The Dashboard allows organizations and EPs to log-in and access their interim 2014PQRS reported data on a quarterly basis in order to monitor the status of claims-based individual measures reporting. TheDashboard should not be used to determine final data analysis for full-year program reporting, or final determination of2014 PQRS incentive eligibility.The Dashboard is available to each TIN with at least one EP who submits one or more denominator-eligible Medicare PartB PFS claims. The Dashboard will display the most current data available on a cumulative quarterly basis for claims withdates of service during the following interim report periods, and processed into the National Claims History (NCH) by thegiven deadlines as follows:Dashboard Data – Quarterly Claims ProcessingDashboard Data Quartersst1 Quarter (3-months)nd2 Quarter (6-months cumulative)rd3 Quarter (9-months cumulative)th4 Quarter (12-months cumulative)Claims Dates of ServiceJanuary 1-March 31, 2014January 1-June 30, 2014January 1-September 30, 2014January 1-December 31, 2014Processed into NCHDeadlineApril 25, 2014July 25, 2014November 28, 2014February 27, 2015All Medicare Part B claims submitted for services furnished from January 1-December 31, 2014 and processed throughFebruary 27, 2015 will be analyzed to determine the EP’s interim participation in 2014 PQRS. The Dashboard willanalyze data for those eligible professionals who reported individual measures’ quality-data codes (QDCs) to CMS viaclaims. Participation in PQRS is analyzed at the individual NPI-level within a Tax ID (TIN/NPI). Data provided through theDashboard is separate from the final PQRS feedback reports that will be released in the fall of 2015.Dashboard Content and AppearanceDashboard data can be viewed as a TIN summary or as individual NPI detail. The TIN-level data (Table 1) provides asummary of claims submission data from all individual/rendering NPIs under the organizational TIN. NPI-level data (Table2) provides detail of claims submission data from individual/rendering NPIs. Both TIN-and NPI-level data providecumulative interim analysis for 2014 PQRS individual measures and on a quarterly basis throughout the program year.As the Dashboard does not indicate 2014 PQRS incentive eligibility, claims-based Measure-Applicability Validation (MAV)will not be shown for those EPs who reported less than nine individual measures across three National Quality Strategy(NQS) domains via claims or nine individual measures across less than three NQS domains. Eligible professionalsreporting less than nine individual measures and/or less than three NQS domains will need to refer to the informationprovided on the CMS PQRS website to ensure they are meeting the MAV and required performance rate criteria forsuccessful reporting. Measures with 0% performance rates for all eligible patients (which will not count toward incentiveeligibility) will be included in the Dashboard data.Following are examples and additional information about the TIN- and NPI-level Dashboard data and appearance.Centers for Medicare & Medicaid Services, 7500 Security Boulevard, Baltimore, MD 21244V1.0 2/26/2014Page 5 of 24
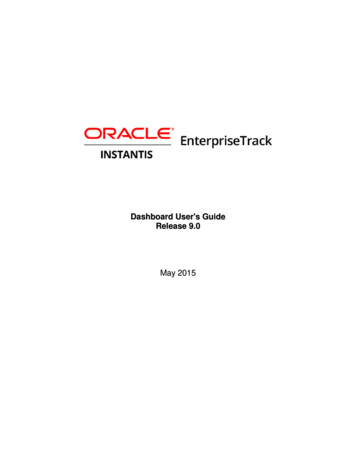
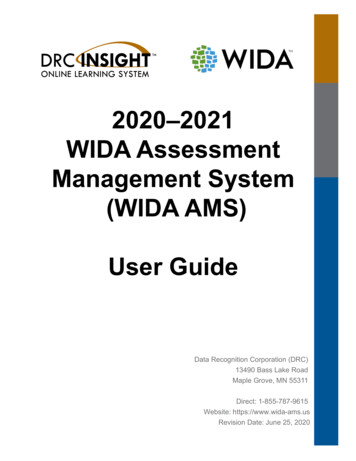
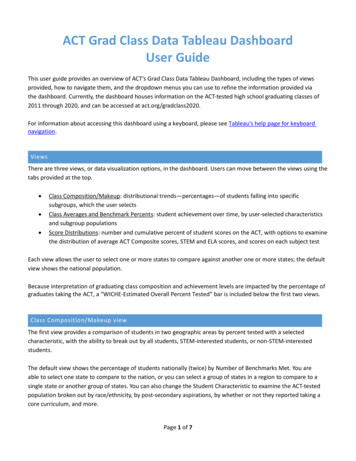
Table 1: Interim Reporting Summary for the Taxpayer Identification Number (Tax ID or TIN)TIN-level analysis of claims submission from all individual/rendering NPIs under the organizational TIN will be available toauthorized Individuals Authorized Access to the CMS Computer Services (IACS) account users. TIN-level data will beprovided in Table 1: Interim Reporting Summary for the Taxpayer Identification Number (Tax ID or TIN), and will analyzeeach individual NPI who submitted at least one QDC on a Medicare Part B PFS claim during the applicable 2014 PQRSinterim report period (see Example 1.1). The Dashboard will provide the following data: Total # Measures Reported: The total number of different individual measures reported for TIN/NPI (identified bymeasure-specific QDCs received) regardless of accuracy of reporting. The provider will see how many individualmeasures were accurately reported in the next field titled “Total # Measures Accurately Reported.”Total # Measures Accurately Reported: The total number of different individual measures reported for TIN/NPIbased upon valid QDC submissions. Valid reporting is defined by numerator and denominator requirements asoutlined in the measure specification. As previously mentioned, incentive eligibility is based upon the final analysisof 12-months of data, and the interim Dashboard data is not the final indicator of incentive eligibility for thereporting period.Total # Domains Covered by Measures Accurately Reported: The number of domains in which measureswere reported with a valid QDC. This does not necessarily indicate that satisfactory reporting criteria have beenmet.For definition of terms related to Dashboard TIN-level data see Appendix A. For additional content detail, please refer tothe footnotes of each table.Note: The Dashboard may contain a partial or "masked" Social Security Number/Social Security Account Number(SSN/SSAN) as part of the TIN field. Care should be taken in the handling and disposition of Dashboard data to protectthe privacy of the individual practitioner with which the SSN is potentially associated. Please ensure that Dashboard datais handled appropriately and disposed of properly to avoid a potential Personally Identifiable Information (PII) exposure orIdentity Theft risk.The following screenshot is provided for example only and is subject to change. Minor changes in languageand/or format should be expected.Centers for Medicare & Medicaid Services, 7500 Security Boulevard, Baltimore, MD 21244V1.0 2/26/2014Page 6 of 24
Example 1.1: Interim Reporting Summary for the Taxpayer Identification Number (Tax ID or TIN)Figure 1.1 Screenshot of Table 1: Interim Reporting Summary for the Taxpayer Identification Number (Tax ID)Centers for Medicare & Medicaid Services, 7500 Security Boulevard, Baltimore, MD 21244V1.0 2/26/2014Page 7 of 24
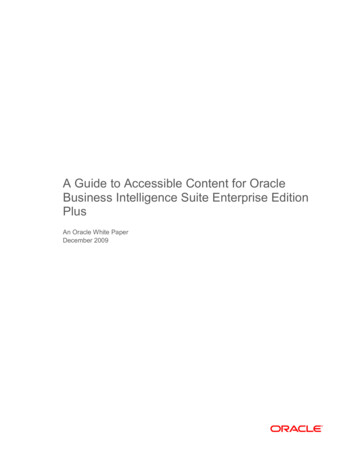
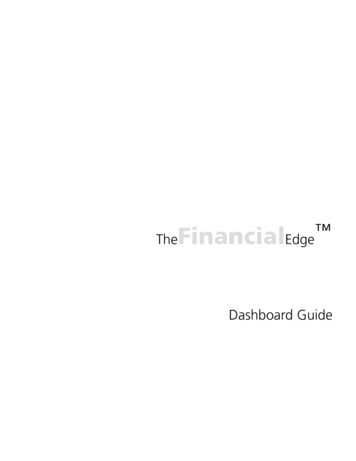
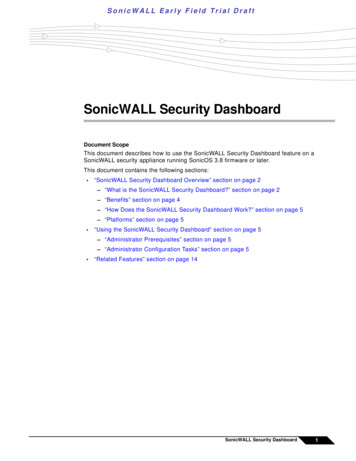
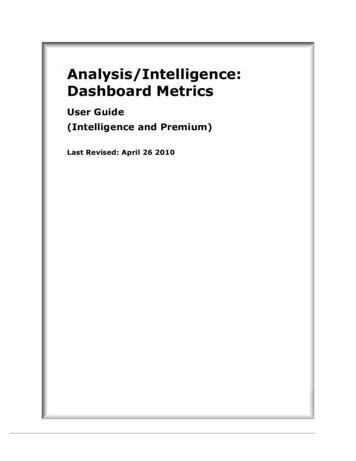
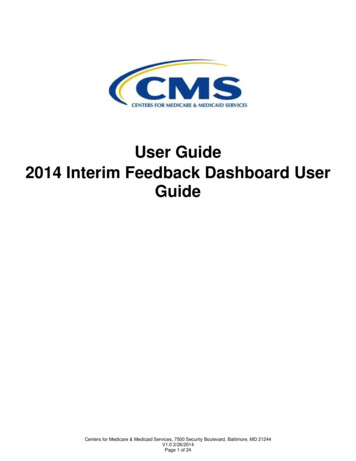
Table 2: Interim Reporting for NPINPI-level data reports can be requested for individual EPs who submitted at least one denominator-eligible Medicare PartB PFS claim with a date of service during the interim report period. The Dashboard will allow eligible professionals, andtheir authorized users, to view data for individual measures reported. The following NPI-level reports will be availablethrough the Dashboard depending on the NPIs reporting:Table 2a: Interim Reporting Summary for the NPI (for individual measures reporting)Table 2b: Interim Individual Measure Detail for the NPI (for individual measures reporting)NPI-level Tables 2(a-b) will provide the following data:Table 2a: Interim Reporting Summary for the NPI (see Example 2.1): Total # Measures Reported: The total number of different individual measures reported for TIN/NPI(identified by measure-specific QDCs received) regardless of accuracy of reporting. The provider will see howmany individual measures were accurately reported in the next field titled “Total # Measures AccuratelyReported.” Total # Measures Accurately Reported: The total number of different individual measures reported forTIN/NPI based upon valid QDC submissions. Valid reporting is defined by numerator and denominatorrequirements as outlined in the measure specification. As previously mentioned, incentive eligibility is basedupon the final analysis of 12 months of data, and the interim Dashboard data is not the final indicator ofincentive eligibility for the reporting period. Total # Domains Covered by Measures Accurately Reported: The number of domains in which measureswere reported with a valid QDC. This does not necessarily indicate that satisfactory reporting criteria havebeen met.Table 2b: Interim Reporting Individual Measure Detail for the NPI (see Example 2.2): Domain: The category of care a measure falls under. Number of Eligible Instances: The number of denominator-eligible instances the TIN/NPI was eligible toreport the measure. Number of Eligible Instances Where QDCs Were Accurately Reported: The number of denominatoreligible instances that were accurately reported with a valid QDC(s). Valid reporting is defined by numeratorand denominator requirements as outlined in the measure specification. As previously mentioned, incentiveeligibility is based upon the final analysis of 12 months of data, and the interim Dashboard data is not the finalindicator of incentive eligibility for the reporting period. Number of Eligible Instances Where No QDC Was Reported: The number of denominator-eligibleinstances where the TIN/NPI could have reported a QDC, but did not.For definition of terms related to Dashboard NPI-level data see Appendix A. For additional content detail, please refer tothe footnotes of each table.Note: The Dashboard may contain a partial or "masked" SSN/SSAN as part of the TIN field. Care should be taken in thehandling and disposition of Dashboard data to protect the privacy of the individual practitioner with which the SSN ispotentially associated. Please ensure that Dashboard data is handled appropriately and disposed of properly to avoid apotential PII exposure or Identity Theft risk.The screenshots are provided for examples only and are subject to change. Minor changes in language and/orformat should be expected.Centers for Medicare & Medicaid Services, 7500 Security Boulevard, Baltimore, MD 21244V1.0 2/26/2014Page 8 of 24
Example 2.1: Table 2a: Interim Reporting Summary for NPI(Individual measures reporting)Figure 2.1 Screenshot of Table 2a: Interim Reporting Summary for NPICenters for Medicare & Medicaid Services, 7500 Security Boulevard, Baltimore, MD 21244V1.0 2/26/2014Page 9 of 24
Example 2.2: Table 2b: Interim Reporting Individual Measure Detail for the NPI(Individual measures reporting)Figure 2.2 Screenshot of Table 2b: Interim Reporting Individual Measure Detail for the NPICenters for Medicare & Medicaid Services, 7500 Security Boulevard, Baltimore, MD 21244V1.0 2/26/2014Page 10 of 24
Accessing the DashboardEPs or their authorized users are able to access the Dashboard via the Physician and Other Health Care ProfessionalsQuality Reporting Portal (Portal), at http://www.qualitynet.org/pqrs, with Individuals Authorized Access to the CMSComputer Services (IACS) sign-in. The Portal is a CMS supported secured website that safely transfers and stores PQRSdata. EPs or their authorized users will have the ability to access prior Dashboard data for up to two years. TheDashboard allows end users to immediately view the current interim data through the website. The Dashboard will notemail data to the requestor. Downloadable and printable PQRS interim data will be available as HTML via the Dashboard.The end user will be able to view TIN- or NPI-level Dashboard data depending on his/her IACS account. These IACSaccounts will have the following permissions: “PQRS Representative” authorization will be able to access TIN-level Dashboard data; which will display NPIlevel data for all eligible professionals under that TIN. “Individual Practitioner” authorization for sole proprietors, who submitted claims under a SSN, will be able toaccess NPI-level Dashboard data. “Security Official” or “Back-up Security Official” roles will not be able to access the Dashboard data.The Dashboard User Guide is available on the Portal to assist EPs and authorized users with navigating through theDashboard, and understanding the Dashboard data.If you do not already have an IACS account, refer to the Quick Reference Guides for step-by-step instructions; see Figure3.1 for assistance in locating these guides. Eligible professionals will need to obtain an IACS account for a “PQRSRepresentative” role or “Individual Practitioner” role for sole proprietors, who submitted claims under a SSN, in order toaccess the Dashboard through the Portal. Those assigned “Security Official” or “Back-up Security Official” roles onlyperform IACS administrative functions, such as creating the Organization and approving IACS accounts, and do not haveaccess to Dashboard data. The New User Registration Menu for CMS Applications isat sp. Provider enrollment information must be current in the MedicareProvider Enrollment Chain and Ownership System (PECOS) in order to request an IACS account,see m Requirements for the DashboardMinimum hardware and software requirements to effectively access and view the Dashboard are listed below.HardwareThe Dashboard requires the following minimum set of hardware requirements: 233 MH Z Pentium processor with a minimum of 150 MB free disk space 64 MB Ram (128MB preferred)SoftwareThe Dashboard requires the following minimum set of software requirements: Microsoft Internet Explorer version 7.0 and above, or Mozilla Firefox Adobe Acrobat Reader version 5.0 and above JRE is 1.6 Windows XP operating systemInternet Connection Dashboard will be accessible via any Internet connection running on a minimum of 33.6k or high-speedInternetCenters for Medicare & Medicaid Services, 7500 Security Boulevard, Baltimore, MD 21244V1.0 2/26/2014Page 11 of 24
Step-by-Step Dashboard InstructionDashboard will only be available to eligible professionals and authorized users who have an IACS account. Only interimdata for the individual/rendering NPI is available via the Dashboard – do not enter a group NPI. Entering a group NPI willresult in a “No Data Available” message.The screenshots are provided for examples only and are subject to change. Minor changes in language and/or formatshould be expected.STEP 1: Portal Sign-In (eligible professionals or authorized users must have IACS sign-in)a) Start at Portal web page, available at http://www.qualitynet.org/pqrs.b) To sign-in to the Portal, click on the “Sign-In” button on the middle of the screen as shown in Figure 3.1.c) Enter your IACS username and password, and click “Sign In” as shown in Figure 3.2.d) Once logged-in, review the Terms and Conditions, click on the box to accept the Terms and Conditions,and click “I Accept” as shown in Figure 3.3.Example 3.1: Screenshot of Step 1Figure 3.1 Screenshot of Portal Web Page (Steps 1 a-b)Centers for Medicare & Medicaid Services, 7500 Security Boulevard, Baltimore, MD 21244V1.0 2/26/2014Page 12 of 24
Example 3.2: Screenshot of Step 1Figure 3.2 Screenshot of Portal Sign In Page (Step 1c)Example 3.3: Screenshot of Step 1Figure 3.3 Screenshot of Terms and Conditions Page (Step 1d)Centers for Medicare & Medicaid Services, 7500 Security Boulevard, Baltimore, MD 21244V1.0 2/26/2014Page 13 of 24
STEP 2: Accessing the Dashboarde) Once signed-in to the Portal, click on “Feedback Dashboard” in top left-hand corner of window as shownin Figure 3.4.Example 3.4: Screenshot of Step 2Figure 3.4 Screenshot of Accessing the Dashboard (Step 2a)Centers for Medicare & Medicaid Services, 7500 Security Boulevard, Baltimore, MD 21244V1.0 2/26/2014Page 14 of 24
STEP 3: “Interim 2014 Physician Quality Reporting System Dashboard” Pagea) The “Interim 2014 Physician Quality Reporting System Dashboard” page will open in either a new tab or anew window based upon your Internet browser settings (see Step 5 for browser pop-up options). The most recent claims-based report period is displayed at the top of the page (as shown inFigure 3.5) This page provides an introduction about the Dashboard data. As new Dashboard data becomesavailable, the date fields throughout this page will update to provide the current report perioddates.b) Review the information on the “Interim 2014 Physician Quality Reporting System Dashboard” page and, ifagreeable, check the box to accept the terms and conditions, and then click “Continue”. See Figure 3.5for an example of these features.Example 3.5: Screenshot of Steps 3a) The “ReportPeriod” displaysthe current claimsbased dataavailable to viewb) After reviewingthe terms andconditions, click onthe box and thenclick “Continue”Figure 3.5 Screenshot of “Interim 2014 Physician Quality Reporting System Dashboard” Page (Steps 3a-b)Centers for Medicare & Medicaid Services, 7500 Security Boulevard, Baltimore, MD 21244V1.0 2/26/2014Page 15 of 24
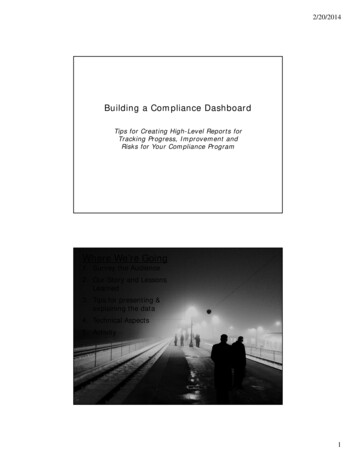
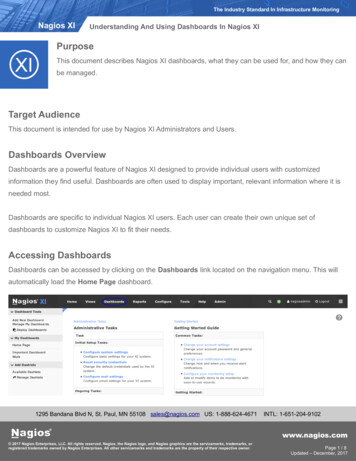
STEP 4: Dashboard Request Report PageAs previously mentioned, the EP or authorized user will be able to view the TIN-level Dashboard Request Reportpage (see Figure 3.6), or the NPI-level Dashboard Request Report page (see Figure 3.7) based on his/her IACSpermissions. The following fields must be completed for the Request Report page:a) Report Type – Based on IACS permissions, end users must choose which report to view from thechoices in the drop-down box. Examples and definitions of the different reports were previouslymentioned in the Dashboard Content and Appearance section.b) NPI # or TIN # – Based on IACS permissions, end users may choose to enter either a NPI or TIN to viewDashboard data for different providers or organizations.1. If able to enter NPI # (Example 3.6) – Enter one individual/rendering NPI (10-digits) to view aspecific EP’s data. Do not enter a group NPI. If no NPI number is entered, the Dashboard willdisplay data for all NPIs associated with the TIN. Only one individual/rendering NPI can beentered for each report request.2. If able to enter TIN # (Example 3.7) – Individual Practitioner should leave this field blank. If thereis a circumstance under which the practitioner also submits claims under a different TIN, enterone TIN (9-digits, including leading “0” if applicable) to view reporting under a specific TIN. If noTIN is entered, the Dashboard will display data for all TINs the EP billed under. Only one TIN canbe entered for each report request.c) Report Format –“HTML”d) Report Period – Select the desired report period from the drop-down box.1. HTML – The table displays up to 20 NPIs per table. TINs with more than 20 NPIs will see multipletables of 20 until all NPIs are listed. The HTML table has a “mouse-over” functionality allowingdefinitions to pop-up when the mouse cursor is placed over keywords. To view the report, scrollup and down with the arrow directions provided on the side of the screen or with the mousewheel.e) Click on the “Request Report” button to continueExample 3.6: Screenshot of Steps 4 (Request Report Page for IACS “PQRS Representative”)a) Select whichperiod of claims datato view from thedrop-down boxb) Select reporttype from thedrop-down boxc) [Optional] enter oneindividual NPI to view aspecific provider's datad) Click on the"Request Report"button to continueFigure 3.6 Screenshot of Dashboard End User Request Report Page (Steps 4a-e)Centers for Medicare & Medicaid Services, 7500 Security Boulevard, Baltimore, MD 21244V1.0 2/26/2014Page 16 of 24
Example 3.7: Screenshot of Steps 4 (Request Report Page for IACS “Individual Practitioners”)a) Select reportperiod from thedrop-down boxb) Select reporttype from thedrop-down boxd) Click on the"Request Report"button to continuec) Those individual practitionerswho may bill under more than
Centers for Medicare & Medicaid Services, 7500 Security Boulevard, Baltimore, MD 21244 V1.0 2/26/2014 Page 4 of 24 . User Guide 2014 Interim Feedback Dashboard . Purpose . The . 2014 Interim Feedback Dashboard User Guide. is designed to assist eligible professionals, and their authorized users, with accessing and interpreting the 2014 interim .