Transcription
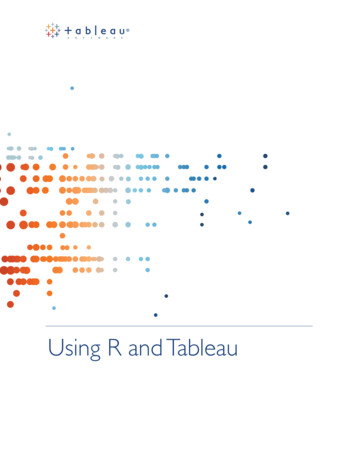
ACT Grad Class Data Tableau DashboardUser GuideThis user guide provides an overview of ACT’s Grad Class Data Tableau Dashboard, including the types of viewsprovided, how to navigate them, and the dropdown menus you can use to refine the information provided viathe dashboard. Currently, the dashboard houses information on the ACT-tested high school graduating classes of2011 through 2020, and can be accessed at act.org/gradclass2020.For information about accessing this dashboard using a keyboard, please see Tableau's help page for keyboardnavigation.ViewsThere are three views, or data visualization options, in the dashboard. Users can move between the views using thetabs provided at the top. Class Composition/Makeup: distributional trends—percentages—of students falling into specificsubgroups, which the user selectsClass Averages and Benchmark Percents: student achievement over time, by user-selected characteristicsand subgroup populationsScore Distributions: number and cumulative percent of student scores on the ACT, with options to examinethe distribution of average ACT Composite scores, STEM and ELA scores, and scores on each subject testEach view allows the user to select one or more states to compare against another one or more states; the defaultview shows the national population.Because interpretation of graduating class composition and achievement levels are impacted by the percentage ofgraduates taking the ACT, a “WICHE-Estimated Overall Percent Tested” bar is included below the first two views.Class Composition/Makeup viewThe first view provides a comparison of students in two geographic areas by percent tested with a selectedcharacteristic, with the ability to break out by all students, STEM-interested students, or non-STEM-interestedstudents.The default view shows the percentage of students nationally (twice) by Number of Benchmarks Met. You areable to select one state to compare to the nation, or you can select a group of states in a region to compare to asingle state or another group of states. You can also change the Student Characteristic to examine the ACT-testedpopulation broken out by race/ethnicity, by post-secondary aspirations, by whether or not they reported taking acore curriculum, and more.Page 1 of 7
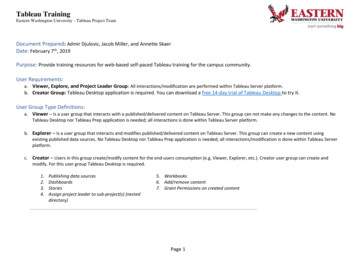
You can hover over any point on the chart to see more information about the indicated population. Thescreenshot provides an example of the gender of test-takers, comparing the state of Iowa to the nation.Class Averages and Benchmark Percents viewThe second view provides a comparison of students in two geographic areas by Academic Achievementdisaggregated by a Student Characteristic, with the option to break out a Student Subgroup by all students,STEM-interested students, or non-STEM-interested students.The default view shows the average ACT Composite score for students nationally (twice) overall. You are able toselect one state to compare to the nation, or you can select a group of states in a region to compare to a singlestate or another group of states. You can change the Academic Achievement indicator to any ACT subject score,the percent meeting specified Benchmarks, or the student-reported high school GPA. You can also change theStudent Characteristic to examine the ACT-tested population broken out by race/ethnicity, by post-secondaryaspirations, by whether or not they reported taking a core curriculum, and more.You can hover over any point on the chart to see more information about the indicated population. Thescreenshot provides an example of the percent of test-takers meeting 3 or 4 Benchmarks by family income,comparing North Carolina to Tennessee.Page 2 of 7
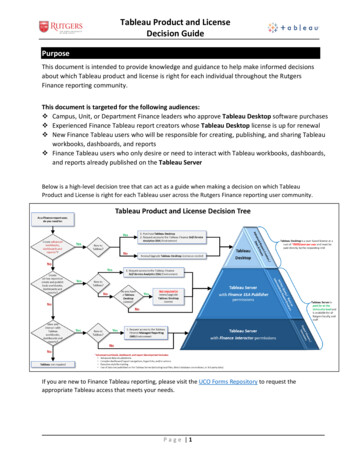
Score Distributions viewThe third view provides tables comparing students in two geographic areas by Academic Achievement.The default view shows the N count and Cumulative Percent of ACT Composite scores for students nationally(twice). You are able to select one state to compare to the nation, or you can select a group of states in a regionto compare to a single state or another group of states. You can change the Academic Achievement indicator toany ACT subject or Composite score.The screenshot provides an example of the number of students achieving each possible ACT STEM score as wellas their cumulative percentages, comparing the state of Ohio to the nation.Page 3 of 7
Refining your informationThe student classifications, apart from states, available in this dashboard are organized into three differentthemes: Student Characteristic, Student Subgroup, and Academic Achievement.1. Student Characteristic Race/Ethnicity Minority Status Highest Parental Education Level First-Generation Status Family Income Low-Income Status Underserved Status Number of Underserved Criteria Met Gender Postsecondary Aspirations College Preparatory Core Coursework Met English-Specific Core Met Math-Specific Core Met Social Science-Specific Core Met Natural Science-Specific Core English Courses Taken/PlannedPage 4 of 7
Math Courses Taken/PlannedSocial Science Courses Taken/PlannedNatural Science Courses Taken/PlannedNumber of Benchmarks MetNumber of Times TestedExtended Time2. Student Subgroup All Students STEM-Interested Students Not STEM-Interested Students3. Academic Achievement Average ACT English Average ACT Math Average ACT Reading Average ACT Science Average ACT Composite Average ACT STEM Average ACT ELA Average ACT Writing Percent Meeting English Benchmark Percent Meeting Math Benchmark Percent Meeting Reading Benchmark Percent Meting Science Benchmark Percent Meeting 3 or 4 Benchmarks Percent Meeting All 4 Benchmarks High School GPABecause interpretation of graduating class composition and achievement levels are impacted by the percentage ofgraduates taking the ACT, a “WICHE-Estimated Overall Percent Tested” bar is included below the first two views.This represents the percentage of high school graduates (based on commonly used estimates from the WesternInterstate Commission for Higher Education) in that geographic entity who took the ACT at least once duringhigh school. Note that abrupt changes in ACT test rates over time can result in abrupt changes to the trend linefor a particular student characteristic. In particular, geographic entities with smaller shares of students taking theACT tend to be less representative of high school graduates in that area, whereas geographic entities with largershares of students taking the ACT tend to be more representative of high school graduates in that area.The dashboard will be pre-populated with particular information by default. For example, the charts and tableswill present information for the national ACT-tested population twice by default unless some other studentpopulation is chosen. Use the dropdown menus to the left of the charts to help refine the information presentedin the dashboard.Page 5 of 7
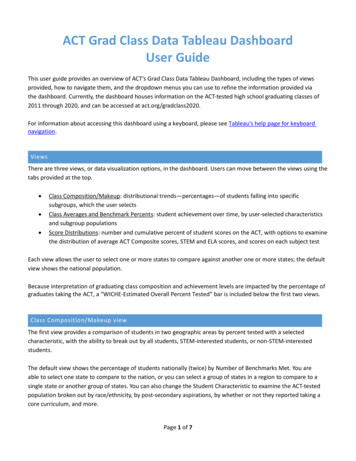
Group 1/2 State Selection(s): The dropdown menus for Group 1 and Group 2 (as shown below) will allow you tolimit the data provided to include only those students who reside within the states chosen. Options to choosefrom include All (national) and any combination of the fifty states or the District of Columbia. To choose state(s)from the menu, click on the downward arrow on the right side of the box, and click on the state(s) of interest.Information in the respective Group 1 or 2 chart or table will update to reflect your selection(s). If you areselecting one state or a subset of states, you may find it easier to deselect “(All)” and then re-select your state(s)of interest. You can scroll through the list, or type a state name in the box to be taken directly to that state.Student Characteristic: This dropdown menu (as shown below) allows you to change the student characteristic bywhich the data are broken out. To choose a characteristic from the menu, click on the downward arrow on theright side of the box, and then click on the characteristic of interest. Information in the charts will update toreflect your change. Only one student characteristic can be selected at a time. On the second view, you may select“Overall/No Disaggregation” to show all students without breaking out by characteristic.Page 6 of 7
Student Subgroup: This dropdown menu (as shown below) lets you further refine the data by selecting asubgroup of students based on STEM interest. You can choose to see data for all students, or those interested ornot interested in STEM majors or careers (expressed or measured by the ACT Interest Inventory). To select asubgroup, click on the downward arrow on the right side of the box, and then click on the subgroup of interest.Information in the charts will update to reflect your change.Academic Achievement: This dropdown menu (as shown below for the second, left, and third views) allows you tochange the academic achievement indicator displayed in the data. To choose an achievement indicator from themenu, click on the downward arrow on the right side of the box, and then click on the indicator of interest.Information in the charts or tables will update to reflect your change. Only one academic achievement indicatorcan be selected at a time.Page 7 of 7
ACT Grad Class Data Tableau Dashboard User Guide. This user guide provides an overview of ACT’s Grad Class Data Tableau Dashboard, including the types of views provided, how to navigate them, and the dropdown menus you can use to refine the information provided via the dashboard. Currentl