Transcription
Data Visualization, A SurveyBy Xi ChenCopyright@2017 by Xiaolab
People observe and perceive objects primarily by vision, which allow them to quickly graspinteresting features in daily scenarios. It is desirable to present information such as datasetsin an organized fashion so that people could understand. The presentation of datasets couldbe challenging when the size of the dataset is huge or the elements in the dataset havecomplex relationships. Therefore, to effectively and efficiently visualize data become aprevalent research direction.Since the first proposal of data visualization as a research topic, hundreds of powerfulvisualization techniques and applications have been developed. Each has its own featuresand rationales. Such a situation stimulates us to investigate and derive the birds eye viewover this field, before we attempt to make our own contribution to the research of datavisualization.The rest of this report is organized as follows: Section 1 introduces fundamental concepts,categorized methods, and symbols commonly used in data visualization field. Section 2introduces notable programming libraries and software applications for data visualization.Section 3 overview important techniques used in visualization. Some lately researchprogresses with respect to visualization are described in Section 4. We made a summary ofprominent data visualization research problems in Section 5.
Table of Contents1.2.3.4.5.Introduction to Data Visualization.41.1. the Definition of Data Visualization .41.2. Common Concepts in Data Visualization .51.3. Data Stream model of Visualization Procedure .51.4. the Categories of Data Visualization Techniques .61.4.1. GeometricProjectionTechniques .71.4.2. Pixel-oriented Techniques. 101.4.2. Hierarchical Techniques . 131.4.4. Iconography Techiniques . 141.5. Usual Symbols Used in Data Visualization . 171.5.1. Static traits . 171.5.2. Change types . 171.5.3. Change Dynamics . 17Libraries and Software . 182.1. Programming Libraries for Data Visualization. 182.2. Tools for Data Visualization. 182.2.1. Common Visualization Tools . 192.2.2. Typical Visualization Tools . 19Data Visualization Research . 353.1. Research Development in Computer Graphics. 363.2. Research Development in Visualization Realizing . 383.3. Research Development in Augmented or Virtual Reality . 47Open Research Problems . 50Reference. 52
1. Introduction to Data VisualizationWith the ever-increasing amount of available computing resources, our ability to collect andgenerate a wide variety of large, complex, high-dimensional datasets continues to grow.High-dimensional datasets show up in numerous fields of study, such as economy, biology,chemistry, political science, astronomy, and physics etc. Their wide availability, increasingsize and complexity have led to new challenges and opportunities for their effectivevisualization. The physical limitations of the display devices and our visual system preventthe direct display and instantaneous recognition of structures with higher dimensions thantwo or three. In the past decade, a variety of approaches have been introduced to visuallyconvey high-dimensional structural information by utilizing low-dimensional projections orabstractions: from dimension reduction to visual encoding, and from quantitative analysis tointeractive exploration. A number of researches have focused on different aspects of datavisualization, such as parallel coordinates, quality measures, clutter reduction, visual datamining, and interactive techniques. In the future, data visualization will become a continualhotspot in the fields of science and industry.1.1. the Definition of Data VisualizationData visualization, is the scientific study in terms of information display. Display format, isdefined as a kind of information recapitulated from raw dataset and involving variousattributes and variables attracting our concern.The basic methodology of data visualization is to interpret each data item within dataset asan element of graph, lots of which form the entire visualization figures, images, or charts.Meanwhile, attributes are exhibited by multi-dimension data. In this way, observating datafrom different dimension is capable, which facilitates expected further analysis to find outtheir internal rules.Critical feature of data visualization can be described as: data visualization and translationtool enables a mapping between source schema and target schema, and they comparedifferent existing mappers on contributions and limitations [2].Furthermore, Ivan Herman, Guy Melançon, and M. Scott Marshall provide a terse standardto determine the applicability of graph visualization [24]: is there an inherent relation amongthe data elements to be visualized? If the answer to the question is “no”, than data elementsare “unstructured” and the goal of the information visualization system might be to helpdiscover relations among data through visual means. If, however, the answer to the questionis “yes”, then the data can be represented by the nodes of a graph, with the edges representingthe relations.
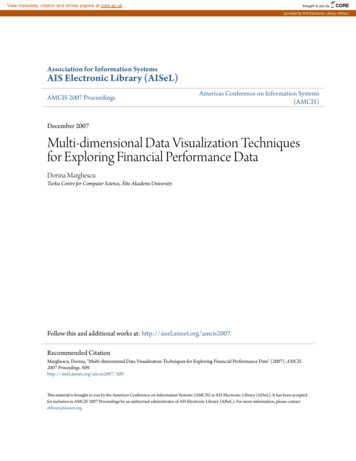
1.2. Common Concepts in Data VisualizationIn visualization field, there are some common concepts used to describe scenarios in auniform and convenient way, summarized as follows:① Data Space: a multi-dimension information space constituted by dataset of manymulti-attribute elements.② Data Development: quantitative deduction and computation of data employingcertain algorithms and tools.③ Data Analysis: utilizing slicing, block, rotation and other operations to analyzemulti-dimensional data, which provides multi-angle and multi-side observation ofdata.④ Data Visualization: the process of translating massive data into graph form, andemploy tools in terms of data analysis and development to procure sealedinformation.1.3. Data Stream model of Visualization ProcedureAlthough there have been a great variety of methods proposed to present data with variousmechanisms, all of them can be abstracted to a common mode. Systematically speaking,visualizing data goes through the following steps:① First, source data are collected from sense, generation, recording or other applicablemethods.② Second, though source data have the biggest chance to reserve the nature of entity,observers may not be able to cognize it by analyzing source data due to obscurerepresentation. As a result, data transformation is required, which promotes sourcedata on validity, integrity, and discrepancy etc. Usual methods of transforming dataare coordinate transformation, interpolation, and filtration etc. Taking advantage ofthese techniques, source data become more suitable for visualization. However,inappropriate transformation can also backfire the influence. Hence,comprehensive awareness of data feature is a critical factor deciding the quality oftransformation.③ Third, since transformed data remain abstract and unintuitive, they require an extramapping process to present data conveniently, i.e. constructing a mapping betweentransformed data and view elements. By now, a number of mapping techniqueshave been proposed.④ Through the former three steps, complete view has been generated. Therefore, userscan observe it and acquire information they want.The aforementioned procedure to visualize data can be felicitously expressed as a flow chart,namely data stream model. Fig. 1 provides an example of the model. Furthermore, itdemonstrates that user reciprocity is accessible in each step.
Figure 1: Categorization based on transformation steps within the information visualizationpipeline, with customized action-driven subcategories [26].1.4. the Categories of Data Visualization TechniquesSince data visualization involves techniques and tools in many fields, such as computergraphics, data mining, computer visualization etc, approaches to visualize data can becategorized according to different criterions.As per Kenneth I. Joy’s classification [23], a data visualization method belongs to one of thefollowing type:①Compression and simplification – Reduce the size of the information stream byutilizing data compression methods or by simplifying the data to remove redundantor superfluous items.② Multiresolution methods – Design multiresolution hierarchies to represent theinformation at varying resolutions, allowing the user (or the application) to dictate theresolution displayed.③ Memory external methods – Create innovative methods that store the dataexternallyand develop methods that access relevant data subject to the interactivityrequired by the user.④ Abstraction – Create new visual metaphors that display data in new ways.While Keim and Kriegel [4] [5] divided visual data exploration techniques formultidimensional multivariate data into six classes, namely geometric, icon-based, pixeloriented, hierarchical, graph-based and hybrid techniques.Furthermore, Winnie Wing-Yi Chan refers this taxonomy and tailors it to multivariate datavisualization techniques, which are classified into four broad categories according to theoverall approaches taken to generate resulting visualizations [27]: Geometric projection,pixel-oriented techniques, hierarchical display and iconography.
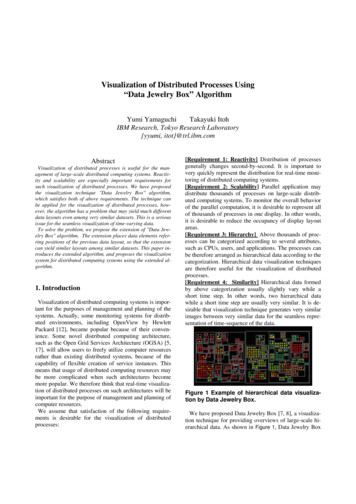
1.4.1.Geometric Projection TechniquesGeometric projection techniques refer to presenting dataset with modern mathematicmethods with respect to geometric brushwork or geometric projection. It is the most prevalentand well-known kind of visualization techniques in the world. In the following, some typicaltechniques using geometric projection are introduced:① Scatterplot Matrix: A method to project data items according to any two attributesserved as x-y axes of the Cartesian coordinates and hence generate a 2D graph.Array all the 2D scatterplot graphs as per the certain order of attributes, a matrixis derived, i.e. so-called scatterplot matrix.Scatterplot matrix is suitable to reflect patterns between two attributes, besides that,this method is simple for us to perform. Its biggest issue [6], however, is theshortcoming in observing correlations among higher dimensions than two.Fortunately the technique of brushing [28] can be applied to address the aboveproblem. Brushing aims interpretation by highlighting a particular n-dimensionalsubspace in the visualization [29], that is, the respective points of interested arecolored or highlighted in each scatterplot in the matrix. Fig. 1 gives an instance ofscatterplot matrix. In Fig. 1, automobiles are color-coded by the number ofcylinders. Manufacturers can analyze the performance of the cars based on thenumber of cylinders for improvements, while customers can decide how manycylinders they need in order to suit their needs.Figure 2. An instance of scatterplot matrix② Prosecution Matrix: Prosection was first introduced by Furnas and Buja [30];Tweedie and Spence [31] later extended it to prosection matrix which supports ahigher dimensionality. Akin to scatterplot matrix, prosecution matrix is also consistof many prosecution graph elements. These graphs are capable to selectappropriate parameter range by representing data items lying in the range withdifferent colors. A typical prosecution is shown in Fig. 3. The yellow rectangles inFig. 3 indicate the tolerances on parameter values, Yet it gives less informationabout the correlations between more than two attributes.
Figure 3. A typical Prosecution Matrix③ Hyperslice: The most significant improvement of hyperslice over scatterplot is theinteractive data navigation around a user defined focal point [32]. An enhancedhyperSlice was also proposed [33] which incorporate the concept of displayresolution supported by space projection, together with the concept of dataresolution provided by wavelets to form a powerful multiresolution visualizationsystem. Fig. 4 presents a hyperslice for 4D function [32].Figure 4. Hyperslice for 4D function [32]④ hyperbox: Like the above techniques, hyperbox [32] indicates to visualize datawith a box rather than a matrix. It can be a more powerful tool as it is possible tomap variables to both size and shape of the face. Hence emphasizing or deemphasizing certain variables [32] is also permitted. Whereas, due to the limitationof 2D to depict high-dimension figures, the length and orientation may mislead theinformation as it violates the “banking to 45 degrees” principle [34].
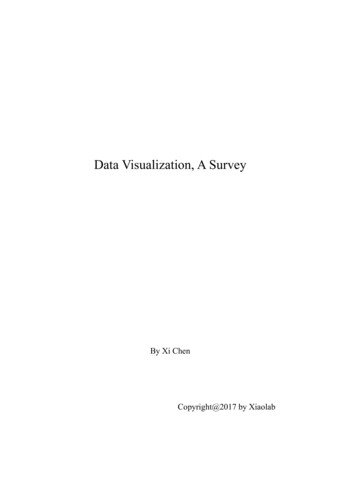
Figure 5. An example of hyperbox [32]⑤Parallel Coordinates [35]: Parallel Coordinates is a well-known technique whereattributes are represented by parallel vertical axes linearly scaled within their datarange. Each data item is represented by a polygonal line that intersects each axisat respective attribute data value, as Fig. 6 shows.Parallel coordinates can be used to study the correlations among attributes byspotting the locations of intersection points [32]. Also, they are effective to revealthe data distributions and functional dependencies. Nevertheless, one majorlimitation is the limited space available for each parallel axis. Visual clutters canseverely hamper the user’s ability to interpret the visualizations and interact withit. Akin to former methods, brushing technique is also applicable in this case.⑥Andrews Curve: data items are plotted as Fourtier transforms [20]. It’s useful todetect clusters and outliers [21] and extensible to many dimensions, butcomputationally expensive to handle huge datasets.Figure 6. A demonstration of parallel coordinates [6]Figure 7. Andrew curves [20]⑦Star Coordinates: Star coordinate [36] is an extension of typical scatterplots tohigher dimensions Data items are presented as points and attributes are representedby the axes arranged on a circle.Users can apply scaling transformations to change the length of an axis, whichincreases or decreases the contribution of an attribute. It also provides rotation
transformations that change the direction of an axis, so the angles are no moreequal and thus making an attribute more or less correlated with other attributes.An example of star coordinates after transformation is shown in Fig. 8. It has beenfound to be useful in gaining insight into hierarchically clustered datasets and formulti-factor analysis for decision-making [3].Figure 8. Star coordinate with transformation [36]⑧Table Len: A display of data enable each row to represent a data item and thecolumns refer to the attributes [37]. Table lens was motivated by the regularitynature of traditional tables, where information along rows or columns isinterrelated and can be interpreted as a coherent. It therefore takes advantage inusing a concept which we are familiar with. Fig. 9 provides a paragon of typicaltable len. As it shows, each attribute can be viewed as a histogram or as a plot.Figure 9. A paragon of typical table len [38]1.4.2. Pixel-oriented TechniquesPixel-oriented techniques enable each data item to be mapped into a pixel, hence avoidanceis acquired for record overlap and visual clutter [27].These techniques can be further divided into two subgroups, query-independent and querydependent. Query-independent techniques are favored by data with a natural order accordingto one attribute, while query-dependent visualizations are more appropriate if the feedbackto some query is of interest [39]. For the latter, the distances of attribute values to the query,instead of the absolute values, are mapped to colors.
① Space Filling Curves [8]: Space Filling Curves is a query-independent methodthat provides an excellent clustering of closely related data items [27]. Formultivariate data, curves of particular attributes are display in separate windows.The length and width of window, as well as pixel color can represent one vitaldata attribute, respectively. By this way, data items with akin attributes willconverge spontaneously. Some well-known space filling curves are curves byPeano-Hibert [40] and Morton [41], as shown in Fig. 10.Figure 10. Space filling curves (a) Peano-Hibert (b) Morton② Recursive Pattern [9]: Recursive Pattern draws space filling curves in an iterativeand recursive way, i.e. each element in a pattern window is also the window of itschild pattern, similar to hierarchical technique. Besides, all of child patternstogether decide its feature. Recursive pattern overcomes the liability of PeanoHibert and Morton in intelligibility, establishment of correlation among subwindows, and reciprocity with users. It allows us to conceive the architecture offigures, which contributes to better presentation performance. Whereas, once thedata becomes overwhelming, its capacity of complex architecture will fade therole of any single attribute inevitably. Fig. 11 exhibits a simple instance ofrecursive pattern.Figure 11. a simple instance of recursive pattern③ Spiral and axes technique: the 100% correct answers are presented in the middleof the window and the approximate answers sorted according to their overalldistance (or relevance) in a generalized spiral form around this region [39]. Axestechnique [42] improves the spiral one by including feedback on displacement,by dividing the window to sub-windows as per the sign of distances on respective
dimensions. Fig. 12 shows their implementation intuitionally.Figure 12. Spiral and axes technique result of an 8-dimensional dataset④ Circle Segment [11]: each segment represents a dimension, and data items areidentified by respective distances to center. The ordering and colors of the pixelsare similarly determined by their overall distance to the query. Fig. 13 is anexample of circle segment visualization.Figure 13. (a) Circle segment arrangement for 8-diemensaionl data(b) An example of circle segments⑤ Pixel Bar Chart [12]: derived from regular bar chart, presents data values directlyinstead of aggregating them into a few data values. Each data item is representedby a single pixel and is placed in the bars accordingly. For higher-dimensionaldata, multi-pixel bar charts are proposed, see Fig. 14. Charts are duplicated anddifferent attribute is colored-coded for each chart.Figure 14. Multi-pixel bar chart with color encoding different attributes
1.4.2.Hierarchical TechniquesHierarchical techniques target to process organized data as per hierarchical format withindatabase. Its critical idea is to divide n-dimension space into a certain number of subspaces,and then iteratively divide these subspaces. Below, some usual hierarchical techniques areintroduced:① Hierarchical Axis: A method of putting many attributes into one screen [13]. Axesare laid out horizontally in a hierarchical fashion as illustrated in Figure 15.Figure 15. Histograms within histograms matrix② Dimensional Stacking: A variation of hierarchical axis, or to segment the dataspace into 2-dimensional subspaces stacked into each other, which is suitable fordiscrete categorical or binned ordinal values [13]. The grids in Fig. 16 indicatevisualization of any two different attributes, represented by horizontal axis andvertical axism respectively. Another comprehension of dimensional stacking froma unique view is interesting: The extended implementation of hierarchical axis in2-dimensional environment.Figure 16. Partition of dimensional stacking③ World within world, or n-vision [14]: It generates an interactive hierarchydisplay, instead of the static objects in the previous one, by using powerful 3Drendering [22]. It allows the exploration of n-dimensional function spaces, butcould also be adapted to n-dimensional datasets [20]. Fig. 17 is given to show oneof its example.
Figure 17. N-Vision④ Treemap: suitable to obtain an overview on large datasets with multiple ordinalattributes [15]. Furthermore, it subdivides the display in a space-filling mannerthat fully utilizes the available display space [43]. Fig. 18 presents a typicaltreemap. As it shows, each standard rectangular area represents a subclassification.Furthermore, the bigger square the area has, the higher level of subclassificationis.Figure 18. Typical Treemap1.4.4. Iconography TechniquesIconographic or icon-based techniques map each multidimensional data item to an icon or amore characteristic glyph, where visual features coincide to data attribute values. Severalgraphical parameters are usually contained in an icon, which makes it possible to handlemultidimensional data. Besides, observations of graphical features are pre-attentive which iswelcomed by human. However, unlike geometric techniques that treat all the dimensionsequally, some features in glyphs are more salient than others, and adjacent elements are easierto be related and accuracy of perceiving different graphical attributes varies between humanstremendously. It thereby introduces biases in interpreting the result [3].① Chernoff Faces: attributes are represented by organs on face. Its shortcoming isthat different features cannot be compared to each other. One common issue toall multidimensional icons, including Chernoff faces, is that the semanticrelation to the task has significant impact on the perceptive effectiveness [44].Yet it will then very much depend on the application domain. Fig. 19 is a
paragon of chernoff faces.Figure 19. Chernoff faces in various 2D positions② Star glyph: There are many variants in the glyph family for displayingmultidimensional data; star plot [45] is one of the most widely used glyphs.Whereas, it is only effective when data size is moderate. An instance of star glyphis given in Fig. 20. Besides, star plots can be further combined with other glyphsto encode extra information, as shown in Fig. 21.Figure 20. Architecture of a star plotFigure 21. Box plot stars③ Stick Figure: map two attributes to the display axes and the remaining to therotation angle, length and etc, its deterministic factor is graphical attribute. Fig.22 is a stick figure for visualizing 5D image data. It provides a meticulouspresentation to visualize data, and hence affects audiences aesthetically. However,the liability of this feature also exists —— extremely strict requirement for
resolution ratio of screen and for visual sharpness of observer’s eyes.Figure 22. 5D image data using stick figures④ Color Icon: is a combination of the pixel-based spiral axes and icon-based shapecoding techniques, merging color, shape and texture perception for iconographicintegration [16]. As shown in Fig. 23, pixel in spiral curve is replaced by pixelarray, whose element stands for a single attribute. In the center of picture, theyellow arrays state those data items satisfying query completely. Along the spiralcurve, satisfying degree of presented data items for query declines constantly.⑤Figure 23. Color Icon Spiral CurveTexture: allow users to gain insight into the overall relationships betweenattributes and it is supported by recent advanced texture systhesis techniques[17], [18]. Fig. 24 presents a texture application in visualization of weatherconditions.Figure. 24 Texture visualization of weather conditions
1.5. Usual Symbols Used in Data VisualizationTo present data in a meaningful way, some intelligible symbols are favored and commonlyused by public. Usual symbols used for visualizing can be categorized as per entity state,including static traits, change types, and change dynamics [19].1.5.1. Static traitsSymbols belonging to this type tend to reflect innate feature of entities, like composition,correlation and etc. Fig. 25 shows several familiar symbols to describe static traits, includingconstruction, segmentation, distribution, similarity, boundedness.Figure 25. Visual denotation of static traits1.5.2. Change typesSome symbols are used to depict variation of entity. Unlike static traits, change typeunderscores entity transformation rather than entity itself. Usual transformation refers togeographic position, shape, size, as well as other individual attributes of entity. Fig. 26demonstrates four kinds of change types, namely movement, growth, combination, andtransformation, respectively.Figure 26. Visual denotation of change types1.5.3. Change DynamicsIf change is found to happen with specific rule, the transforming rule should also beillustrated in view, i.e. so-called change dynamics. Fig. 27 gives some typical instances,including simultaneity, causality, sequence, cycle. It is obvious that each symbol of change
dynamics contains at least two entities with different attributes, which is akin to usual changetype. But the most understanding discrepancy between the two categories lays in whetherthese entities have strong correlation in terms of time, order, or variation requirement.Figure 27. Visual denotation of change dynamics2. Libraries and Software2.1. Programming Libraries for Data VisualizationWith the development of internet technologies in recent years, massive data are convenientto be displayed on computer. As a result, programming inclines to become a popular methodto realize data visualization. So far, class libraries based on different programming languageshave been constructed and shared in the world, which turns data presentation into simplecoding stuff with complex structure or titanic size.Considering current context, JavaScript provides the most libraries among programminglanguages, numbered around 30. Python follows, numbered 20 plus. But other numerouslanguages also offer special capacities to data visualization.Existed libraries based on various languages are:① JavaScript: Chart.js, D3.js, FusionCharts, JavaScript InfoVis ToolKit, JqueryVisualize, ZingChart, Flot, Gephi.② Python:matplotlib, mayavi.③ Classical math analysis tools: Mathematica, Matlab, Maple.④ R: ggplot2, Java: JFreeChart.⑤ Plotly, gnuplot, origin, sigmaplot, Microsoft Math, SciLab, visio.⑥ GeoGebra(based on Java), processing(based on Java), jpGraph(based on PHP),NodeBox(based on Python)2.2. Tools for Data VisualizationAs a saying goes, “Sharp tools make good work”. To keep pace with technology developmentand application requirement of data visualization, lots of powerful and easy-to-use tools havebeen released in recent years. Some common visualization tools are displayed here, and
several typical tools are introduced and commented briefly.2.2.1. Common Visualization ToolsThis section displays common visualization tools employed in different fields.① Coding independent visualization tools: Tableau, Raw, Infogram, ChartBlocks,Visualize Free Visual.ly, iCharts② Geography visualization tools: CartoDB, InstantAtlas, Polymaps, OpenLayers,Kartograph, Exhibit, Modest Map, Leaflet③ Financial visualization tools: Dygraphs, Highcharts④ Time axis visualization tools: Timeline, Dipity⑤ Function and Formula visualization tools: WolframAlpha, Tangle⑥ Other visualization tools: Better World Flux, Google Charts, Crossfilter2.2.2. Typical Visualization ToolsPromoted by industrial market requirements for efficient and professional visualization, sortsof commercial products or free products have been released by now. This section introducesseveral typical visualization tools and make brief comments on them respectively.① Excel: Excel has always been a ubiquitous visualization tool since Microsoftreleased it. As a rudimental tool, it is quite ideal for ordinary users to analyze datarapidly. Excel has capacity to draw a majority of usual data charts, but it showsboundedness in selectable colors, lines, and forms, which indicates it is hard forExcel to draw charts meeting standards of professional publication or officialwebsites.Figure 28. Microso
A number of researches have focused on different aspects of data visualization, such as parallel coordinates, quality measures, clutter reduction, visual data mining, and interactive techniques. In the future, data visualization will become a continual hotspot in the fields of science and industry. 1.1. the Definition of Data Visualization