Transcription
Information Visualization ToolsDr. Katy BörnerCyberinfrastructure for Network Science CenterInformation Visualization LaboratorySchool of Library and Information ScienceIndiana University, Bloomington, INhttp://cns.iu.eduWith special thanks to Kevin W. Boyack, Chin Hua Kong, Micah Linnemeier,Russell J. Duhon, Patrick Phillips, Joseph Biberstine, Chintan TankNianli Ma, Scott Weingart, Hanning Guo, Mark A. Price, Angela M.Zoss, Ted Polley, and Sean LindPanel Discussion, All School DayUniversity of North Texas, Denton ,TXOctober 1, 2011Börner, Katy. (March 2011).Plug-and-Play Macroscopes.Communications of the ACM,54(3), 60-69.Video and paper are athttp://www.scivee.tv/node/277042
Sci2 Tool: Download, Install, and RunSci2 Tool v0.5.1 Alpha (May 4th, 2011)Can be freely downloaded for all majoroperating systems fromhttp://sci2.cns.iu.eduSelect your operating system from thepull down menu and download.Unpack into a /sci2 directory.Run /sci2/sci2.exeSci2 Manual is athttp://sci2.wiki.cns.iu.eduCite asSci2 Team. (2009). Science of Science (Sci2) Tool.Indiana University and SciTech Strategies,http://sci2.cns.iu.edu .34
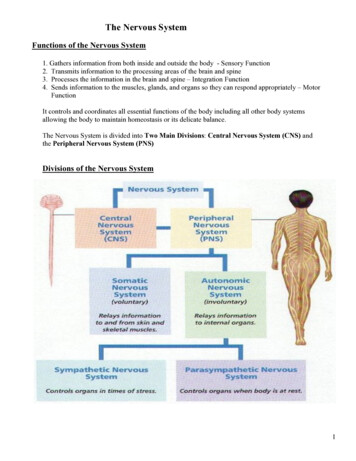
Type of Analysis vs. Level of AnalysisMicro/Individual(1-100 records)Meso/Local(101–10,000 records)Macro/Global(10,000 records)StatisticalAnalysis/ProfilingIndividual person andtheir expertise profilesLarger labs, centers,universities, researchdomains, or statesAll of NSF, all of USA,all of science.Temporal Analysis(When)Funding portfolio ofone individualMapping topic burstsin 20-years of PNAS113 Years of PhysicsResearchGeospatial Analysis(Where)Career trajectory of oneindividualMapping a statesintellectual landscapePNAS publciationsTopical Analysis(What)Base knowledge fromwhich one grant draws.Knowledge flows inChemistry researchVxOrd/Topic maps ofNIH fundingNetwork Analysis(With Whom?)NSF Co-PI network ofone individualCo-author networkNIH’s core competency5Open Code for Replicable S&T AssessmentOSGi/CIShell powered tool, see http://cishell.orghttp://sci2.cns.iu.edu http://sci2.wiki.cns.iu.eduSci MapsGUESS Network VisHorizontal Time GraphsBörner, Katy, Huang, Weixia (Bonnie), Linnemeier, Micah, Duhon, Russell Jackson, Phillips, Patrick, Ma, Nianli, Zoss,Angela, Guo, Hanning & Price, Mark. (2009). Rete-Netzwerk-Red: Analyzing and Visualizing Scholarly NetworksUsing the Scholarly Database and the Network Workbench Tool. Proceedings of ISSI 2009: 12th International Conferenceon Scientometrics and Informetrics, Rio de Janeiro, Brazil, July 14-17 . Vol. 2, pp. 619-630.6
Sci2 ToolGeo MapsCircular Hierarchy7Network Extraction: ExamplesAuthor co-occurrence networkPaper-author 2-mode network8
910
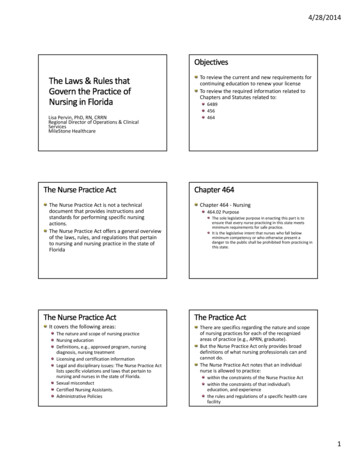
11Sci2 Tool Interface ComponentsSee also http://sci2.wiki.cns.iu.edu/2.2 User InterfaceUse Menu to read data, runalgorithms. Console to see work log,references to seminal works. Data Manager to select, view,save loaded, simulated, orderived datasets. Scheduler to see status ofalgorithm execution.All workflows are recorded into a log file (see /sci2/logs/ ), and soon can be rerun for easy replication. If errors occur, they are saved in a error log to ease bugreporting.All algorithms are documented online; workflows are given in tutorials, see Sci2Manual at http://sci2.wiki.cns.iu.edu12
Network Visualization:Giant Component.Weak Component Clustering was selected.Implementer(s): Russell DuhonIntegrator(s): Russell DuhonInput Parameters:Number of top clusters: 103 clusters found, generating graphs for the top 3 clusters.13Network Visualization:Color/Size Coding by Degree.Node Degree was u/community/?n AnalyzeData.NodeDegree.14
Network Visualization:Color/Size Coding by Betweeness Centrality.Node Betweenness Centrality was selected.Author(s): L. C. FreemanImplementer(s): Santo FortunatoIntegrator(s): Santo Fortunato, Weixia HuangReference: Freeman, L. C. (1977). A set of measuring centralitybased on betweenness. Sociometry. 40:35-41.Input Parameters:Number of bins: 10umber of bins: 10.15Network Visualization:Reduced Network After Pathfinder Network Scaling.MST-Pathfinder Network Scaling was selected.Input Parameters:Weight Attribute measures: SIMILARITYEdge Weight Attribute: weight.16
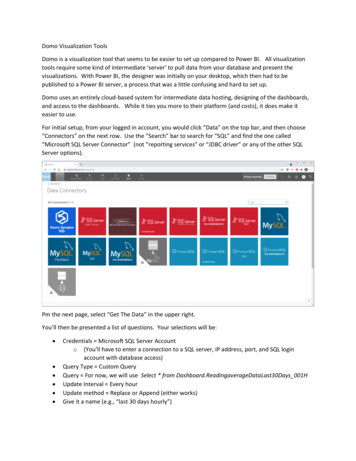
Network Visualization:Circular Hierarchy VisualizationSelect Co-Author Network and run Blondel Community detection:With parameter values17Network Visualization:Circular Hierarchy VisualizationNodes that are interlinked/clusteredare spatially close to minimize thenumber of edge crossings.Node labels, e.g.,author names.Network structureusing edge bundling.Color coded clusterhierarchy according toBlondel communitydetection algorithm.Note:Header/footer info, legend, and more meaningful color coding are under development.18
Topic Mapping: UCSD Science MapData:WoS and Scopus for 2001–2005, 7.2 millionpapers, more than 16,000 separate journals,proceedings, and seriesSimilarity Metric:Combination of bibliographic coupling andkeyword vectorsNumber of Disciplines:554 journal clusters further aggregated into 13 mainscientific disciplines that are labeled and colorcoded in a metaphorical way, e.g., Medicine isblood red and Earth Sciences are brown as soil.19How to Read the UCSD MapUCSD Science Mapwith data overlay.Circle of non-located,e.g., ‘Unclassified’records.Map legend ofcircle area sizecodingHeader and footer withinformation when thismap was created, bywhom and using whatdata set.Listing of all datarecords organized intoUCSD science areas.Listing and circle ofnon-located, e.g.,‘Unclassified’ records.20
Geospatial maps with congressional districtsIdentify Congressional District, Latitude, LongitudeAggregate/Count identical Congressional Districts21How to Read the Geo MapU.S. Map withdata overlay.Listing of maptype, author, andparameters used.Header and footerwith informationwhen this mapwas created, bywhom and usingwhat data set.Map legend withcolor coding.22
Evolving collaboration networks23Evolving collaboration networksLoad isi formatted fileAs csv, file looks like:Visualize each time slide separately:24
Scholarly Database at Indiana Universityhttp://sdb.wiki.cns.iu.eduSupports federated search of 25 million publication, patent, grant records.Results can be downloaded as data dump and (evolving) co-author, paper-citation networks.Register for free access at http://sdb.cns.iu.edu2526
Since March 2009:Users can download networks:- Co-author- Co-investigator- Co-inventor- Patent citationand tables forburst analysis in NWB.27CIShell – Integrate New AlgorithmsCIShell Developer Guide is at http://cishell.wiki.cns.iu.eduAdditional Sci2 Plugins are at http://sci2.wiki.cns.iu.edu/3.2 Additional Plugins28
OSGi & CIShell CIShell (http://cishell.org) is an open source software specification for the integrationand utilization of datasets, algorithms, and tools. It extends the Open Services Gateway Initiative (OSGi) (http://osgi.org), astandardized, component oriented, computing environment for networked serviceswidely used in industry since more than 10 years. Specifically, CIShell provides “sockets” into which existing and new datasets,algorithms, and tools can be plugged using a wizard-driven process.DevelopersWorkflowAlgAlgUsersCIShell WizardsAlgCIShellSci2 ToolWorkflowNWB ToolToolWorkflowWorkflowTool29CIShell – Add new Plugins, e.g., CytoscapeAdding more alyout algorithms and network visualization interactivityvia Cytoscape http://www.cytoscape.org.Simply add org.textrend.visualization.cytoscape 0.0.3.jar into your /plugin directory.Restart Sci2 Tool.Cytoscape now shows in the Visualization Menu.Select a network in Data Manager, run Cytoscape and the tool will start with thisnetwork loaded.30
EuropeOSGi/CIShell AdoptionEuropeUSAA number of other projects recently adopted OSGi and/or CIShell: Cytoscape (http://cytoscape.org) Led by Trey Ideker at the University of California, San Diego isan open source bioinformatics software platform for visualizing molecular interactionnetworks and integrating these interactions with gene expression profiles and other state data(Shannon et al., 2002). MAEviz (https://wiki.ncsa.uiuc.edu/display/MAE/Home) Managed by Jong Lee at NCSA is anopen-source, extensible software platform which supports seismic risk assessment based onthe Mid-America Earthquake (MAE) Center research. Taverna Workbench (http://taverna.org.uk) Developed by the myGrid team(http://mygrid.org.uk) led by Carol Goble at the University of Manchester, U.K. is a freesoftware tool for designing and executing workflows (Hull et al., 2006). Taverna allows usersto integrate many different software tools, including over 30,000 web services. TEXTrend (http://textrend.org) Led by George Kampis at Eötvös Loránd University, Budapest,Hungary supports natural language processing (NLP), classification/mining, and graphalgorithms for the analysis of business and governmental text corpuses with an inherentlytemporal component. DynaNets (http://www.dynanets.org) Coordinated by Peter M.A. Sloot at the University ofAmsterdam, The Netherlands develops algorithms to study evolving networks. SISOB (http://sisob.lcc.uma.es) An Observatory for Science in Society Based in Social Models.As the functionality of OSGi-based software frameworks improves and the number anddiversity of dataset and algorithm plugins increases, the capabilities of custom tools will expand.32
TEXTrend adds R bridge, WEKA, Wordij, CFinder, and more.See the latest versions of TEXTrend Toolkit modules athttp://textrend.org/index.php?option com content&view article&id 47&Itemid 5333Network Workbench Toolhttp://nwb.cns.iu.eduThe Network Workbench (NWB) toolsupports researchers, educators, andpractitioners interested in the study ofbiomedical, social and behavioral science,physics, and other networks.In February 2009, the tool provides more 169plugins that support the preprocessing,analysis, modeling, and visualization ofnetworks.More than 50 of these plugins can beapplied or were specifically designed forS&T studies.It has been downloaded more than 100,000times since December 2006.Herr II, Bruce W., Huang, Weixia (Bonnie), Penumarthy, Shashikant & Börner, Katy. (2007). Designing Highly Flexible and UsableCyberinfrastructures for Convergence. In Bainbridge, William S. & Roco, Mihail C. (Eds.), Progress in Convergence - Technologies for HumanWellbeing (Vol. 1093, pp. 161-179), Annals of the New York Academy of Sciences, Boston, MA.3434
35All papers, maps, tools, talks, press are linked from http://cns.iu.eduCNS Facebook: http://www.facebook.com/cnscenterMapping Science Exhibit Facebook: http://www.facebook.com/mappingscience36
Network Visualization: Circular Hierarchy Visualization 17 Select Co-Author Network and run Blondel Community detection: With parameter values Network Visualization: Circular Hierarchy Visualization 18 Node labels, e.g., author names. Network structure using edge bundling. Color coded cluster hierarchy according to Blondel community detection .