Transcription
3D Scientific Visualizationwith BlenderBrian R. Kent, Ph.D.Scientist, National Radio Astronomy Observatorywww.cv.nrao.edu/ bkent/blenderTwitter and Instagram: @VizAstro
Watch the live broadcast of this presentation, courtesy of NCSA, at:https://youtu.be/8FqGNdvEVWo?t 539
Interesting in learning more?Book and tutorials available at:http://www.cv.nrao.edu/ ronomyTwitter and Instagram: @VizAstroBrian R. Kent, Ph.D.Scientist, National Radio Astronomy Observatory
Overview - 3D Scientific Visualization with Blender Science domain and data of astronomy What and why we need to visualize data All about the visualization tool Blender Examples Intro to using the interfaceDr. Brian R. Kent3D Visualization
NRAO Radio TelescopesDr. Brian R. Kent3D Visualization
Dr. Brian R. Kent3D Visualization
Astrophysical PhenomenaDr. Brian R. Kent3D Visualization
Dr. Brian R. Kent3D Visualization
Dr. Brian R. Kent3D Visualization
Dr. Brian R. Kent3D Visualization
What do we do in observational astronomy?Caltech/NRAO/NASA/STScIRemote sensing and planetary explorationDr. Brian R. Kent3D Visualization
Remote Sensing Imaging from the ground or space of phenomena thatwe can’t physically reach The entire physical Universe is our laboratory Spectroscopy Dynamics and kinematics, chemistry Imaging Earth looking out, and from orbit looking at planets Time-series Asteroid identification, light-curves for planet finding, andpulsar timing for general relativityDr. Brian R. Kent3D Visualization
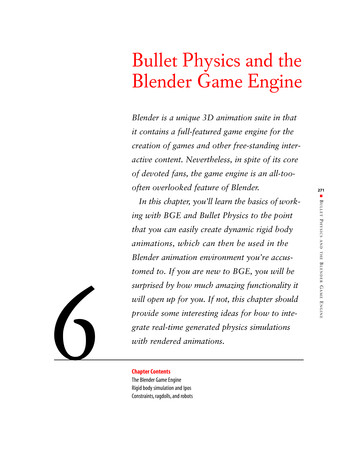
Astrophysical Simulations N-body simulations Smoothed Particle Hydrodynamics Numerical Relativity Models of Interacting Binary StarsActive Galactic Nuclei JetsBlack HolesInteracting GalaxiesData from Matt Wood,Texas A&MUniversity-CommerceDr. Brian R. Kent3D Visualization
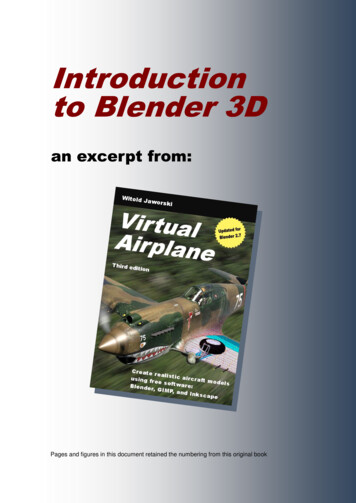
Data Rates in Astronomy The Atacama LargeMillimeter Array (ALMA)in Chile has produced: over 1300 Terabytesof total data in 2014. over 2700 Terabytesof total data in 2016The Very Large Array inNew Mexico has thecapability of producing amillion simultaneousfrequency channels.Current VLA Sky Surveygenerates 300 GB of rawdata in four hours.Dr. Brian R. Kent3D Visualization
Dr. Brian R. Kent3D Visualization
Types of Data in AstronomyDr. Brian R. Kent3D Visualization
Why do we need to visualize?In addition to increasing data rates,data are becoming increasinglycomplex. We have moved from the paradigm of studying a singlespectral line to thousands of lines the paradigm of single galaxydynamics to millions of galaxiesThe parameter space continues toincrease - efficient database usage,signal extraction, and visualizationmethods are required.Dr. Brian R. Kent3D Visualization
High-performance computingStudy from Kent (PASP) 2013Dr. Brian R. Kent3D Visualization
Software for 3D graphicsHOUDINIDr. Brian R. Kent3D Visualization
Blender3D Graphics and VisualizationDr. Brian R. Kent3D Visualization
What is Blender?Blender is: 3D graphics software for modeling,animation, and visualization Open-source A real-time 3D viewer and GUI A Python scriptable interface forloading datahttp://www.blender.orgDr. Brian R. Kent3D Visualization
Elements of 3D GraphicsWe need to consider: Models - physical or data containers? Textures - 2D, 3D, and projections? Lighting - illumination of data - physical or artistic Animation - How will the model move and change? Camera control - lens selection, angle, image size, andmovement and tracking Rendering - backend engine choice Compositing - layering final outputDr. Brian R. Kent3D Visualization
Dr. Brian R. Kent3D Visualization
Modeling
Texturing and MappingDr. Brian R. Kent3D Visualization
AnimationDr. Brian R. Kent3D Visualization
Camera Control and MovementDr. Brian R. Kent3D Visualization
Rendering Engine Blender (included) Cycles (included) Yafaray (open source ray tracing enginehttp://www.yafaray.org/) Luxrender (http://www.luxrender.net/en GB/index) Octane (http://render.otoy.com/) n)Dr. Brian R. Kent3D Visualization
CompositingDr. Brian R. Kent3D Visualization
Rendering and Compositing
Examples
Planetary Models High resolution maps from orbit can be combined withatmospheres, backgrounds, and lighting elements for arealistic /create-a-realistic-earth/Dr. Brian R. Kent3D Visualization
Dr. Brian R. Kent3D Visualization
Dr. Brian R. Kent3D Visualization
Magnetic FieldsDr. Brian R. Kent3D Visualization
Data Cubes Gridded data can come from telescopes orsimulations Radio telescopes produce grids that cover. Two sky coordinates (X and Y) Frequency (Z - the doppler shifted velocity) These cubes can show the dynamics of galaxies,planetary disks, and large scale structureformation of clustersDr. Brian R. Kent3D Visualization
Data Cubes Density maps of the nearby Universe can becreated on regularly spaced grids. The results of these surveys allow to studynot only the density of galaxies in 3D, butalso the effects of gravity in the sameregions of space.Dr. Brian R. Kent3D Visualization
Data from Saunders et al. 2000 and Schmoldt et al. 1999Dr. Brian R. Kent3D Visualization
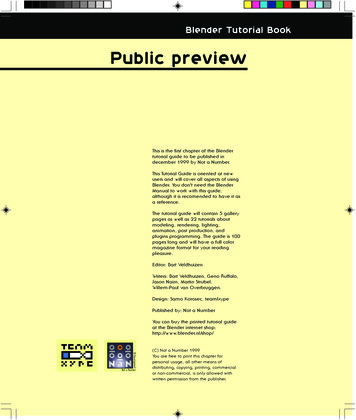
N-body Simulations Data generated from GADGET-2(Galaxies and Dark Matter Interacting 2)N-body/SPH code: http://www.mpa-garching.mpg.de/gadget/30,000 particles, 1100 snapshots run for 2billion yearsBlender Python interface used to bring XYZposition data into the vertices of BlenderobjectsObjects are “textured” with Halos.Each grid square is approximately 33,000 lightyearsDr. Brian R. Kent3D Visualization
Galaxy CatalogsCourtois et al. 2009 and the extragalactic distance databaseDr. Brian R. Kent3D Visualization
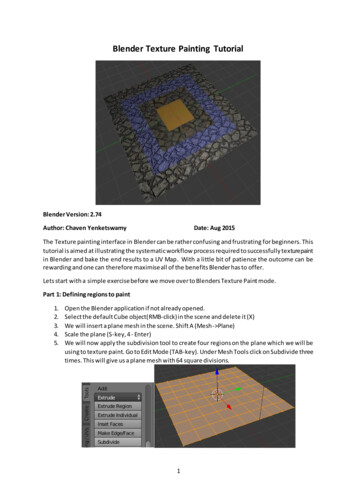
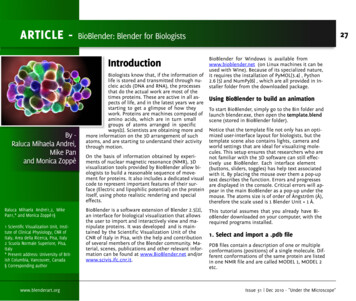
Other Sciences: Biologyhttp://www.bioblender.org
Other Fields: visualising-qgis-data-with-blender
408 MHz NASA SkyView or Montage (Berriman et al.)Google Spatial Media ModuleDr. Brian R. Kent3D Visualization
360 Panoramas (Kent 8-3873/aa5543Dr. Brian R. Kent3D Visualization
Courtois and Tully et al. Extragalactic Distance Databasehttps://www.youtube.com/watch?v vW93wkDqz54Dr. Brian R. Kent3D Visualization
Fluke et al. 2018Vohl et al. 2017
Jill Naiman et al.Rhys Taylor et al.Matias Garate et al.
Education and public outreachThomas MaduraBenedikt Diemer and Isaac FacioNRAO NINE Program
PASP Special IssueContribute to Volume alizationDr. Brian R. Kent3D Visualization
A Tour of theBlender Interface
Blender InterfaceDr. Brian R. Kent3D Visualization
Blender interfaceTranslationRotationScalingDr. Brian R. Kent3D Visualization
Interesting in learning more?Book and tutorials available at:http://www.cv.nrao.edu/ ronomyTwitter and Instagram: @VizAstroBrian R. Kent, Ph.D.Scientist, National Radio Astronomy Observatory
All about the visualization tool Blender Examples Intro to using the interface Dr. Brian R. Kent 3D Visualization. NRAO Radio Telescopes Dr. Brian R. Kent 3D Visualization. . increase -efficient database usage, signal extraction, and visualization methods are required. Dr. Brian R. Kent 3D Visualization. High-performance computing Dr .