Transcription
Worksheets for Guiding Novices through the Visualization Design ProcessSean McKenna*Alexander Lex†Miriah Meyer‡University of UtahUniversity of UtahUniversity of UtahA BSTRACTFor visualization pedagogy, an important but challenging notion toteach is design, from making to evaluating visualization encodings,user interactions, or data visualization systems. In our previous work,we introduced the design activity framework to codify the high-levelactivities of the visualization design process. This framework hashelped structure experts’ design processes to create visualization systems, but the framework’s four activities lack a breakdown into stepswith a concrete example to help novices utilizing this framework intheir own real-world design process. To provide students with suchconcrete guidelines, we created worksheets for each design activity:understand, ideate, make, and deploy. Each worksheet presents ahigh-level summary of the activity with actionable, guided steps fora novice designer to follow. We validated the use of this frameworkand the worksheets in a graduate-level visualization course taughtat our university. For this evaluation, we surveyed the class andconducted 13 student interviews to garner qualitative, open-endedfeedback and suggestions on the worksheets. We conclude this workwith a discussion and highlight various areas for future work onimproving visualization design pedagogy.Index Terms: H.5.2 [Information Interfaces and Presentation]:User Interfaces—User-centered design1I NTRODUCTIONTo teach design in data visualization, educators combine many foundational components, from user interface principles [25] to data andencoding taxonomies [19]. Additional pedagogical materials for thefield focus on visual or perceptual principles [3, 26, 27] as a basis forcreating and judging data visualizations. Educators may also applythese principles and techniques in the classroom through the use ofdesign critiques or a cumulative project. These visualization projectscan be guided by several textbooks that expound upon different design processes [25,27] or design decision models [19] to help novicevisualization designers learn how to effectively and methodicallybuild and validate visualization systems.Many of the pedagogical approaches to the visualization designprocess, however, are theoretical in nature. From our own combined teaching experiences across 13 courses, we have witnessedstudents struggle to incorporate these theory-based design conceptsin practical, hands-on projects. As such, we believe there is a needfor new approaches to teaching the next generation of visualizationdesigners, equipping them with not just theoretical knowledge butalso the practical steps for building better systems and tools.In our previous work [15], we introduced one such theoreticalmodel of the design process with four design activities: understand,ideate, make, and deploy. Each activity includes a goal, producesa visualization artifact, and provides a plethora of design methodsto choose from. We found, however, that the theoretical framing ofthe model restricted and limited its use and actionability for novices,* e-mail:† e-mail:sean@cs.utah.edualex@sci.utah.edu‡ e-mail: miriah@cs.utah.edusuch as in the classroom or for class projects. To address theselimitations, we crafted design worksheets with steps to assist students walking through the visualization design process for the firsttime. We validate the use of these worksheets with 13 students ina graduate-level visualization course. In this paper, we present thedesign activity worksheets — concrete steps for students to walkthrough the process of designing visualizations — along with an initial evaluation of the effectiveness of these worksheets, highlightingtheir strengths and limitations.2 R ELATED W ORKFor the past few decades, pedagogy for data visualization and humancomputer interaction has begun to shift from academic or theoreticalfoundations toward including skills for design, critique, and criticalanalysis [10, 11, 20, 23]. Educators have come to realize that theymust rapidly adapt their teaching methods to the growing body ofdiverse students [6, 21], from flipped classrooms [10, 21] to onlineenvironments [2]. A recent approach among educators is to employactive learning [2, 8, 11], where techniques and methods are used toencourage deeper analysis and synthesis as opposed to just passivelyobserving a lecture [2]. Active learning can help overcome some ofthe challenges faced by educators when teaching concepts surrounding design thinking [4, 10], such as creating divergent ideas [22].For example, VizItCards [10] was created to help students practice and reinforce visualization concepts during workshops. Otheractive learning approaches include the use of data visualization exercises [14], rich discussions [5, 13], design workshops [10, 12, 29],design studios [9, 20], and design games [8].Within data visualization pedagogy, guidance for how to designdata visualizations is missing clear steps for novices. When teachingdata visualization design, educators often incorporate user interfaceprinciples [25], taxonomies of data and encoding [19], ideal visualprinciples [3, 26], perceptual principles [27], and generally empowerstudents with the ability to evaluate, criticize, and judge data visualizations. These concepts are often then applied in the classroomthrough critiques or projects [7]. Cumulative projects typically require students to acquire their own datasets, come up with ideasto visualize data for different tasks, and build an interactive, multiview visualization system. Students may conduct their own designprocess according to design models provided in textbooks [25, 27]or research papers [19, 24], but often these models are terminologyheavy, not actionable, and theoretical in nature. For students, it isoften useful to have a clear set of guidelines or instructions to walkthrough this process for the first time. However, no such step-by-stepguidance currently exists for the data visualization design process.Educators have worked on concretizing steps for the ideationprocess. Specifically, the five design-sheet methodology [22] utilizesworksheets to structure and guide visualization students through theideation process. This approach by Roberts et al. was evaluatedwith 53 students as a way to encourage engineering students tothink divergently and creatively and sketch out ideas on paper whenfirst designing a visualization. However, in a workshop at the 2016IEEE VIS Conference that used these worksheets, we experienceda limitation: many steps must occur first, such as data collection,identifying the challenge, focusing on a target user, and finding tasks.Hence, in a workshop or classroom setting, this ideation step oftenhappens too soon in the design process. Roberts et al. elude to theselimitations as preparation steps [22], but these steps can be nontrivial
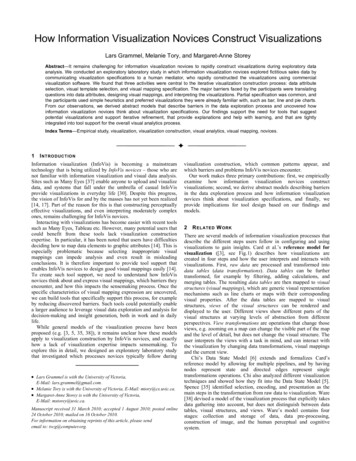
and tricky for students. Thus, it would be beneficial to establish andevaluate more worksheets beyond just ideation for data visualizationdesign pedagogy.#Understandgoal: gather, observe, and research availableinformation to find the needs of the userartifacts: design requirementsW ORKSHEETSFOR THED ESIGN ACTIVITY F RAMEWORK1 SupplementalMaterials s:2) find questions & tasksthink big! what is the problem? who is affected by it?what is known/unknown? orient yourself with all of theproject’s who, what, why, when, & how.what can you ask about the challenge? what do userswant to do with data? think high and low level. revisit thisworksheet to break these down further.!! box #3 may help you revisit this box later3) check with users or explore data4) brainstorm design requirementsusers: what did you find out? what sparked curiosity?data: characterize aspects of the data. what is it like?what are recurring trends? what are key designopportunities? are there constraints worth listing?!! get the real data and talk to real users if possible!5) compare and rank design requirementsevaluateThe first contribution of this work is the creation of design worksheets that follow the design process and decisions illustrated bythe design activity framework [15]. Here, we discuss our processbehind creating these teaching materials and provide examples oftheir use. The worksheets and teaching materials are located ona public-facing website1 for their dissemination and use by others,and we encourage feedback and improvements to these teachingmaterials by other visualization educators over time.Inspired by the five design-sheet methodology [22], we wanted tointegrate the visualization design process into visualization designworksheets to enhance the teaching of a visualization design process.Our first goal was to create a worksheet for each of the visualizationdesign activities: understand, ideate, make, and deploy. We wantedto provide example methods and tips to enable students to go througha visualization design process in its entirety. In order to create theseworksheets, we reflected on our combined 23 years of experiencecreating data visualization tools and systems.The primary author of this work coordinated the first draft ofthe worksheets, by reflecting on his own experiences learning datavisualization design in course projects and applying this designknowledge across four design studies. He was also inspired by theuse of related worksheets by a colleague running design studios inour university’s architecture and design department. As a result,he pinpointed distinct methods for generating and evaluating visualization artifacts in each design activity. When identifying thesemethods, we knew that engineering-type students could benefit fromfocusing on creating many types of visualization artifacts, so we utilized the first four steps of each activity for generation. For example,the ideate sheet uses three sketches for concept generation as in thefive design-sheet methodology [22].We iterated upon the description of these steps and methods foreach worksheet, and we presented the worksheets to our researchlab to acquire additional feedback on their level of detail and utility.From this feedback, we received recommendations to place moreof a focus on the users earlier in the process and to simplify complex, theoretical terminology, such as removing the use of the nestedmodel [17,18] in the original design. Thus, the methods described oneach worksheet were simplified and turned into a series of tangibleand generalized steps, as shown in Table 1. We also walked througha previous project [16] using the worksheets to identify further elements to add: more helper text, warning icons, expected results foreach step, and a label at the top for attachments. Lastly, we createdseveral introductory and template guides to help students fill outeach worksheet, and we include these resources in the SupplementalMaterials.We introduce the first design worksheet for the understand activityin Figure 1. At the top of each sheet, we describe the desired goaland resulting visualization artifact or outcome for the activity. Eachsheet can be numbered in the top-right for keeping track of orderand for planning and retrospection. For each worksheet’s five steps,we included additional text to help students find the answer andcomplete each box. We added warnings about when to jump back toprevious boxes or worksheets, and icons to illustrate the expectedtype of answer for each box: a list, a sketch, or a table. Lastly,the bottom-right boxes point to the next potential activities of thevisualization design process.generate31) identify the challenge & userschoose a method for comparison: pros/cons table, rank based on your findings/user needs/tasks, cross out the list basedon listed justifications, or pick top 3 to keep and why. explain and review with a group or partner.!! is this the right challenge to tackle? is there enough detail? or too much? too manyor not enough requirements? complete this worksheet again to refocus the project.UIFigure 1: Worksheet for the understand activity. We tailored thisworksheet to help students identify their problem, users, data, andrequirements for a data visualization system. Full page printouts of allfour worksheets are included in the Supplemental Materials.4E VALUATION M ETHODOLOGYBefore introducing design worksheets to students, we needed to forma basis of understanding, both in terminology and contextualized asa real-world visualization example. We created an 80-minute lectureon visualization design to teach the design activity framework [15]to 66 students in our university’s graduate-level visualization course.This model was used to help categorize visualization artifacts anddesign decisions that were contextualized within a visualizationdesign project, a cyber security visualization dashboard [16]. Byutilizing this design study, we were able to explain the design processwith actual, tangible concepts.The lecture was followed by an in-class exercise that had studentsanalyze and redesign an existing visualization using paper copies ofthe first two worksheets: understand and ideate. Additionally, wemocked up an example of how to use the design worksheets using thedesign study mentioned previously. An overview of this example isprovided in Figure 2. As part of the course, students formed groupsto complete a cumulative project: to design and build a web-basedinteractive visualization system. We recruited 13 volunteers fromthe course to complete the design worksheets for each of their sixgroup projects, mentored by the primary author of this work. Wealso include a copy of all our teaching resources and project detailsin the Supplemental Materials.The goal of this evaluation was to gain qualitative feedback on theworksheets rather than compare pedagogical effectiveness; however,we recognize a limitation of this methodology without a controlgroup. We also had a limited number of student volunteers and timeavailability from the primary author, plus smaller group sizes aremore manageable for qualitative methodologies. We were also striving to preserve fairness in the classroom, so all students had equalaccess to the volunteer opportunities, resources, and worksheets.
understandidentify the challenge & usersfind questions & taskscheck with users or explore databrainstorm design requirementscompare & rank design requirementsideateselect a design requirementsketch first ideasketch another ideasketch final ideacompare & relate your ideasmakeset an achievable goalplan encodings & layoutsplan support for interactionssketching additional viewsbuild the prototype & check-indeploypinpoint a target audiencefix usability concernsimprove points of integrationrefine the aestheticsconsider a method to evaluateTable 1: Five steps for each design activity. We break down each visualization design activity [15] into five concrete steps. The first four steps ofeach activity are generative, to establish design requirements, encoding and interaction sketches, visualization prototypes, or visualization systems.The fifth step is always evaluative, to compare different visualization artifacts in order to justify design decisions and record that reasoning downfor later use. We shared these five steps with novice visualization designers, students, using design worksheets as a template, as in Figure 1.one from each project, participated in a semistructured interviewto provide feedback on the visualization design worksheets. Theinterview questions focused on digging deeper into the survey findings. We asked open-ended questions to gather suggestions forimprovement. Lastly, we asked students to briefly describe steps ofthe visualization design process in their own words.5Figure 2: Design worksheet examples. We created exampleworksheets using linked sketches from our BubbleNet dashboardproject [16]. With this example, we taught students visualization design and showcased how a real-world, iterative design process canbe captured using the worksheets. A detailed copy of each worksheetand all sketches are included in the Supplemental Materials.For the cumulative projects, we provided the worksheets in bothpaper and digital form to all students, but only the 13 volunteerswere required to submit digital or scanned copies of their worksheetsas part of their project. One student was not part of the originalvolunteers, but due to complications with her project she reached outto the teaching staff for further help and guidance for visualizationdesign within the context of her project.To evaluate the efficacy of the worksheets in supporting the visualization design process, we collected data from three sources: afull-course survey, a focused survey on the worksheets, and interviews with student participants to elicit in-depth worksheet feedback.Additionally, the mentor met weekly with each group to providefeedback on their design process and on the worksheets. Thesemeetings provided a basis for obtaining in-person observations, inaddition to the feedback acquired anonymously through the surveysand detailed interviews. The questions and prompts we utilized areincluded in the Supplemental Materials.The full-course survey was designed to gather anonymous feedback and assess the general utility of the design worksheets forteaching the course. Specifically, we asked questions about students’ comfort level with design before and after taking the coursealong with which factors taught them how to design visualizations:lectures, in-class exercises, design worksheets, and the cumulativeproject. In the focused survey for those who used the design worksheets, we asked which worksheets worked well and which ones didnot, and why, along with 10 questions about the usefulness of theworksheets. To avoid positivity bias, these questions varied betweenpositive and negative wording.After the student projects were completed, 11 students, at leastE VALUATION R ESULTSFor the full-class survey, we received 25 responses. Twenty-three students showed an improvement in their comfort level for visualizationdesign, on average 2 out of 5 points higher by the end of the course.Students ranked these improvements based on where they learnedhow to design, which was primarily through the lectures, projects,and class exercises. The design worksheets received a significantlylarger portion of neutral responses for helping students learn, possibly because only some students used them in their projects. Wecompared the ratio of agreement to disagreement of these materialshelping students learn. The design worksheets were on the levelof other methods utilized in the course: design worksheets (13:1),lectures (23:1), exercises (20:2), and projects (18:2).For the survey sent to the students who used the visualizationworksheets, we received a total of seven responses. Overall, ideateand understand worksheets were selected (six and four students,respectively) as the most helpful design worksheets. Students statedthat the ideate worksheet helped them critique their own designs, andunderstand helped jumpstart a visualization project. As stated bystudents, ideate “is the most clear worksheet” and “critique of one’sown design was most helpful” and that both understand and ideateworksheets “helped to get the project off the ground.” On the flipside, the deploy worksheet was selected (four students) as the leasthelpful, because students often did not have sufficient time to focuson this activity. Additional feedback highlighted some drawbacksto the worksheets, such as vague terminology or phrasing, creativelimitations, and not enough structure. To uncover more information,we conducted interviews as a follow-up.During the follow-up interviews, all students described the design process using elements of the visualization design activities.Specifically, four students correctly recalled the names of each visualization design activity, but four other students were unable to recallthe deploy activity — possibly since most groups did not go throughin this activity. As in the survey, all students found the understandand ideate worksheets the most useful since they forced them toconsider different tasks, users, and ideas. Students noted that theworksheets provided a structured way to organize and compare notesabout different visualization design artifacts. Three students statedthat the worksheet example visualization project was helpful in illustrating how to use the design worksheets. Nine students followeda design process informed or exactly prescribed by the worksheets.One group acknowledged that their design process, while different,still adhered to the steps provided in each visualization design activity. Another student recognized the flexibility of the worksheets:“If I had a different project, I would use each box in different waysdepending on the context” (participant #8, or P8).
All students agreed that evaluation was a necessary and importantstep for visualization design in order to pinpoint flaws in their understanding of the problem, users, tasks, interactions, and encodings.Through evaluation, one group discovered that their project wasbetter suited to a subset of users, and another group realized thata particular encoding resulted in points overplotting. All studentsagreed that worksheets helped them document and organize theirvisualization design process. These design worksheets served as a“snapshot in time” (P1) and were sufficiently detailed to explain theirdesign process for the final project report. Eight students describedan iterative process that occurred, although informal and not writtenon any of their worksheets. Furthermore, the activities helped guidestudents as novice designers, such as one student who used the visualization design worksheets for the first time later in the course ofthe project and stated that “When I used [the] worksheets it kept mefocused on what I was doing and trying to get more ideas or more[encodings]” (P8).An intriguing finding was that four students employed the worksheets in surprisingly creative ways. For example, one student loadedthe ideate worksheet in PDF form on her tablet and zoomed in tosketch various aspects of her visualization design, allowing her toexpand and use more space for the visualization sketches. Also,another detail-oriented student transferred the design worksheetsinto textual form, listing all of the steps and hints, so that he couldbrainstorm and add detail to the problem and requirements over time,as a living document. Four students expressed frustration with thepaper worksheets because they preferred another format, whetherdigital, larger paper, or the ability to structure their notes how theywish. As one student put it, “I think the concepts are very helpfulin the worksheets . [but] for a free form thinker . if you box it inthen it is sort of restricting your creativity, as it tells you how muchyou have to fit into where” (P9). Students suggested improvementsand other feedback, which we explore next.6D ISCUSSIONTo address these restrictions mentioned by that last student, a keyimprovement recommended by five students was to convert the worksheets into a step-by-step list, the same as the steps shown in Table 1.Based on the interviews, we recommend two formats for guiding thevisualization design process: a list and worksheets. The worksheetsprovide structure, “it’s like a checklist to make sure everything iscovered” (P11), but they also limited free-form thinkers: “if youhave a lot of things on your mind, you won’t fit everything in thebox anyways” (P6). Some visualization designers recommend paperfor sketching [22], but others in the design community argue digitalsketching can have functional benefits, such as shapes, undo, layers, duplication, and manipulation of details through zooming [28],which two students utilized and felt was vital to their visualizationdesign process. An intriguing suggestion was to transform the worksheets into an app: “a clickable, interactive worksheet, where youclick on this [and] it will connect you with the other worksheet andhave a screenshot” (P8).Students also suggested adding more worksheets to the materials.Six students felt that “those [four] activities frame the processwell” (P2). However, two students brought up a crucial aspect ofevaluation and feedback: that it might be worthwhile to devote awhole worksheet for evaluation, otherwise “If you have it on theother worksheets, [evaluation] doesn’t seem to have as much value”(P10). Four students requested a visualization design worksheet tohelp probe into and explore the dataset or datasets that a group maywant to visualize. By providing guidance, steps, and questions onaspects of the dataset, potential issues with visualizing the datasetcould be avoided later, and such issues occurred in three studentprojects. Lastly, three students requested a visualization designworksheet on how to structure the code of a visualization system,particularly in the case of one group with no computer sciencebackground. Such a resource would help students brainstorm onhow to structure classes in their code, especially for building datavisualization systems.Furthermore, some minor tweaks can be made to improve thevisualization design worksheets. Five students noted that having agood student example of the worksheets would have helped defineclear expectations for their work. We also received recommendationsto use a date-field rather than a blank number-field to encouragestudents to simply organize their group worksheets over time asthe numbers were not often used and harder to coordinate amonggroup members. Students also suggested that each worksheet use adate-field rather than a blank number-field to more easily coordinatework as a team. Most students did not understand or use the helpertext, result icons, and warning tips, so these should be clarified andrevisited in future work.Nevertheless, the design worksheets helped guide studentsthrough actionable steps for visualization design and facilitatedeffective discussions both within a group and with their mentor. Asstudents highlighted: “you break down the process into those clearsteps. an intuitive flow” (P2), and: “this was really good guidancefor us . well categorized for the beginner” (P3), and: “I didn’tknow where to start. It was nice to have steps along the way” (P4),and the benefit of generating ideas: “we considered more optionsthan we would have” (P1). Despite the many improvements that canbe made, we emphasize that the worksheets provided benefit to students, and a variety of future work could measure this success morerigorously and compare how usable and effective these worksheetsare for students learning the visualization design process.7C ONCLUSION & F UTURE W ORKIn this paper, we have introduced design worksheets to guide andteach novices the process of designing a visualization system. Theseworksheets were designed to simplify the theoretical concepts ofthe design activity framework [15]. We include all of the materialswe used to teach these concepts to 66 students in a graduate-levelvisualization course. We evaluated the use of the design activitiesand worksheets through surveys and interviews with 13 students.The results highlight what worked well and what could be improvedon these design worksheets going forward. Lastly, we summarizedthese improvements and areas for future work on teaching visualization design to novices.These design worksheets are one possible step toward buildingmore effective teaching tools for data visualization and design, butplenty of work lies ahead. One clear area for future work involvesmaterials for design inspiration: from visualization encodings toabstractions to tasks. Initial work shared by He and Adar in VizitCards [10] is a step in this direction, and we encourage the community to continue this line of work. While one student used VizItcards, she would have liked to see the cards generalized for othervisualization challenges. Furthermore, the design process steps andguidance can always be improved to be more descriptive, moreclear, sufficiently succinct, and encompass other design methodsand methodologies. Other common methods for teaching are designstudios [10] and exercises [1], and it would be worthwhile to adaptdesign worksheets for these settings.ACKNOWLEDGMENTSWe thank the Visualization Design Lab and Professor James Agutterat the University of Utah for their feedback on this work. We wouldalso like to thank the students of the Data Visualization course(Fall 2016), especially the volunteers who worked with us on theworksheets, without whom this work would not have been possible.This work is sponsored in part by the Air Force Research Laboratoryand the DARPA XDATA program.
R EFERENCES[1] E. Bertini. Teaching — Information Visualization. http://enrico.bertini.io/teaching/, 2017. Accessed: 2017-02-03.[2] J. Beyer, H. Strobelt, M. Oppermann, L. Deslauriers, and H. Pfister.Teaching visualization for large and diverse classes on campus andonline. In Pedagogy Data Visualization, IEEE VIS Workshop, 2016.[3] A. Cairo. The Functional Art: An introduction to information graphicsand visualization. New Riders, 2012.[4] K. Cennamo, S. A. Douglas, M. Vernon, C. Brandt, B. Scott, Y. Reimer,and M. McGrath. Promoting creativity in the computer science designstudio. In Proceedings of the 42nd ACM technical symposium onComputer science education - SIGCSE ’11, p. 649. ACM Press, NewYork, New York, USA, 2011. doi: 10.1145/1953163.1953344[5] B. Craft, R.-m. Emerson, and T. J. Scott. Using pedagogic design patterns for teaching and learning information visualization. In PedagogyData Visualization, IEEE VIS Workshop, 2016.[6] G. Domik. A data visualization course at the university of paderborn.In Pedagogy Data Visualization, IEEE VIS Workshop, 2016.[7] M. Eggermont, C. Perin, B. Aseniero, and R. Fallah. Leveragingbiological inspirati
For visualization pedagogy, an important but challenging notion to teach is design, from making to evaluating visualization encodings, user interactions, or data visualization systems. In our previous work, we introduced the design activity framework to codify the high-level activities of the visualization design process. This framework has