Transcription
Welcome
#TC18The Science of Data VisualizationLarry SilversteinStrategic Sales ConsultantTableau
Start Your (Visualization) Engines
AgendaThe science of data visualizationBest practices for building dashboards and visualizations
The Science ofData Visualization
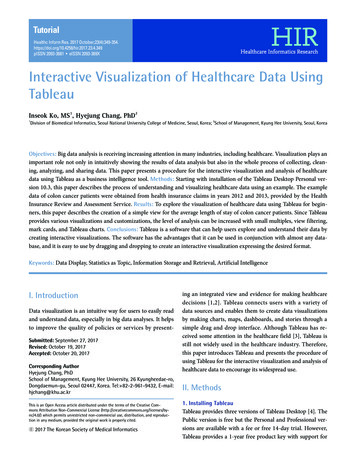
Share of Worldwide Urban Population Growth2010–2050
Share of Worldwide Urban Population Growth2010–2050
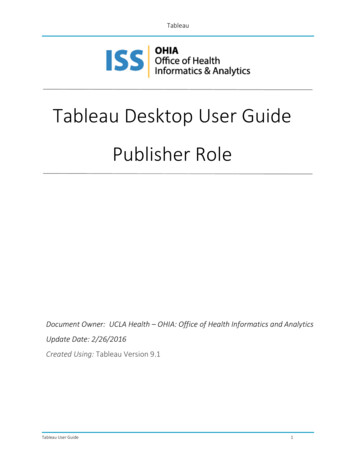
89
55.7386.89ValueMean of x in each case9 (exact)Variance of x in each case11 (exact)Mean of y in each case7.50 (to 2 decimal places)Variance of y in each case4.122 or 4.127 (to 3 decimalplaces)Correlation between x andyin each case0.816 (to 3 decimal places)Linear regression line ineach casey 3.00 0.500x (to 2 and 3decimal places, respectively)
Thinking is Slow. Seeing is FAST.CerebralCortexThinkingVisualCortexSeeing
Preattentive Attributes
Memory LimitsHave we gained or lost customers over the last 4 years?Which city has grown the fastest?Total # of Registered Customers2009201020112012New 390AustinTotal3614825855951550176717871779
Visual Representation vs. TableHow do each of our locations compare?
Memory Limits16 Numbers4 Patterns
Overcoming Memory LimitsUse familiar chart typesDon’t make people remember viewsAvoid large legendsUse intuitive colors and shapes
Familiar Chart Type? Intuitive Encoding?
Familiar Chart Type? Intuitive Encoding?
Familiar Chart Type. Intuitive Encoding.
Visual Interruptions Make People Slow
Visual Interruptions Make People Slow
Color, Data Types, ChartTypes and Layouts
Best Practices for Color
Color Vision Deficiency (CVD)
Bars and Colors—Caution!Be thoughtful when applying color to bars
Bars and Colors—Caution!Be thoughtful when applying color to barsThis is OK
Color PerceptionColor perception is relative, not absolute
Color PerceptionProvide a consistent background
Too Many ColorsHumans can only distinguish 8 colorsThis is not helpful.
Right Number of ColorsHumans can only distinguish 8 colorsThis is helpful.
Types of DataQualitative (nominal)Arizona, New York, TexasSarah, John, MariaCoors, Bud Light, Stella ArtoisQualitative (ordinal)Gold, silver, bronzeExcellent health, good health, poor healthLove it, like it, hate itQuantitativeWeight (10 lbs, 20 lbs, 5000 lbs)Cost ( 50, 100, 0.05)Discount (5%, 10%, 12.8%)
How Do Humans Like Their Data?PositionMore importantColorSizeShapeLess important
1. Position
1. Position
What Goes Where?EmphasizedNeither emphasizednor de-emphasizedEmphasizedNeither emphasizednor de-emphasizedDe-emphasized
What Goes Where? Research re-72395
Best Practices forBuilding Dashboardsand Visualizations
Tables
Graphs Tables for Spotting Trends
Chart Type GeneralizationsTime: on an x-axisLocation: on a mapComparing values: bar chartExploring relationships: scatter plotRelative proportions: treemap
ShowMe: Visual Best Practices - Automatically
Pies vs. Bars (An Unfair Fight, IMO)
A Tip for Using Stacked Bars
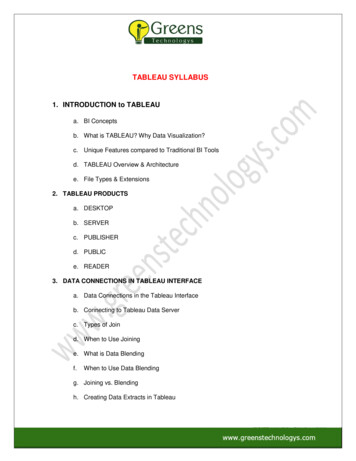
Bullet Chart GaugesBackground fill colors that encode qualitative ranges like bad,satisfactory and goodQuantitative ScaleText LabelBar that encodes theperformance measureSymbol marker that encodes thecomparative measure
Bars vs. LinesUse line graphs to encode trends over time
Avoid Food Graphs
Tastier Solutions—Part 1
Tastier Solutions—Part 1
Tastier Solutions—Part 2
Tastier Solutions—Part 2
Tastier Solutions—Part 3
Tastier Solutions—Part 3
Making a Point—About Lines
Making a Point—About Lines
Making a Point—About Lines
Be Careful Using Dual s
3D?!? Make Mine Small Multiples!
Mapping to InsightUse maps when location is relevant
“Choropleth” Maps
“Choropleth” Maps
Symbol Maps
A Strike Zone is a Map?!?
Tell the Truth!
So This Is What Really Happened
Sometimes, the Default isn’t Best
Experiment—You Won’t “Break” your Data
Let’s Talk About Dashboards
Are All Dashboards the Same?
20-look-at-our-participation.html
Iraq: Deaths on the lofiej-20-look-at-our-participation.html
Which One to Use?
The Same GoalsMake better, datadriven decisionsMake changes forthe better
The 5 Second Test
Dashboarding for the 5 Second TestMost important view goes ontop or top-leftLegends go near their viewsAvoid using multiple colorschemes on a singledashboardUse 5 views or fewer indashboardsProvide interactivity
Dashboarding for the 5 Second TestUse your words!TitlesAxes & UnitsKey facts and figuresRemove extra digitsin numbersGreat tooltips
Dashboarding for the 5 Second Test
Dashboarding for the 5 Second Test
Is Beautiful Design Important?
Recommended irtual?course 2346
#TC18Thank you!Larry Silversteinlsilverstein@tableau.com
Please complete thesession survey from the MyEvaluations menuin your TC18 app
The Science of Data Visualization #TC18 . Tableau. Start Your (Visualization) Engines. Agenda The science of data visualization Best practices for building dashboards and visualizations. The Science of Data Visualization. Share of Worldwide Urban Population Growth