Transcription
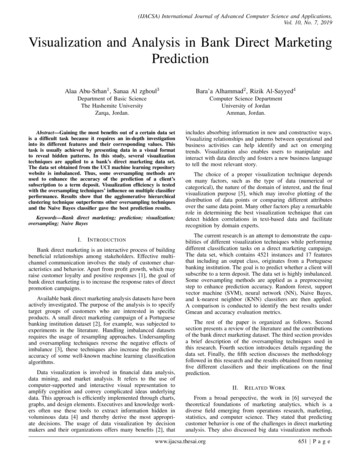
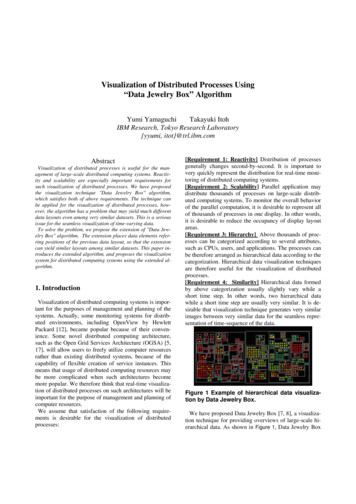
Visualization of Distributed Processes Using“Data Jewelry Box” AlgorithmYumi YamaguchiTakayuki ItohIBM Research, Tokyo Research Laboratory{yyumi, itot}@trl.ibm.comAbstractVisualization of distributed processes is useful for the management of large-scale distributed computing systems. Reactivity and scalability are especially important requirements forsuch visualization of distributed processes. We have proposedthe visualization technique "Data Jewelry Box" algorithm,which satisfies both of above requirements. The technique canbe applied for the visualization of distributed processes, however, the algorithm has a problem that may yield much differentdata layouts even among very similar datasets. This is a seriousissue for the seamless visualization of time-varying data.To solve the problem, we propose the extension of "Data Jewelry Box" algorithm. The extension places data elements referring positions of the previous data layout, so that the extensioncan yield similar layouts among similar datasets. This paper introduces the extended algorithm, and proposes the visualizationsystem for distributed computing systems using the extended algorithm.1. IntroductionVisualization of distributed computing systems is important for the purposes of management and planning of thesystems. Actually, some monitoring systems for distributed environments, including OpenView by HewlettPackard [12], became popular because of their convenience. Some novel distributed computing architecture,such as the Open Grid Services Architecture (OGSA) [5,17], will allow users to freely utilize computer resourcesrather than existing distributed systems, because of thecapability of flexible creation of service instances. Thismeans that usage of distributed computing resources maybe more complicated when such architectures becomemore popular. We therefore think that real-time visualization of distributed processes on such architectures will beimportant for the purpose of management and planning ofcomputer resources.We assume that satisfaction of the following requirements is desirable for the visualization of distributedprocesses:[Requirement 1: Reactivity] Distribution of processesgenerally changes second-by-second. It is important tovery quickly represent the distribution for real-time monitoring of distributed computing systems.[Requirement 2: Scalability] Parallel application maydistribute thousands of processes on large-scale distributed computing systems. To monitor the overall behaviorof the parallel computation, it is desirable to represent allof thousands of processes in one display. In other words,it is desirable to reduce the occupancy of display layoutareas.[Requirement 3: Hierarchy] Above thousands of processes can be categorized according to several attributes,such as CPUs, users, and applications. The processes canbe therefore arranged as hierarchical data according to thecategorization. Hierarchical data visualization techniquesare therefore useful for the visualization of distributedprocesses.[Requirement 4: Similarity] Hierarchical data formedby above categorization usually slightly vary while ashort time step. In other words, two hierarchical datawhile a short time step are usually very similar. It is desirable that visualization technique generates very similarimages between very similar data for the seamless representation of time-sequence of the data.Figure 1 Example of hierarchical data visualization by Data Jewelry Box.We have proposed Data Jewelry Box [7, 8], a visualization technique for providing overviews of large-scale hierarchical data. As shown in Figure 1, Data Jewelry Box
represents hierarchical data as nested rectangles. It represents leaf-nodes as icons, and non-leaf-nodes as nestedrectangular borders. The technique satisfies requirements1, 2, and 3, since it calculates display layout of thousandsof nested nodes in one second or so. However, it has abottleneck for requirement 4, since it sometimes yieldsvery different display layout results among very similardatasets.This paper proposes an extension of Data Jewelry Boxalgorithm [19] that improves the similarity among timeseries data. Given the display layout of previous data, itcalculates positions of icons and rectangular borders in anormalized coordinate. Let us call the table of the positions “template.” By referring the template, the extensioncalculates similar display layout for a similar data. It isespecially useful for seamless representation of slightlytime-varying hierarchical data.This paper also presents an implementation of the visualization of distributed processes using the extension ofData Jewelry Box algorithm. The implementation supposes that a client application first has a set of processes,and then sends all the processes to a service working on aserver. We call this service the “portal” in this paper. Receiving the set of processes, the parent server creates several service instances and assigns the processes to the instances. After performing the processes, the instances return the results of the processes to the portal. Finally, theportal returns the collection of results to the client application. During this procedure, the portal manages thestatus of all the processes, and constructs a hierarchicaldata structure consisting of all of the processes. The implementation frequently updates the hierarchical data, andData Jewelry Box algorithm frequently renders the dataas Scalable Vector Graphics (SVG) image files.In this paper we used a parallel meshing system as theapplication of the presented visualization technique.Meshing is a geometric technique that finely divides inputgeometric regions into small pieces of triangular or quadrilateral elements. Large-scale manufacturing productsusually consist of hundreds or thousands of mechanicalparts, and it is often necessary to mesh the geometries ofsuch enormous numbers of parts. Parallelization of themeshing process is therefore important in such productmanufacturing fields. We implemented the meshing system under OGSA, and monitor the meshing processes byusing our visualization technique.2. Related work2.1 Distributed processes on Open Grid ServicesArchitectureVisualization of distributed processes presented in thispaper has been implemented on OGSA [5, 17], which isthe novel architecture that integrates Grid Computingtechnologies by combining Web Services mechanisms.Grid Computing is a distributed computing infrastructurethat enables transparent access to and sharing of heterogeneous computing resources and software componentsacross distributed users and environments. Reference [4]defined properties of key connectivity, resource, and collective protocols to realize these features of Grid Computing. Web Services is a framework that enables remoteand automatic execution of software components via theInternet. OGSA enables the flexible utilization of computing resources of Grid infrastructure by applying interfaces similar to Web Services. Here, OGSA defines theopen software components as “Grid service,” and transiently working software components as “Grid service instances.” OGSA has been proposed to provide mechanisms for registering and discovering Grid Services, andfor creating and executing Grid service instances.A typical scenario using OGSA is as follows: Factoryservices for creating Grid service instances are first deployed on Web servers. Programs call the factory servicesto create the instances, and then call functions of the created instances to execute the target services.The above mechanism allows software developers toflexibly control securities and manage distributed computer resources rather than the earlier Grid technologies.In the other word, it is possible that usage of computer resources and software services will be more complicated,because the service instances can be freely created on arbitrary computer resources. Behavior of systems may often be very different from what system engineers expected, and therefore monitoring of the systems will beimportant. That is the main reason why we are focusingon the visualization of distributed processes on OGSA.2.2 Existing hierarchical data visualization methodsHierarchical data visualization is a hot topic in visualization research, and actually many techniques have been recently presented.Tree representation is the most popular hierarchicaldata visualization technique, used in many programs suchas famous file system viewers. Several variations, such asthe Hyperbolic Tree [11], Cone Tree [3], and FractalViews [10], have been described for the interactive visualization of large-scale hierarchical data sets. It is alsosuitable for visualizing the connectivity among nodes.Carriere et al. represented all parts of large-scale hierarchical data by Cone Tree in [3]. It provides a good overview of large-scale data; however, their result containssparse regions.
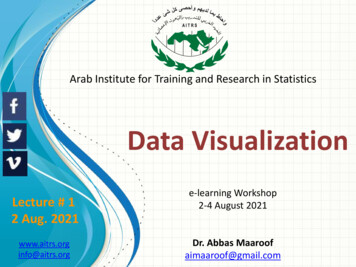
Treemap [9], which represents hierarchical data in amanner like nested column charts, is a well-known spacefilling approach for hierarchical data visualization. Thespace-filling approach is especially useful for the representation of statistics, and overview of the data in compact display spaces. However, it has shape-related limitations of leaf-nodes. Squarified Treemap [2] and OrderedTreemap [15] improved the shapes of rectangular subregions, but still they do not guarantee their aspect ratios.Quantum Treemap and Bubblemaps [1] were recentlyproposed for the layout of icons or thumbnails whenthose aspect ratios are fixed. Ordered Treemap alsoclaims the seamlessness of the representation timevarying data, however, still it often yields much differentlayout results among the time-series data in some parts.Against authors propose techniques for representinghierarchical data as 2D nested structures, but 3D nestedstructures have been applied in some techniques. Information cubes [13] is a 3D hierarchical data visualizationapproach, which positions data in nested semitransparenthexahedrons. H-BLOBS [16] is also a 3D hierarchicaldata visualization approach, positioning data in nestedsemitransparent isosurfaces.3. Extension of Data Jewelry Boxlevel toward the highest level, the algorithm places all ofthe data onto the layout area.Figure 2 Order of the placing rectangles to represent the hierarchical data. Numbers in this figure denote the order of the process.Here, one non-leaf-node connects to several childrennodes. They are represented as rectangular icons or borders, and should be packed inside a rectangular border.To calculate their positions, the algorithm places a set ofrectangles one-by-one, while it satisfies the following twoconditions:[Condition 1] Rectangles must be placed without overlapping each other.[Condition 2] Rectangles should be placed where thelayout area occupied by the rectangles is minimized.This section presents our hierarchical data visualizationtechnique “Data Jewelry Box.” First part of the sectionintroduces the overview of “Data Jewelry Box,” and thenproposes its extension for seamless representation oftime-varying data.3.1 Data Jewelry Box: A hierarchical data visualization techniqueAuthors have proposed a hierarchical data visualizationtechnique “Data Jewelry Box,” especially useful for interactively providing overviews of large-scale data [7, 8].As shown in Figure 1, our technique represents the hierarchy of input data as nested rectangles. In this figurepainted dots denote leaf nodes, and gray rectangular borders denote non-leaf nodes. Bigger borders denotehigher-levels of the hierarchy, and smaller ones denotelower-levels. Remark that the name of the technique justdenotes the concept, and does not target photo-realisticrepresentation of jewelry box itself.Figure 2 shows an illustration of the order of data layoutin our technique. Our algorithm first packs icons (paintedsquare dots in Figure 2) that denote leaf nodes, and thengenerates rectangles that enclose the icons to denote nonleaf nodes. Similarly, it packs a set of rectangles that belong to higher levels, and generates the larger rectanglesthat enclose them. Repeating the process from the lowestFigure 3 Illustration of the rectangle packing algorithm.The above placement is somewhat similar to packingproblem, which is a famous computational geometryproblem, and has been applied to various industry fields,such as VLSI circuit, paper patterns for clothes, and cutting pattern of sheet metals for mechanical parts. Many ofthese problems apply optimization schemes for the minimization of layout areas; however, our algorithm favorsaccelerating the rectangle packing process rather than entirely minimizing the layout space. We therefore did notapply optimization schemes to find the configuration ofrectangles. Our algorithm sorts the rectangles accordingto their areas, and places them on a display space in thesorted order, as shown in Figure 3. Here the algorithmused a heuristic to quickly find gaps and place the re-
maining rectangles in the gaps. The heuristic uses a triangular mesh connecting centers of previously placed rectangles.The algorithm refers to triangles in the order of theirsizes, and generates several sampling points inside thetriangles for the trial placement of a rectangle. If the rectangle can be place without overlapping any previouslyplaced rectangles at one of the sampling points and extending the display area, the algorithm decides to placethe rectangle there. If there is no point that the rectanglecan be placed without extending the display area, the algorithm decides to place the rectangle where the extension of layout area is the smallest and no overlap is happen. References [7, 8] describe the algorithm in detail.3.2 Proposed extension of Data Jewelry Box forvisualization of time-varying dataFigure 4 shows the concept of the extension of DataJewelry Box algorithm. The extension uses “templates,”which describe positions of nodes of hierarchical data atthe previous time step in a normalized coordinate. Giventhe next hierarchical data, the extension refers the template while it calculates positions of nodes of the data, sothat they are placed as similar as the previous data. Positions of previous data are translated into a normalized coordinate so that all positions are within (-1,-1) to (1,1),since the size of layout area usually changes even if thenext data is very similar to the previous data.3.2.1 Order of placing rectangles. Against original DataJewelry Box places rectangles in the order of their area,as shown in Figure 5(left), the extension places as the following order:(1) The largest rectangle is first placed.(2) Other rectangles are placed one-by-one, in the orderof closeness to the largest rectangle, which are calculated from positions described in a template.The above “adjacency-based order” prevents to yield unnecessary gaps each other.3.2.2 Order of referring triangles. Against original DataJewelry Box refers triangles in the order of their area, asshown in Figure 5(right), the extension refers them in theorder of distances to the position of currently placing rectangle described in a template. The order accelerates thediscovery of adequate position of the rectangle. Our implementation generates sample points on the lines connecting vertices and edges of the triangle, and where currently placing rectangle can touch with previously placedrectangle without yielding unnecessary gaps. Detail is described in reference [19].Figure 5 The extended Data Jewelry Box algorithm. (Left) Order of placing rectangles. (Right)Order of referring triangles.Figure 4 Concept of the extension of “Data Jewelry Box.”In addition to two conditions described in Section 3.1,the extension applies one more condition:[Condition 3] Rectangles should be placed where it isenough close to the position described in the given template.The extension places rectangles under the three conditions. Similar to the original Data Jewelry Box algorithm,the extension places given rectangles one-by-one. Whilethe trial placement of a rectangle, it refers triangles oneby-one, and generates sampling points inside each triangle. Follows are the procedure of placing rectangles bythe extension. Reference [19] describes the algorithm indetail.3.2.3 Evaluation of sampling points. While the trialplacement of a rectangle at a sampling point, the extension decides that:(1) If the rectangle overlaps with at least one of previously placed rectangles, the rectangle never be placedthere.(2) Otherwise, the extension calculates the value aD bS,where a and b are user-defined constant values, D is thedistance between the sampling point in the normalizedcoordinate and the position of the rectangle described inthe template, and S is the layout area after the placementof the rectangle. After trying the placement with samplingpoints, the extension decides to place the rectangle whereaD bS is minimum.
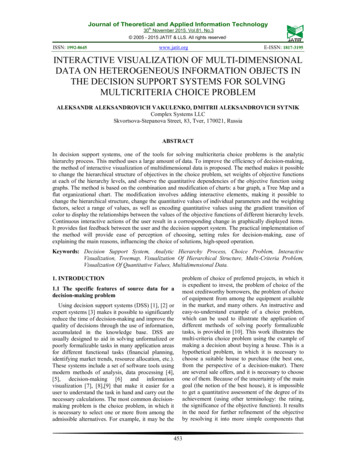
Generally aD bS values increase while referring triangles in the above order. It means that the extension canskip many of distant triangles to refer.Figure 7 Architecture of visualization of distributed processes on OGSA.Figure 6 Example of display layout by the original and the extended Data Jewelry Box algorithm. (Left) A result for the data at the previoustime step. (Right) Two results for the data at thenext time step.3.2.4 Example. Figure 6 shows the example of hierarchical data visualization by the original and extended DataJewelry Box algorithm. Left image represents the data atthe previous time step, and right two images represent thedata at the next time step. The next data is very similar tothe previous data, except just two nodes are added fromthe previous data. The original algorithm calculates thedisplay layout without referring the result for the previousdata, and consequently it may yield much different layoutthough the two data is quite similar. The extended algorithm refers the layout for previous data as a template,and yields very similar layout for the next data.4. Visualization of distributed processes byextended Data Jewelry BoxThis section describes the implementation of and experiments with the visualization of distributed processes.We implemented it on OGSA. First part of the section describes the architecture of our implementation. Next partdescribes about the parallel meshing system, an application we executed on the architecture. Final part describessome examples and results.4.1 Architecture of the visualization of distributed processesFigure 7 shows the architecture of our implementation.The client program first creates the application portal instance and sends a set of processes to the portal instance.The portal instance then creates several application instances on several servers, and sends the processes to theapplication instances. The portal instance also creates thevisualization instance on a Web server, and sends theURL of the image of the visualization results to the clientprogram. The portal instance manages the status of theprocesses running the application instances, and frequently sends the status of the processes to the visualization instance. The visualization instance also frequentlygenerates images of the visualization results. Our implementation generates the images in the scalable vectorgraphics (SVG) format so that users can display them onWeb browsers.The features of the architecture are as follows:[Simple client programming] In this implementation aclient program just sends all of the processes to a singleportal instance and receives all the results from the portalinstance. It does not need to consider the parallelization.[Remote process monitoring] Since the visualization instance outputs SVG format images, the distribution andstatus of the processes can be monitored from anywhere,since the client is reachable by the Web server on whichthe instance is running.[Independence of visualization instance] Since thevisualization instance is separated from the applicationinstances, it can easily be used for a variety of other applications.
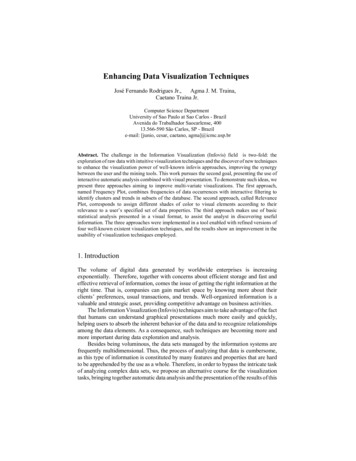
Figure 8 Data structure for the visualization ofdistributed processes.Currently, our implementation simply classifies processes into “assigned process” and “unassigned process,”and again classifies the assigned processes according tothe instances which processes are assigned. The relationships between the processes have hierarchical form andtherefore this data can be the input data for Data JewelryBox. Figure 8 shows the data structure of processes forthe visualization.4.2 Application: Parallel Meshing SystemWe applied meshing technique as an application of thevisualization of distributed processes. Meshing is a geometric technique to finely divide input geometric regionsinto small pieces of triangular or quadrilateral elements. Itis mainly used for Computer Graphics (CG), ComputerAided Design (CAD), and Computer Aided Engineering(CAE). Figure 9 shows an example of meshes used inCAE.of meshing procedures; however, its computation costmay be a bottleneck. The input geometry shown in Figure9 consists of hundreds of curved surfaces, and our implementation needs several minutes to generate mesh allthe surfaces by a PC with 1GHz CPU. In the designanalysis phase for large manufactured products such asautomobiles, airplanes, and electric generators hundredsor thousands of mechanical parts are often meshed at thesame time. If the above physically-based meshing technique is applied to the CAD models of such large products, it will take about one day to mesh all the mechanicalparts using one CPU. Parallelization of the automatedmeshing techniques is therefore important for time efficient analysis.We implemented the physically-based meshing technique as application instances shown in Figure 7. In ourimplementation the client program sends a set of geometric data to the portal service, and receives the meshing results from the service. The portal service sends the geometric data to meshing service instances one-by-one, andreceives the meshing results from the instances. Here, webelieve that the computation times of meshing parts areestimated by a function of number of vertices, and totalcomputation time is approximately minimized by sendingthe parts in the order of the estimated computation time ofeach part. Our implementation roughly forecasts the number of vertices N v before the meshing process begins.The implementation calculates N v A / l 2 , where A isthe area of a part is, and l is the expected length of edgesof the output mesh. After sorting all the parts according toN v , our implementation sends the parts to the meshinginstances in the sorted order.4.3 ExampleFigure 9 Examples of meshes. (Left) Input geometry. (Right) Output quadrilateral mesh. (copied from reference [6].)Computational dynamics approach used in CAE is verysensitive to the results of meshing. To obtain adequate solutions in a reasonable computation time, the density anddirectionality of meshes should be controlled properly,and the shapes of elements should be nearly equi-angle.Due to the difficulties of these requirements, the automation of the meshing process is complicated.One of the authors has proposed physically-based meshing techniques that automate the meshing process [14,18]. The techniques have realized nearly-full automationFigure 10 shows an example of 6 snapshots of the visualization. The example represents processes as bars, andtheir classifications by gray borders. The client programsends 80 mechanical parts to the portal instance, and the80 processes are assigned to 4 meshing instances. Thecurrent implementation of the visualization instance refreshes the image every 10 seconds. It is possible to refresh the image more frequently, but every 10 seconds ismost comfortable on our environment because our currentSVG viewer often refreshes the image slowly. It simplycolors the bars according to the classifications, and calculates heights according to the computation times. Theblue bars at the left denote unassigned processes, andother bars on the right side denote assigned processes.The snapshots show that processes are gradually assignedto the 4 meshing instances. They also represent howmany processes each instances has, and how much com-
putation time each process takes. Layouts among thesnapshots are very similar by the effort of the extendedalgorithm.Figure 11 Extended architecture for visualization of processes sent from multi clients.Figure 10 Example of visualization of distributedprocesses.4.4 Extension for multiple clientsSection 4.1 described the architecture for the visualization of processes sent from a single client. This sectiondescribes the extension of the architecture for the visualization of processes sent from multi clients.Figure 11 shows the overview of the extended architecture. The scenario of this architecture is as follows: First,clients send requests to the parent portal service with theID or name of the application they want to run. Receivinga request from a client, the parent portal creates an instance of specified application portal, and returns theURL of the visualization results image to the client. Theapplications portal then creates several application instances, and distributes the processes into the instance.The application portal also sends the status of their processes to the visualization instance. The visualization instance frequently generates images of the status visualization, and the clients frequently access the images to monitor the processes of the whole distributed computing environment. Also, processes can be categorized accordingto user-specified attributes, such as users, servers, instances, applications, so the visualization instance canprovide various views for various purposes of the processvisualization. This extension will help system designersoptimize the configurations of distributed systems, andhelp application users to effectively utilize the computation resources.Figure 12 Example of visualization of processessent from 4 clients.Figure 12 shows an example of visualization of processes by the extended architecture. In this example 4 clients send sets of processes, and they are distributed to 4instances. Colors of bars denote clients, and heights ofbars denote the computation time. Bars in the lower partof the figure denote unassigned processes. Bars in the upper part are divided into four rectangular regions whichrepresent instances. This figure denotes that the blue client has sent the most number of processes, and the number of remaining processes is also the largest. The red client has sent the least number of processes, but its eachprocess is somewhat heavy. Load balance between 4 instances does not look even, so system designers shouldthink of utilization of computer resources.5. Conclusion
This paper proposed the extension of Data Jewelry Boxalgorithm for seamless representation of time-varying hierarchical data. The extension uses “templates,” whichdescribes positions of nodes of hierarchical data at theprevious time step. By referring the templates the extension calculates very similar display layout of hierarchicaldata at the next time step.This paper also presented architecture of visualization ofdistributed processes using the extended Data JewelryBox algorithm. We implemented the architecture onOGSA, and used a parallel meshing as an application ofthe visualization technique. This paper showed examplesof the visualization.This work is still prototype level, and we are thinking ofthe following future topics:[Experiments of scalability] Presented visualizationtechnique can provide a representation of large-scale anddeeply-nested hierarchical data that includes thousands ofleaf nodes. We would like to confirm the scalability ofthe visualization with thousands of processes in a real distributed computing environment.[Improvement of packing algorithm] Minimization oflayout areas is important for scalability of the visualization technique, but examples of extended algorithm,shown in Figure 11 and Figure 13, do not look nearlyminimize the areas. It is a complicated problem to satisfyboth scalability and similarity, and its improvementshould be a future discussion.[Variety of representations] Our implementation simply classifies processes according to instances, colors thebars according to classifications, and calculates heightsaccording to the computation times. However, other kindsof criteria, such as usage of memory and disk space,could be applied to the classification of processes and thecalculations of colors and heights. Also, the current implementation represents processes as bars, but other dataelements, such as users, CPUs, or disks, could be represented. We would like to study what kinds of representations are useful for the monitoring of distributed computing systems.References[1] Bederson B., PhotoMesa: a zoomable image browser usingquantum treemaps and bubblemaps, UIST 2001, pp. 71-80,2001.[2] Bruls D.M., Huizing K., Wijk J. J., Squarified Treemaps,Data Visualization 2000 (joint Eurographics and IEEE TCVGSymposium on Visualization), pp. 33-42, 2000.[3] Carriere J., Kazman R., Research Paper: Interacting withHuge Hierarchies beyond Cone Trees, IEEE Information Visualization ’95, pp. 74-81, 1995.[4] Foster I., Kesselman C., Tuecke S., The Anatomy of theGrid: Enabling Scalable Virtual Organizations, InternationalJournal of High Performance Computing Applications, Vol. 15,No. 3, pp. 200-222, 2001.[5] Foster I., Kesselman C., Mick J. M., Tuecke S., The Physiology of the Grid: An Open Grid Services Architecture for g/research/papers.html.[6] Inoue K., Itoh T., Yamada A., Furuhata T., and Shimada K.,Face Clustering of a Large-scale CAD Model for Surface MeshGeneration, Computer-Aided Design, Vol. 33, No 3., pp. 251261, 2001.[7] Itoh T., Kajinaga Y., Ikehata Y., Yamaguchi Y., Data Jewelry Box: A Graphics Showcase for Large-Scale HierarchicalData Visualization
2.2 Existing hierarchical data visualization meth-ods Hierarchical data visualization is a hot topic in visualiza-tion research, and actually many techniques have been re-cently presented. Tree representation is the most popular hierarchical data visualization technique, used in many programs such as famous file system viewers.