Transcription
Image description. Cover Image End of image description.What Is IPEDS?The Integrated Postsecondary Education DataSystem (IPEDS) is a system of survey componentsthat collects data from all institutions that providepostsecondary education and are eligible to receiveTitle IV funding across the United States and otherU.S. jurisdictions.These data are used at the federal and state level forpolicy analysis and development; at the institutionallevel for benchmarking and peer analysis; and bystudents and parents, through the College Navigator(https://nces.ed.gov/collegenavigator/), an online toolto aid in the college search process. Additionalinformation about IPEDS can be found on thewebsite at https://nces.ed.gov/ipeds.What Is the Purpose of This Report?The Data Feedback Report is intended to provideinstitutions a context for examining the data theysubmitted to IPEDS. The purpose of this report is toprovide institutional executives a useful resource andto help improve the quality and comparability ofIPEDS data.What Is in This Report?The figures in this report provide a selection ofindicators for your institution to compare with a groupof similar institutions. The figures draw from the datacollected during the 2020-21 IPEDS collection cycleand are the most recent data available. The insidecover of this report lists the pre-selected comparisongroup of institutions and the criteria used for theirselection. The Methodological Notes at the end of thereport describe additional information about theseindicators and the pre-selected comparison group.Where Can I Do More with IPEDS Data?Each institution can access previously released DataFeedback Reports from 2005 and customize this2021 report by using a different comparison groupand IPEDS variables of its choosing. To learn how tocustomize the 2021 report, visit this resource pagehttps://nces.ed.gov/Ipeds/Help/View/2. To downloadarchived reports or customize the current DataFeedback Report, visit the ‘Use the Data’ portal onthe IPEDS website https://nces.ed.gov/ipeds andclick on Data Feedback Report.Barton CollegeWilson, NC
Barton CollegeCOMPARISON GROUPComparison group data are included to provide a context for interpreting your institution’s indicators. If your institution did not define a customcomparison group for this report by July 15, 2021 NCES selected a comparison group for you. (In this case, the characteristics used to definethe comparison group appears below.) The customized Data Feedback Report function available at https://nces.ed.gov/ipeds/use-the-data/can be used to reproduce the figures in this report using different peer groups.The custom comparison group chosen by Barton College includes the following 16 institutions:Alderson Broaddus University (Philippi, WV)Bethany College (Bethany, WV)Bethel College-North Newton (North Newton, KS)Bridgewater College (Bridgewater, VA)Catawba College (Salisbury, NC)Coker University (Hartsville, SC)Eastern Nazarene College (Quincy, MA)Ferrum College (Ferrum, VA)Greensboro College (Greensboro, NC)Huntingdon College (Montgomery, AL)Lake Erie College (Painesville, OH)Mars Hill University (Mars Hill, NC)Reinhardt University (Waleska, GA)Sterling College (Sterling, KS)Virginia Wesleyan University (Virginia Beach, VA)William Peace University (Raleigh, NC)The figures in this report have been organized and ordered into the following topic areas:Topic AreaFiguresPages1) Admissions (only for non-open-admissions schools)1 and 232) Student Enrollment3, 4, 5 and 63 and 43) Awards744) Charges and Net Price8 and 955) Student Financial Aid10 and 1156) Military Benefits*[No charts applicable]7) Retention and Graduation Rates12, 13, 14, 15, 16, 17, 18, 19 and 206, 7, 8 and 98) Finance21 and 22109) Staff23 and 2410 and 1110) Libraries*25 and 2611*These figures only appear in customized Data Feedback Reports (DFRs), which are available through Use the Data portal on the IPEDS website.IPEDS DATA FEEDBACK REPORT2
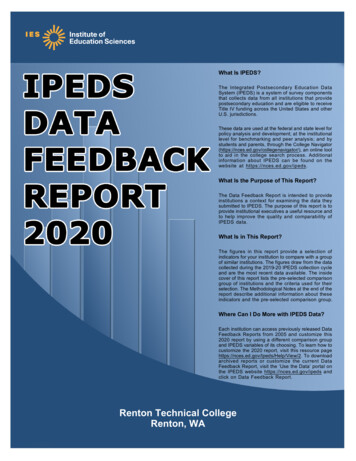
Barton CollegeFigure 1.Number of first-time undergraduate students whoapplied, were admitted, and enrolled full and part time:Fall 2020Figure 2.Image description.AdmissionsBarmeasureHorizontalchart with4 groups with 2 items per group.Xscale titledtitled ScaleNumberof students.Yscalelabel.GroupApplied(N oupMedian 1643.GroupAdmitted(N dianGroupEnrolledfullGrouptime(N 16). 1141.Item GroupEnrolledparttime(N end,Label: Your institutionShapeComparisonGroupLegend,End of image description. Label: Comparison Group MedianPercent of first-time undergraduate applicants admitted,and percent of admitted students enrolled full and parttime: Fall 2020Image description.AdmissionsBarmeasureHorizontalchart with3 groups with 2 items per group.Xscale titledtitled ScalePercentof titution42. Median (N 16) 1,2,Yourinstitution17. Median (N 16) 20.Item2,ComparisonGroupGroupEnrolledparttime.Item 2,1,3,Yourinstitution0.01.Median (N 16) tutionLegend,Label: Your institutionShapeComparisonGroupLegend,End of image description. Label: Comparison Group Median (N 16)Admissions measureAdmissions measure3,890Applied(N 16)421,643Admitted661,651Admitted(N 16)1,14117Enrolled full time20287Enrolled full time(N 16)2220Enrolled part timeEnrolled part time 0(N 10) 1001,0002,0003,0004,000010203040Number of studentsYour institutionComparison Group MedianYour institutionNOTE: Admissions data are presented only for institutions that do not have an openadmission policy, and apply to first-time, degree/certificate-seeking undergraduatestudents only. For details, see the Methodological Notes. N is the number of institutions inthe comparison group.SOURCE: U.S. Department of Education, National Center for Education Statistics,Integrated Postsecondary Education Data System (IPEDS): Winter 2020-21, Admissionscomponent.Figure 3.5060708090100Percent of studentsComparison Group Median (N 16)NOTE: Admissions data are presented only for institutions that do not have an openadmission policy, and apply to first-time, degree/certificate-seeking undergraduatestudents only. For details, see the Methodological Notes. See 'Use of Median Values forComparison Group' for how median values are determined. N is the number of institutionsin the comparison group.SOURCE: U.S. Department of Education, National Center for Education Statistics,Integrated Postsecondary Education Data System (IPEDS): Winter 2020-21, Admissionscomponent.Percent of all students enrolled, by race/ethnicity, and percent of students who are women: Fall 2020Image description.BarchartwithScale10 groupsX scalescaletitledlabel.with 2 items per group.YtitledPercent.GroupAmericanIndianAlaska Native.Item1,1,Yourinstitution1. orItem2,ComparisonGroupMedian (N 16) 1.Group2,Asian.Iteminstitution1. Median (N 16) 1.Item 1,2, YourComparisonGroupGroupBlackor mparisonGroupMedian (N 16) 20.GroupHispanic/Latino.Item1,4,Yourinstitution8. Median (N 16) 8.Item2,ComparisonGroupGroupNativeHawaiianor other Pacific sonGroupMedian (N 16) 0.01.GroupWhite.Item1,6,Yourinstitution55. Median (N 16) 56.Item2,ComparisonGroupGroup7,Twoormoreraces.Item 2,1, ComparisonYour institution4. Median (N 16) ion1.unknown.Item2,ComparisonGroupMedian (N 16) tem 2,10,ComparisonGroup Median (N 16) 3.GroupWomen.Item1, ComparisonYourinstitution57. Median (N 16) 52.Item2,GroupRace/ethnicityor : Your institutionShapeComparisonGroupLegend,End of image description. Label: Comparison Group Median (N 40513430American Indian orAlaska NativeAsianBlack or AfricanAmericanHispanic/LatinoNative Hawaiian orother Pacific IslanderWhiteTwo ormore racesRace/ethnicityunknownNonresident alienWomenRace/ethnicity or genderYour institutionComparison Group Median (N 16)NOTE: For more information about disaggregation of data by race and ethnicity, see the Methodological Notes. Median values for the comparison group will not add to 100%. See 'Use ofMedian Values for Comparison Group' for how median values are determined. N is the number of institutions in the comparison group.SOURCE: U.S. Department of Education, National Center for Education Statistics, Integrated Postsecondary Education Data System (IPEDS): Spring 2021, Fall Enrollment component.IPEDS DATA FEEDBACK REPORT3
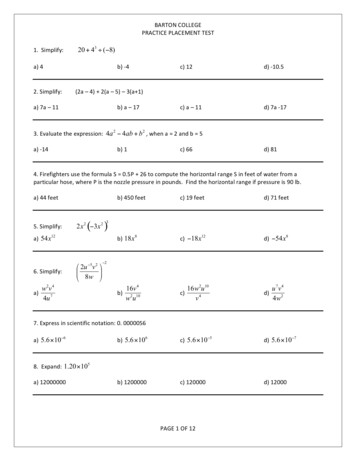
Barton CollegeFigure 4.12-month FTE enrollment, total unduplicated headcount,full- and part-time undergraduate headcount (2019-20)and total fall enrollment, full-time and part-timeundergraduate fall enrollment (Fall 2020)Image description.EnrollmentBarmeasureHorizontalchart with7 groups with 2 items per group.Xscale titledtitled ScaleNumberof students.Yscalelabel.GroupUnduplicatedheadcount - GroupMedianunduplicated(N 16) Yourinstitution1027.Item2,ComparisonGroupMedian (N 16) 848. headcount.GroupPart-timeundergraduateItem parisonGroup(N 16) 191.GroupTotalFTE risonGroupMedian (N 16) 985.Group5,Totalfall enrollment.Iteminstitution1177.Item 1,2, YourComparisonGroupMedianfall(N ,6,Yourinstitution1003.Item2,ComparisonGroupMedian (N ,7,Yourinstitution102.Median fallItem2,ComparisonGroup(N 16) 86.Shapeline,Label:ShapeInstitutionLegend,Label: Your isonGroup Median (N 16)End of image description.Figure 5.Image description.Distance h6 groups with 2 items per group.Xscale titledtitledof students.YscaleScale label.GroupUndergraduatesin distance education (N parisonGroupMedianGroupUndergraduatesat least5.one but not all distance education courses (N isonGroupGroupUndergraduatesin any17.distance education (N 16).Item an76. in distance education (N stitution19. MedianItem2,ComparisonGroup22. one but not all distance education courses (N 13).Group5,Graduatestudentsin at leastIteminstitution35. MedianItem 1,2, YourComparisonGroup0.01. in any distance education (N 13).GroupGraduatestudentsnot enrolledItem1,6,Yourinstitution46. eInstitutionLegend,Label: Your institutionShapeComparisonGroupLegend,End of image description. Label: Comparison Group MedianEnrollment measureDistance education participationUnduplicatedheadcount - total1,276Full-time undergraduateunduplicated headcount1,027569Undergraduates in at least onebut not all distance education courses (N 16)848128191Total FTEenrollment10Undergraduates exclusivelyin distance education (N 16)1,119Part-time undergraduateunduplicated headcountPercent of students enrolled in distance educationcourses, by amount of distance education and studentlevel: Fall 202017Undergraduates not inany distance education (N 16)22Graduate students exclusively indistance education (N 13)1922761,1339851,177Total fall enrollment947Full-time undergraduatefall enrollmentPart-time undergraduatefall enrollment46Graduate students not enrolledin any distance education (N 13)10286035Graduate students in at least onebut not all distance education courses (N 13) 01,0037612505007501,0001,2501,50066020Number of studentsYour institution406080Percent of studentsComparison Group Median (N 16)Your institutionComparison Group MedianNOTE: For details on calculating full-time equivalent (FTE) enrollment, see CalculatingFTE in the Methodological Notes. Total headcount, FTE, and full- and part-time fallenrollment include both undergraduate and postbaccalaureate students, when applicable.N is the number of institutions in the comparison group.SOURCE: U.S. Department of Education, National Center for Education Statistics,Integrated Postsecondary Education Data System (IPEDS): Fall 2020, 12-monthEnrollment component and Spring 2021, Fall Enrollment component.NOTE: N is the number of institutions in the comparison group.SOURCE: U.S. Department of Education, National Center for Education Statistics,Integrated Postsecondary Education Data System (IPEDS): Spring 2021, Fall Enrollmentcomponent.Figure 6.Figure 7.Percent of students enrolled in distance educationcourses, by amount of distance education and studentlevel: 2019-20Image chartparticipationwith 6 groups with 2 items per group.Xscale titledtitledYscaleScale label. exclusively in distance education (N 16).GroupUndergraduatesItem1,1,Yourinstitution6. Median 2.Item2,ComparisonGroupGroupUndergraduatesat least one but not all distance education courses (N 16).Item pGroupUndergraduatesin any18.distance education (N roupMedian79. in distance education (N ion21. MedianItem 1,2, YourComparisonGroup8. one but not all distance education courses (N 11).GroupGraduatestudentsin at leastItem1,5,Yourinstitution21. MedianItem2,ComparisonGroup0.01. in any distance education (N 11).GroupGraduatestudentsnot enrolledItem1,6,Yourinstitution58. eInstitutionLegend,Label: Your ison Group MedianEnd of image description.Number of degrees awarded, by level: 2019-20Image description.DegreelevelHorizontalBarNumberchart with6 groups with 2 items per group.Xscale titledtitledof omparisonGroup(N 16) 0.01.GroupDoctor'sProfessionalPractice.Item p(N 16) 1.Median (N 16) itution41. Median (N 16) 19.Item 1,2, titution205.Median (N 16) Yourinstitution0.01.Median (N 16) titutionLegend,Label: Your isonGroup Median (N 16)End of image description.Distance education participationDegree level6Undergraduates exclusivelyin distance education (N 16)Doctor's Research/ 0Scholarship 0266Undergraduates in at least onebut not all distance education courses (N 16)Doctor's Professional 0Practice 01827Undergraduates not inany distance education (N 16)Doctor's 0Other 07921Graduate students exclusively indistance education (N 11)21Graduate students in at least onebut not all distance education courses (N 11) 058Associate's67102019205Bachelor'sGraduate students not enrolledin any distance education (N 11)041Master's830405060708090100185000PercentYour institution100150200Number of degreesComparison Group MedianNOTE: N is the number of institutions in the comparison group.SOURCE: U.S. Department of Education, National Center for Education Statistics,Integrated Postsecondary Education Data System (IPEDS): Fall 2020, 12-monthEnrollment component.50Your institutionComparison Group Median (N 16)NOTE: For additional information about postbaccalaureate degree levels, see theMethodology Notes. N is the number of institutions in the comparison group.SOURCE: U.S. Department of Education, National Center for Education Statistics,Integrated Postsecondary Education Data System (IPEDS): Fall 2020, Completionscomponent.IPEDS DATA FEEDBACK REPORT4250
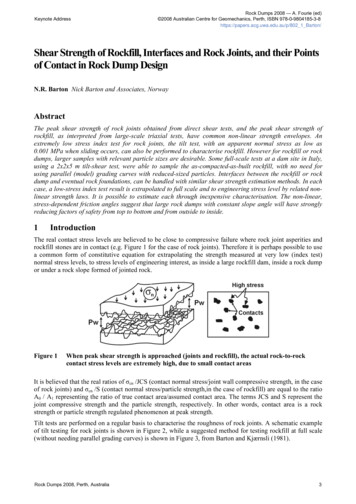
Barton CollegeFigure 8.Tuition and required fees for full-time, first-timedegree/certificate-seeking undergraduates: Academicyears 2017-18 to 2020-21Image description.Academic yearHorizontalBarTuitionchart withgroups with 2 items per group.Xscale titledtitledand 4fees.YscaleScale. label.Group2020-21Item1,1,Yourinstitution 32590.Item2,ComparisonGroupMedian (N 16) 31138.Group2019-20.Item1,2,Yourinstitution 31732.Item2,ComparisonMedian (N 16) 30358.Group2018-19. GroupItem 2,1,3,Yourinstitution 30880.ItemComparisonMedian (N 16) 29661.Group2017-18. GroupItem1,4,Yourinstitution 29998.Item2,ComparisonGroupMedian (N 16) : Your institutionShapeComparisonGroupLegend,End of image description. Label: Comparison Group Median (N 16)Figure 9.Average net price of attendance for full-time, first-timedegree/certificate-seeking undergraduate students, whowere awarded grant or scholarship aid: 2017-18 to 201920Image description.Academic yearHorizontalBarNetchartwith 3 groups with 2 items per group.Xscale titledtitledprice.YscaleScaleGroup2019-20. label.Item1,1,Yourinstitution 24111.Item2,ComparisonMedian (N 16) 21720.Group2018-19. GroupItem1,2,Yourinstitution 24419.Item2,ComparisonMedian (N 16) 20322.Group2017-18. GroupItem 2,1,3,Yourinstitution 22792.ItemComparisonGroupMedian (N 16) : Your institutionShapeComparisonGroupLegend,End of image description. Label: Comparison Group Median (N 16)Academic yearAcademic year 32,5902020-21 24,1112019-20 31,138 21,720 31,7322019-20 30,358 24,4192018-19 20,322 30,8802018-19 29,661 22,7922017-18 29,9982017-18 20,642 28,910 0 10,000 20,000 30,000 40,000 0 5,000 10,000Tuition and feesYour institution 15,000 20,000 25,000Net priceComparison Group Median (N 16)Your institutionComparison Group Median (N 16)NOTE: The tuition and required fees shown here are the lowest reported from thecategories of in-district, in-state, and out-of-state. N is the number of institutions in thecomparison group.SOURCE: U.S. Department of Education, National Center for Education Statistics,Integrated Postsecondary Education Data System (IPEDS): Fall 2020, InstitutionalCharacteristics component.NOTE: Average net price is for full-time, first-time degree/certificate-seekingundergraduate students and is generated by subtracting the average amount of federal,state/local government, and institutional grant and scholarship awarded aid from the totalcost of attendance. Total cost of attendance is the sum of published tuition and requiredfees (lower of in-district or in-state for public institutions), books and supplies, and theweighted average of room and board and other expenses. For details, see theMethodological Notes. N is the number of institutions in the comparison group.SOURCE: U.S. Department of Education, National Center for Education Statistics,Integrated Postsecondary Education Data System (IPEDS): Fall 2020, InstitutionalCharacteristics component and Winter 2020-21, Student Financial Aid component.Figure 10. Percent of full-time, first-time degree/certificate-seekingundergraduate students who were awarded grant orscholarship aid, or loans, by type of aid: 2019-20Figure 11. Average amounts of awarded grant or scholarship aid, orloans awarded to full-time, first-time degree/certificateseeking undergraduate students, by type of aid: 2019-20Image description.Typeof aidBar chart with 8 groups with 2 items per group.HorizontalXscale titledtitled ScalePercentof students.YscaleGroupAnyinstitutiongrant label.aid.100.Item1,1,YourItem2,ComparisonGroup Median (N 16) 100.GroupFederalgrants.Item 2,1,2,Yourinstitution88. Median (N 16) tem1,3,Your46. Median (N 16) teminstitution50. Median (N 16) 54.Item 1,2, 5,Yourinstitution100.Median (N 16) 100.Item2,ComparisonGroupAnyinstitutionloans. GroupItem1,6,Your74. Median (N 16) Yourinstitution74. Median (N 16) urinstitution8. Median (N 16) tutionLegend,Label: Your institutionShapeComparisonGroupLegend,End of image description. Label: Comparison Group Median (N 16)Image description.Typeof aidBar chart with 8 groups with 2 items per group.HorizontalXscale titledtitled ScaleAid dollars.YscaleGroupAnyinstitutiongrant label.aid. 23146.Item1,1,YourItem2,ComparisonGroup Median (N 16) 23772.GroupFederalgrants.Item 2,1,2,Yourinstitution 3337.ItemComparisonMedian (N 16) 4994.GroupPellinstitutiongrants.GroupItem1,3,Your 4729.Item2,ComparisonGroupMedian (N 16) 4762.Group4,State/localgrants.Iteminstitution 5282.Item 1,2, YourComparisonGroupMedian (N 16) ion 17600.Item2,ComparisonMedian (N 16) 18313.GroupAnyinstitutionloans. GroupItem1,6,Your 7210.Item2,ComparisonGroupMedian (N 16) 7213.GroupFederalloans.Item1,7,Yourinstitution 5606.Item2,ComparisonGroupMedian (N 16) 5762.GroupOtherloans.Item1,8,Yourinstitution 14290.Item2,ComparisonGroupMedian (N 16) : Your institutionShapeComparisonGroupLegend,End of image description. Label: Comparison Group Median (N 16)Type of aidType of aidAny grantaid100100FederalgrantsAny ts50Institutionalgrants74Any loansFederalloans 7,210 7,213Federalloans 5,606 5,762 14,290 12,350Other loans1010 17,600 18,313Any loans7874760 5,282 3,373Institutionalgrants1001008 4,729 4,762State/localgrants54Other loans 3,337 4,994Pellgrants46472030405060708090100 0Percent of studentsYour institution 23,146 23,772 10,000 15,000 20,000 25,000Aid dollarsComparison Group Median (N 16)NOTE: Any grant aid above includes grant or scholarship aid awarded from the federalgovernment, state/local government, or the institution. Federal grants include Federal Pellgrants and other federal grants. Any loans include federal loans and other loans awardedto students. For details on how students are counted for financial aid reporting, see CohortDetermination in the Methodological Notes. N is the number of institutions in thecomparison group.SOURCE: U.S. Department of Education, National Center for Education Statistics,Integrated Postsecondary Education Data System (IPEDS): Winter 2020-21, StudentFinancial Aid component. 5,000Your institutionComparison Group Median (N 16)NOTE: Any grant aid above includes grant or scholarship aid awarded from the federalgovernment, state/local government, or the institution. Federal grants include Federal Pellgrants and other federal grants. Any loans include federal loans and other loans awardedto students. Average amounts of aid were calculated by dividing the total aid awarded bythe unduplicated count of recipients at each institution. N is the number of institutions inthe comparison group.SOURCE: U.S. Department of Education, National Center for Education Statistics,Integrated Postsecondary Education Data System (IPEDS): Winter 2020-21, StudentFinancial Aid component.IPEDS DATA FEEDBACK REPORT5
Barton CollegeFigure 12. Retention rates of first-time bachelor's degree-seekingstudents, by attendance status: Fall 2019 cohortFigure 13. Graduation and transfer-out rates of full-time, first-timedegree/certificate-seeking undergraduates within 150%of normal time to program completion: 2014 cohortImage description.AttendanceBarstatusHorizontalchart with 2 groups with 2 items per group.Xscale titledtitled te (N 16).Item1,1,Yourinstitution70. ionrate (N 4).Item1,2,YourinstitutionNo data.Item2,ComparisonGroupMedian 38.Shapeline,Label:ShapeInstitutionLegend,Label: Your institutionShapeComparisonGroupLegend,End of image description. Label: Comparison Group MedianImage description.MeasureHorizontalBarPercent.chart with 2 groups with 2 items per group.Xscale titledtitledYscaleScale .(N te(N 9). 43.Item1,2,YourinstitutionNo data.Item2,ComparisonGroupMedian 41.Shapeline,Label:ShapeInstitutionLegend,Label: Your institutionShapeComparisonGroupLegend,End of image description. Label: Comparison Group MedianAttendance statusMeasure7052Full-time retentionrate (N 16)Graduation rate (N 16)6743Part-time retentionrate (N 4)Transfer-out rate(N 9)38010203041405060708090100010203040PercentYour institution5060708090100PercentComparison Group MedianYour institutionNOTE: Retention rates are measured from the fall of first enrollment to the following fall.Academic reporting institutions report retention data for the Fall 2019 cohort of studentswho are still enrolled as of the institution's official fall reporting date or as of October 15,2020. Program reporters determine the cohort with enrollment any time between August 1- October 31, 2019 and retention based on August 1, 2020. Four-year institutions reportretention rates for students seeking a bachelor's degree. For more details, see theMethodological Notes. N is the number of institutions in the comparison group.SOURCE: U.S. Department of Education, National Center for Education Statistics,Integrated Postsecondary Education Data System (IPEDS): Spring 2021, Fall Enrollmentcomponent.Comparison Group MedianNOTE: Graduation rate cohort includes all full-time, first-time degree/certificate-seekingundergraduate students. Graduation and transfer-out rates are the Student Right-to-Knowrates. Only institutions with mission to prepare students to transfer are required to reporttransfer out. For more details, see the Methodological Notes. N is the number ofinstitutions in the comparison group.SOURCE: U.S. Department of Education, National Center for Education Statistics,Integrated Postsecondary Education Data System (IPEDS): Winter 2020-21, GraduationRates component.Figure 14. Graduation rates of full-time, first-time degree/certificate-seeking undergraduates within 150% of normal time to programcompletion, by race/ethnicity: 2014 cohortImage description.BarchartwithScale10 groupsX scalescaletitledlabel.with 2 items per group.YtitledPercent.GroupTotal(N 16). edianGroup2,AmericanIndianAlaska43.Native (N 14).Iteminstitution0.01.MedianItem 1,2, YourComparisonGroup13.GroupAsian(N 12).Item1,3,Yourinstitution100.Median 39.Item2,ComparisonGroupGroupBlackor African(N isonGroupMedian N ianother PacificIslander (N 3).Item1,6,YourinstitutionNo ordata.Item2,ComparisonGroupMedian 33.Group7,White(N 16).Item 2,1, ComparisonYour institution52. Median 51.ItemGroupGroupTwoinstitutionor moreraces(N 14).Item1,8,Your55. yunknown (N 12).Item1,Yourinstitution58.Item (N 12).Item1, ComparisonYourinstitution75.Item2,GroupMedian 33.Graduationrates by nd,Label: Your institutionShapeComparisonGroupLegend,End of image description. Label: Comparison Group 83540332929333020131000Total (N 16)American Indian orAlaska Native (N 14)Asian (N 12)Black or AfricanAmerican (N 16)Hispanic/Latino (N 16)Native Hawaiian orother Pacific Islander (N 3)White(N 16)Two ormore races (N 14)Race/ethnicityunknown (N 12)Nonresidentalien (N 12)Graduation rates by race/ethnicityYour institutionComparison Group MedianNOTE: For more information about disaggregation of data by race and ethnicity, see the Methodological Notes. The graduation rates are the Student Right-to-Know (SRK) rates. Medianvalues for the comparison group will not add to 100%. N is the number of institutions in the comparison group.SOURCE: U.S. Department of Education, National Center for Education Statistics, Integrated Postsecondary Education Data System (IPEDS): Winter 2020-21, Graduation Ratescomponent.IPEDS DATA FEEDBACK REPORT6
Barton CollegeFigure 15. Graduation rates of full-time, first-time degree/certificateseeking undergraduates within 150% of normal time toprogram completion, by type of aid: 2014 cohortFigure 16. Bachelor's degree graduation rates of full-time,first-time bachelor's degree-seeking undergraduateswithin 4 years, 6 years, and 8 years: 2012 cohortImage description.Type of aidBar chart with 3 groups with 2 items per group.HorizontalXscale titledtitled ScalePercent.YscaleGroupPellinstitutiongrant. label.Item1,1,Your51. Median (N 16) Yourinstitution49. Median (N 16) 49.Item2,ComparisonGroupNeitherPellGroupgrantor Stafford loan.Item 2,1,3,Yourinstitution57. MedianItemComparisonGroup(N 16) 51.Shapeline,Label:ShapeInstitutionLegend,Label: Your institutionShapeComparisonGroupLegend,End of image description. Label: Comparison Group Median (N 16)Image description.Time to programcompletionHorizontalBarPercent.chartwith 3 groups with 2 items per group.Xscale titledtitledYscaleScale label.Group4 years.Item1,1,Yourinstitution41. Median (N 16) 31.Item2,ComparisonGroupGroup6 years.Item1,2,Yourinstitution52. Median (N 16) 41.Item2,ComparisonGroupGroup8 years.Item 2,1,3,Yourinstitution53. Median (N 16) tionLegend,Label: Your institutionShapeComparisonGroupLegend,End of image description. Label: Comparison Group Median (N 16)Type of aidTime
Reinhardt University (Waleska, GA) Sterling College (Sterling, KS) Virginia Wesleyan University (Virginia Beach, VA) William Peace University (Raleigh, NC) The figures in this report have been organized and ordered into the following topic areas: Topic Area Figures Pages 1) Admissions (only for non-open-admissions schools) 1 and 2 3