Transcription
IEEE TRANSACTIONS ON VISUALIZATION AND COMPUTER GRAPHICS, VOL. 14, NO. 6, NOVEMBER/DECEMBER 20081189Graphical Histories for Visualization: Supporting Analysis,Communication, and EvaluationJeffrey Heer, Jock D. Mackinlay, Chris Stolte, and Maneesh AgrawalaAbstract Interactive history tools, ranging from basic undo and redo to branching timelines of user actions, facilitate iterativeforms of interaction. In this paper, we investigate the design of history mechanisms for information visualization. We present adesign space analysis of both architectural and interface issues, identifying design decisions and associated trade-offs. Based onthis analysis, we contribute a design study of graphical history tools for Tableau, a database visualization system. These toolsrecord and visualize interaction histories, support data analysis and communication of findings, and contribute novel mechanismsfor presenting, managing, and exporting histories. Furthermore, we have analyzed aggregated collections of history sessions toevaluate Tableau usage. We describe additional tools for analyzing users history logs and how they have been applied to studyusage patterns in Tableau.Index Terms Visualization, history, undo, analysis, presentation, evaluation.1INTRODUCTIONWhen investigating data with visualizations, users regularly traversethe space of views in an iterative fashion. Exploratory analysis mayresult in a number of hypotheses, leading to multiple rounds ofquestion-answering. Analysts can generate unexpected questions thatmay be investigated immediately or revisited later. After conductinganalysis, users may need to review, summarize, and communicatetheir findings, often in the form of reports or presentations.By surfacing users interaction history, we can facilitate analysisand communication. History mechanisms such as undo or timetravel enable revisitation in a variety of applications (e.g., [1-4, 6, 8,12-14, 16-20, 22, 24-26]). As noted by Shneiderman [27], suchhistory tools can play an important part in the visualization process,supporting iterative analysis by enabling users to review, retrieve,and revisit visualization states. Moreover, history tools can helpusers create reports or presentations, facilitating communication.Interaction histories can also benefit research and development.History log analysis of both individual and aggregate usage canidentify common usage patterns and thereby assist usabilityevaluation. Researchers can also study interaction patterns to betterunderstand and model analysts sense-making process [13].However, the best history mechanisms for achieving thesebenefits are not always clear. Designers of visualization tools mustconsider a large design space of potential features and systemarchitectures when designing history tools. These design decisionsentail trade-offs in the types of history representations and operationsthat can be provided.For example, while it is easy to log low-level input events such askey presses and mouse clicks [25], users can more readily takeadvantage of semantically meaningful models. Many operationsmight be performed on an interaction history, including editing,aggregation, bookmarking, annotation, and search. Architecture andinterface design need to account for such operations. Furthermore,x Jeffrey Heer is with the University of California at Berkeley, E-Mail:jheer@cs.berkeley.edu.x Jock D. Mackinlay is with Tableau Software, Inc. E-Mail:jmackinlay@tableausoftware.com.x Chris Stolte is with Tableau Software, Inc. E-Mail:cstolte@tableausoftware.com.x Maneesh Agrawala is with the University of California at Berkeley, EMail: maneesh@cs.berkeley.edu.Manuscript received 31 March 2008; accepted 1 August 2008; posted online19 October 2008; mailed on 13 October 2008.For information on obtaining reprints of this article, please send e-mail to:tvcg@computer.org.1077-2626/08/ 25.00 2008 IEEEinteraction histories can grow large quickly, and thus historymechanisms must scale accordingly. Scale concerns arise at the datalevel, where histories can benefit from compact description, and atthe visual level, where history interfaces should be perceptuallyeffective and space efficient.In this paper, we explore the design of graphical history tools tosupport visual analysis. We first present the results of a design spaceanalysis, enumerating design decisions for the software architectureand graphical interface of history systems. Our analysis is intendedto provide an overview of important design considerations andthereby help practitioners incorporate graphical history tools intotheir own visualization applications.Inspired by our design space analysis, we then present the designand implementation of graphical history tools to support analysis,communication, and evaluation in Tableau, a database visualizationsystem [21, 28]. Although our primary contribution is a design studyof history tools for visual analysis, our graphical history prototypealso contributes new techniques for improving scalability, searchinghistories for relevant views, and generating presentations fromhistory subsets. Furthermore, we have used our history model tosupport evaluation by analyzing recorded usage data. We describeour visual history analysis tools and how we have applied them toimprove Tableau s user interface. We also calculate estimates of theimpact of our history management techniques, finding that ourtechniques can reduce visualized history state spaces by over 60%.2DESIGN SPACE ANALYSIS OF INTERACTION HISTORIESArchitects of interactive history systems face a number of designdecisions impacting the representations and operations available tousers. To design our history tools, we first conducted a design spaceanalysis to enumerate these decisions. We surveyed prior workspanning general history mechanisms [2, 8, 9, 23, 29] and interfacedesigns in the areas of graphical design tools [8, 16, 17, 22, 26], webbrowsing [1, 5, 12, 14, 15, 30], and visualization and simulation [3,4, 6, 10, 11, 13, 18, 19, 20, 24, 25]. In this section, we outline thedesign space of history tools using examples from this body of work.2.1History Models2.1.1Actions vs. StatesWe model interaction histories as movement through a graph ofapplication states. Nodes in the graph represent discrete states of theapplication and edges represent the actions that transform one stateinto another. A state is defined by the settings of interface widgetsand the application content (e.g., document, data, etc). At thePublished by the IEEE Computer Society
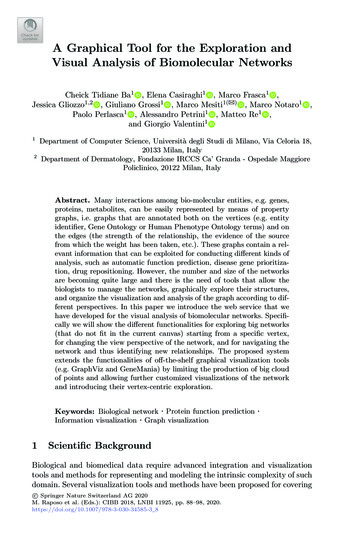
1190IEEE TRANSACTIONS ON VISUALIZATION AND COMPUTER GRAPHICS, VOL. 14, NO. 6, NOVEMBER/DECEMBER 2008architectural level, developers must decide if their history systemwill maintain sequences of states, actions, or both, and how suchhistory items discrete representations of an action or historicalstate will be organized.Action logging is often referred to as the command object model[9]. Command objects encapsulate an interface action, typicallyproviding both do and undo methods that apply the operation or itsinverse. To traverse the history, a sequence of commands can eitherbe done or undone in order. This approach requires that suitableinverse (undo) operations are defined for all actions.An alternative is to log the individual states of the application.Traversing the history then involves restoring the application state toa stored configuration, removing the need to sequentially apply undoactions. However, the drawback of this approach is that the staterepresentation can become memory inefficient.The action and state approaches are not mutually exclusive andhybrid approaches are possible. For example, an action-based historymechanism might periodically cache the state to reduce the numberof operations required by history traversal. A state model might alsolog metadata about the operations that were applied between states.For example, the WebQuilt web logging system [30] stores URLs(states) but also notes the index of the link clicked in the previouspage, modelling web browsing at the level of individual links.In surveying the literature, we have found that action logging isprevalent within graphic design tools, where large content modelscan make state models memory-inefficient. In contrast, state logging(as URLs) is common for web browsing histories. Visualizationsystems have utilized both approaches. As discussed later, thischoice affects the range of history operations that users may perform,particularly with respect to editing and selective undo.A common approach in visualization is to describe thevisualization in terms of a chain of visual encoding operators that areapplied to the data to generate the visualization state. Jankun-Kelly etal. [13] introduce a general model for visualization state as a set ofparameters, and actions as transformations of these parameters. Heeret al. [11] note that identical visualization views can be reachedthrough different parameter sets. In particular, different filteringcriteria may yield the same result set. Thus, accurate analysis ofrevisitation may require that state models include an index of theunderlying content in addition to parameter settings.One modelling issue specific to visualization is its data-drivennature: application states are dependent on the backing data set. If avisualized data set includes streaming or editable data, a faithfulhistory system must also take the changes to the data into account. Itmay be that users want historical states to update with changes to thedata, thereby keeping their analysis current (a form of selective redo,discussed later). If not, data management systems that supportversioning or provenance may be used; however, such systems mayentail an unacceptable storage cost. As a visualization view mightdepend only on a subset or aggregate of the backing data, in manycases creating an extract of the data for a snapshot of thevisualization state may be a feasible solution.2.1.2History OrganizationHistory items may be organized in various ways. The stack modelplaces items on both undo and redo stacks. This approach does notsupport branching histories, as the redo stack is cleared when newactions occur. A timeline model stores items in the linear order inwhich they occur. Branching models [29] store items in a treestructure, and actions performed after undo operations form a newbranch of the tree. Additionally, history models may perform contentindexing and organize history items by other metadata properties.2.1.3Hierarchical Command ObjectsSystems may represent history items at multiple granularities. Forexample, one can group a sequence of low-level actions into ahigher-level action through hierarchical command objects [23].Grouped actions may provide a better semantic description of auser s intention. To construct groupings, developers can craftFig. 1. A Graphical History Interface. Thumbnails show previousvisualization states and labels describe the actions performed. chunking rules [17] based on the type and timing of actions.However, groupings also raise challenges for representing andnavigating hierarchical history items in a user-friendly manner.2.1.4Local and Global HistoryOne can organize history items by the objects on which actions areperformed. For example, a spreadsheet may maintain separatehistories per worksheet, while a graphics editor could maintain localhistories for objects in the scene. Edwards et al. [8] propose atransactional model to support local histories in which actions mayhave global side-effects. In all cases, applications must support theability to merge local histories into a global timeline.2.2Visual Representations of History2.2.1Visual PresentationOne simple presentation of a history item is a text description of thestate or action, commonly found as menu text for undo and redoactions. Text descriptions should be easy to understand, and mayrequire subtle design decisions. For example, web history systemshave carefully considered different abbreviation approaches for webpage titles and URLs [1, 15]. While text may be helpful fordescribing actions performed in a visualization, they are less wellsuited for the graphical nature of a visualization state.Graphical representations of histories are also common. Somedepictions involve abstract properties: for example, the color of ahistory item glyph might represent the type of action performed.Most common, however, are thumbnail images used to aid users recognition of the previous interface state an approach particularlyrelevant for visualizations [20]. Multiple studies have found benefitsfor thumbnails in web browsing [15, 31], with one study suggestingthat a thumbnail size of about 120 pixels square is enough to enable80% accurate recognition of a visited web site [15]. Other projects[16, 17, 30] enhance thumbnails to improve comprehension byhighlighting changes and applying strategic callouts and cropping.2.2.2Spatial OrganizationDepending on the underlying history model, a number of visualorganizations of history items are possible. A common approach is alinear sequence of items, like a comic strip [17, 22]. Such anorganization facilitates visual scanning of the history, and typicallyenables navigation by clicking an entry. A similar approach is toprovide a continuous timeline [6, 24, 26], which shows the timeduration between actions and is navigated using a slider control.Branching histories typically use a node-link tree diagram toshow history branches. Prior work has adapted both the sequence [1,3, 4, 12, 18] and timeline [6] metaphors into branching tree displays.Klemmer et al. [16] present an inline branching design that placescollapsible history branches within a linear comic strip.Other representations are also possible. Behavior graphs [5] arean alternative representation of branching histories that we willdiscuss in section 4.1. Another approach is to use a content-centricrepresentation using variables other than time. WebQuilt [30]visualizes aggregate surfing behavior in a network diagram showingtraversed links between web page thumbnails. Ma s Image Graphs[20] display history states as thumbnails connected in a graph layoutand depict actions between states using iconic edge representations.
HEER ET AL: GRAPHICAL HISTORIES FOR VISUALIZATION: SUPPORTING ANALYSIS, COMMUNICATION, AND EVALUATION2.3Operations on HistoryDesigners need to also consider the set of operations that theirgraphical history tools should support.2.3.1NavigationFor end-users, the fundamental operation of history systems isnavigation to states in the history. Undo and redo (or back andforward) actions are common navigation operations found in manyapplications. Another approach is for users to click the thumbnail ofa history state to directly return to that state. Some systems use a time travel metaphor with a timeline slider. For branchinghistories, a graphical history can help users differentiate branches.Content-based navigation is also possible, such as navigating to thepoint in time that an object was last edited [26].2.3.2Editable HistoriesOther operations may involve editing the history, as users may wishto revise the history or replay past actions. In state-based historymodels, deleting a past state from the model doesn t affect any of theother states. In action-based models, editing has side-effects.Deleting a past action involves rolling back the history prior to theselected action and re-applying the subsequent actions. However,some subsequent actions may be dependent on a side-effect of thedeleted action, so rules to ensure integrity are needed.While history editing is more complicated for action-basedmodels, it enables unique operations. Selective undo [2] allows thereplay of past actions after revising the history. Similarly, selectiveredo [6, 17, 18] allows chains of actions to be copied and reused.Kurlander and Feiner [17] use this mechanism to support macrocreation. For example, a sequence of visualization transforms mightbe re-applied to a new subset of data [6, 18].2.3.3Metadata and AnnotationUsers may also wish to add metadata and annotations to historyitems. Bookmarking [11, 14], keyword tagging, text comments [10,11, 16, 24], and audio annotations [10] are all potentially useful.Usage scenarios for visualization include analysts creatingbookmarks for important findings [14], leaving text notes to describea view to a collaborator [16], and recording audio annotations to aid think-aloud evaluation protocols [10].2.3.4Search and FilterAs histories grow large, users may need means beyond visual searchand scrolling to find past states of interest. Search tools are onesolution. Metadata such as time, action type, bookmarks, andannotations are all potential search domains. Although filtering toolshave been provided for web design histories [16], most visualizationhistories [3, 6, 10, 18, 19, 20, 25] lack search capabilities. A notableexception is VisTrails [4], which enables querying-by-example tofind related visual exploration sessions across multiple users.2.3.5ExportTo enable communication, it is often important to export and shareparts of a history. For web-based systems, one can distribute a URL[4, 11], but desktop applications are typically more cumbersome.Klemmer et al. [16] print out thumbnails and text annotations aspaper reports. However, nearly all history tools are lacking morenuanced support for exporting histories into external media.2.4SummaryIn this section, we have categorized a range of design decisions thatarise when crafting an interactive history system. These decisionsinclude how to represent and organize historical data (e.g., states,actions, or both), how to visually present histories (e.g., linear orbranching layout), and what interactive operations the history shouldsupport (e.g., navigation, editing, search, and export). Still, the taskremains of deciding which route to take when designing a system.The features and context of use of the underlying visual analysis tool1191can further inform the design process for history tools. To illustratethis process, we now apply our design space analysis to develop aninteractive history system in the context of Tableau, a databasevisualization system.3GRAPHICAL HISTORY IN TABLEAU: A CASE STUDYBased on the considerations raised by our design space analysis, wedesigned a history interface supporting analysis and communicationin Tableau, a commercial visual analysis system. We now describeTableau and present the design of our graphical history tools.3.1The Tableau Visual Analysis SystemTableau is a commercial system, based on Polaris [28], forvisualizing the contents of databases. As shown in Fig. 2, theTableau interface includes a list of available database fields and aworkspace in which users can select fields and drag them ontoshelves corresponding to visual encodings such as position, color,shape, and size. Tableau is based on a specification language calledVizQL. VizQL statements are generated from the contents of theinterface shelves and they specify both the data that should bevisualized (as database query statements) and how the visualizationshould appear (as visual specification statements). This formalismsupports a range of visualizations, including bar charts, time series,scatter plots, and heat maps, as well as analytic operations such asfiltering, sorting, and drill-down [28].Akin to Microsoft Excel, Tableau supports multiple worksheets.Each state of a Tableau worksheet is described by a VizQLstatement. Tableau s original history model used a state-basedlogging approach, with each worksheet organizing VizQL statementson undo and redo stacks. This model does not support branchinghistories, except through duplication of worksheets. Undo and redobuttons provide some support for history navigation, but the modeldoes not provide text descriptions for undo/redo actions. In thefollowing sub-sections, we describe a redesigned model to bettersupport analysis and communication.3.2A Re-designed History ModelIn crafting a history model for Tableau, we wanted to maintain theexisting, clean approach of declaratively modeling state as VizQLstatements. However, VizQL statements alone are not enough, as wealso wanted to record historical data that enables us to provide highlevel descriptions of user actions, both to provide a more informativeuser interface and to support usage evaluation. As a result, ourimproved history model uses a hybrid state/action approach asidentified in our design space analysis.History items in Tableau still record states as VizQL statements,but we also introduced aspects of action-based logging. We created aclassification scheme for each action supported by the interface.When an action occurs, its unique identifier and any arguments arepassed to the history system, which stores the command descriptionand the current VizQL statement as a history item. Having a recordof actions allows us to create text descriptions, improving the cuesfor undo and redo within the interface. Our classification schemegroups actions into five top-level categories: shelf (add, remove,replace), data (bin, derive field), analysis (filter, sort), worksheet(add, delete, duplicate), and formatting (resize, style) commands.In addition to basic history items, our model supports compositesof grouped sub-items, similar to hierarchical command objects [23].All history items support data fields such as a timestamp, bookmarkstatus, and text annotations. We organize items in a branchingstructure for each worksheet, replacing the prior stack model. Whena user visits a past state and performs an action, a new analysisbranch is added to the model (see Fig. 5). Our history abstractionalso supports merged histories, implemented as a composite historyview of worksheet histories. By default, the state model does notinclude the database contents and changes to the database will causehistorical states to update to reflect the current data. However, userscan create data extracts if desired, ensuring a static data set.
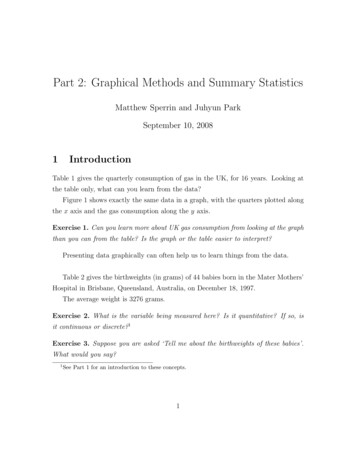
1192IEEE TRANSACTIONS ON VISUALIZATION AND COMPUTER GRAPHICS, VOL. 14, NO. 6, NOVEMBER/DECEMBER 2008Fig. 2. The Tableau Visual Analysis Tool, visualizing data collected from aggregated history usage logs. The panel on the left provides a list ofdatabase fields. Fields can be dragged onto visual encoding shelves in the workspace on the right to create visualizations. Multiple worksheets aresupported, indicated by the named tabs underneath the visualization. The panel along the bottom shows an analysis history viewer, currentlyproviding an overview of the current state of each worksheet. A tooltip provides details-on-demand for the selected history item.Fig. 3. History Interface. A drop-down menu determines which historyitems are shown. History can be filtered by data fields (via drag-anddrop), chart type, and bookmarks (§3.5.2).3.3Design of the Graphical History InterfaceWe designed our history representation with the understanding thatgraphical history should aid analysis in an unobtrusive fashion. Thevisualization should serve as the primary focus of attention and thehistory as an auxiliary display. We wanted to ensure that the graphicalhistory pays for its screen real estate, using only the space neededfor effective presentation and navigation of history items.As a result, the history model is depicted using a sequential,comic-strip display (Fig. 1, Fig. 2 bottom), including a thumbnailimage and text description for displayed history items. As treediagrams can require a lot of screen space, we present branchinghistories inline: branch contents are listed sequentially, with siblingbranches sorted by the timestamp of the first item. We position thehistory viewer along the bottom of the interface. Users can optionallyhide the viewer to make more space for the visualization. Hoveringthe mouse pointer over a history item reveals a tooltip with detailson-demand (Fig. 2). The tooltip lists the time the state was firstvisited in absolute and relative ( 3 min ago ) time. The tooltipincludes text annotations added to the item and a summary of visualencodings: which data fields are placed on which shelves.To maximize the usefulness of the history display, the interfaceprovides four modes, accessible via a drop-down menu (Fig. 3): Worksheets mode presents an overview of the current state of allworksheets, with a thumbnail and name for each (Fig. 2). Worksheet History mode presents the history of a worksheet.Thumbnails are captioned with action descriptions (Fig. 1, 6). All Histories mode is similar to Worksheet History mode butdepicts the merged global history across all worksheets. Bookmarks mode shows all views that have been bookmarked.Captions include the source worksheet name and a timestamp.
HEER ET AL: GRAPHICAL HISTORIES FOR VISUALIZATION: SUPPORTING ANALYSIS, COMMUNICATION, AND EVALUATIONBCGHDA1193EActionUndoGoto (Skip)FFig. 4. Adjusting Thumbnail Contrast. The image on the left is anoverview thumbnail generated by down-sampling that suffers from washout . On the right, high-frequency elements such as gridlines have beenremoved and pixel values are adjusted such that the data color in theimage matches the color encoding palette.3.3.1Thumbnail Image GenerationThe history viewer provides thumbnails of visualization states to aidrecognition. Thumbnail size introduces a trade-off between screenusage and recognizability. Based on the experimental results in [15],we chose 120 pixels square. As noted by our design space analysis,some graphics editors [16, 17] provide enhanced thumbnails thathighlight differences between history states and perform selectivecropping. As changes in Tableau regularly involve complete updatesof the visualization, this approach did not seem appropriate. Views inTableau often require scrolling, so we reasoned that a thumbnail thatprovides an overview of the display as well as historical data wouldbe the most useful for facilitating analysis.To generate the overview images we render the visualization atits native resolution and then scale the resulting image. We placelimits on the image buffer size, cropping the image as needed toconstrain memory usage. We also avoid extreme aspect ratios bynon-uniformly scaling the image when needed. In some cases, downsampling a large overview can result in a washed out image. Forlarge images, our thumbnail generation routine first modifies thevisualization, removing high-frequency visual elements such asgridlines and element borders. In the resulting thumbnail, pixels withbrightness over a threshold value are then scaled towards the nearestcolor in the color encoding palette (see Fig. 4).3.4Navigating and Managing HistoryBy visualizing past analysis states, our graphical history displayfacilitates revisitation. Users can click a thumbnail to skip back to aprior state. If a user performs analysis operations while visiting aprior state, a new analysis branch is created and depicted in thegraphical history. However, as these histories can quickly becomeunwieldy, we have implemented additional techniques to reduce thecomplexity of the display and filter unneeded views. Figure 5 depictsour model and how it is mapped into a visual display.3.4.1Manual EditingWe support manual editing so that users can delete unwanted statesfrom the history. As we use state-based logging, deleted states aresimply removed from their history branch and do not impose sideeffects on other history items. However, one caveat is that deletioncan result in an incomplete timeline in Worksheet History mode, inwhich text descriptions of prior actions are provided.3.4.2ChunkingWhen a group of related actions are performed in sequence, theymay be better represented as a single higher-level event. Forexample, in a word processor the keystrokes [c][h][u][n][k] might berepresented as the word [chunk]. To support such chunking ourChunkedGFig. 5a. History Management. A user performs actions to go from stateA to state E, performs two undo actions, and then skips back to state A.The user performs new actions to go to states F, G, and H. Chunkingrules determine that states F and G should be coalesced.ABCGHFig. 5b. Visual Presentation of History Model. The states in Fig. 5aare presented in a linear sequence. States D and E are culled by undoas-delete (§3.4.3), and states F and G are coalesced due to chunkingrules (§3.4.2). Branches (starting at states B and G) are listed inline.system provides hierarchical history items. In the spirit of Kurlanderand Feiner [17], we have hand-crafted a set of chunking rules tocoalesce actions into a grouped history item. As new states are addedto the history, the rules evaluate if the new state should be chunkedwith the previous state. A set of predicates expressing the chunkingconditions are applied and if any evaluates to true (and no exceptionrules do) the new state is chunked with the previous state.We have implemented three chunking rules based on empiricalusage data, along with some exception cases. In an analysis of useractivity (sec. 4.3.2), we found that rapid sequences of formattingactions are common and could benefit from aggregation.Accordingly, we include a rule that chunks history items if the mostrecent state was the result of a formatting operation. Similarly, aquick succession of sort or filter actions (less than 30 sec. apart)likely indicate a multi-step configuration of the view and arechunked together. A rapid series shelf actions to build up (or takedown) a view are also common, and so we chunk them whenseparated by less than 5 sec. We also support exception cases: largetime durations possibly indicating a break between sessions prevents any chunking, as does bookmarking or annotating a state.When our rules determine that two actions should be chunked,the thumbnail in the history view updates in-place and no newthumbnails are added to the view. Users can click in the history viewto skip to a state pri
visualization in terms of a chain of visual encoding operators that are applied to the data to generate the visualization state. Jankun-Kelly et al. [13] introduce a general model for visualization state as a set of parameters, and actions as transformations of these parameters. Heer et al. [11] note that identical visualization views can be .