Transcription
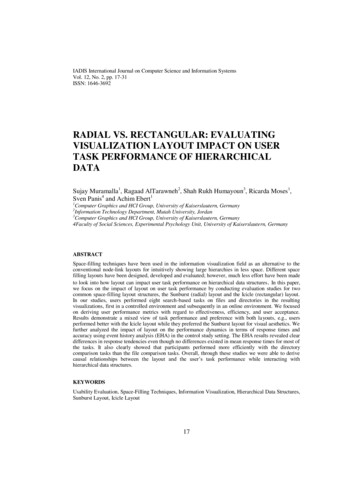
How Information Visualization Novices Construct VisualizationsLars Grammel, Melanie Tory, and Margaret-Anne StoreyAbstract—It remains challenging for information visualization novices to rapidly construct visualizations during exploratory dataanalysis. We conducted an exploratory laboratory study in which information visualization novices explored fictitious sales data bycommunicating visualization specifications to a human mediator, who rapidly constructed the visualizations using commercialvisualization software. We found that three activities were central to the iterative visualization construction process: data attributeselection, visual template selection, and visual mapping specification. The major barriers faced by the participants were translatingquestions into data attributes, designing visual mappings, and interpreting the visualizations. Partial specification was common, andthe participants used simple heuristics and preferred visualizations they were already familiar with, such as bar, line and pie charts.From our observations, we derived abstract models that describe barriers in the data exploration process and uncovered howinformation visualization novices think about visualization specifications. Our findings support the need for tools that suggestpotential visualizations and support iterative refinement, that provide explanations and help with learning, and that are tightlyintegrated into tool support for the overall visual analytics process.Index Terms—Empirical study, visualization, visualization construction, visual analytics, visual mapping, novices.1I NTRODUCTIONInformation visualization (InfoVis) is becoming a mainstreamtechnology that is being utilized by InfoVis novices – those who arenot familiar with information visualization and visual data analysis.Sites such as Many Eyes [37] enable anyone to upload and visualizedata, and systems that fall under the umbrella of casual InfoVisprovide visualizations in everyday life [30]. Despite this progress,the vision of InfoVis for and by the masses has not yet been realized[14, 17]. Part of the reason for this is that constructing perceptuallyeffective visualizations, and even interpreting moderately complexones, remains challenging for InfoVis novices.Interacting with visualizations has become easier with recent toolssuch as Many Eyes, Tableau etc. However, many potential users thatcould benefit from these tools lack visualization constructionexpertise. In particular, it has been noted that users have difficultiesdeciding how to map data elements to graphic attributes [14]. This isespecially problematic because selecting inappropriate visualmappings can impede analysis and even result in misleadingconclusions. It is therefore important to provide tool support thatenables InfoVis novices to design good visual mappings easily [14].To create such tool support, we need to understand how InfoVisnovices think about and express visual mappings, which barriers theyencounter, and how this impacts the sensemaking process. Once thespecific characteristics of visual mapping expression are uncovered,we can build tools that specifically support this process, for exampleby reducing discovered barriers. Such tools could potentially enablea larger audience to leverage visual data exploration and analysis fordecision-making and insight generation, both in work and in dailylife.While general models of the visualization process have beenproposed (e.g. [3, 5, 35, 38]), it remains unclear how these modelsapply to visualization construction by InfoVis novices, and exactlyhow a lack of visualization expertise impacts sensemaking. Toexplore this in detail, we designed an exploratory laboratory studythat investigated which processes novices typically follow during Lars Grammel is with the University of Victoria,E-Mail: lars.grammel@gmail.com. Melanie Tory is with the University of Victoria, E-Mail: mtory@cs.uvic.ca. Margaret-Anne Storey is with the University of Victoria,E-Mail: mstorey@uvic.ca.Manuscript received 31 March 2010; accepted 1 August 2010; posted online24 October 2010; mailed on 16 October 2010.For information on obtaining reprints of this article, please sendemail to: tvcg@computer.org.visualization construction, which common patterns appear, andwhich barriers and problems InfoVis novices encounter.Our work makes three primary contributions: first, we empiricallyexamine how information visualization novices constructvisualizations; second, we derive abstract models describing barriersin the data exploration process and how information visualizationnovices think about visualization specifications, and finally, weprovide implications for tool design based on our findings andmodels.2R ELATED W ORKThere are several models of information visualization processes thatdescribe the different steps users follow in configuring and usingvisualizations to gain insights. Card et al.’s reference model forvisualization ([3], see Fig.1) describes how visualizations arecreated in four steps and how the user interprets and interacts withvisualizations. First, raw data are processed and transformed intodata tables (data transformations). Data tables can be furthertransformed, for example by filtering, adding calculations, andmerging tables. The resulting data tables are then mapped to visualstructures (visual mappings), which are generic visual representationmechanisms such as line charts or maps with their correspondingvisual properties. After the data tables are mapped to visualstructures, views of the visual structures can be rendered anddisplayed to the user. Different views show different parts of thevisual structures at varying levels of abstraction from differentperspectives. View transformations are operations that change thoseviews, e.g. zooming on a map can change the visible part of the mapand the level of detail, but does not change the visual structure. Theuser interprets the views with a task in mind, and can interact withthe visualization by changing data transformations, visual mappingsand the current view.Chi’s Data State Model [6] extends and formalizes Card’sreference model by allowing for multiple pipelines, and by havingnodes represent state and directed edges represent singletransformations operations. Chi also analyzed different visualizationtechniques and showed how they fit into the Data State Model [5].Spence [35] identified selection, encoding, and presentation as themain steps in the transformation from raw data to visualization. Ware[38] devised a model of the visualization process that explicitly takesdata gathering into account, but does not distinguish between datatables, visual structures, and views. Ware’s model contains fourstages: collection and storage of data, data pre-processing,construction of image, and the human perceptual and cognitivesystem.
Table 1. Participants.Data Analysis (DA) performed Daily (D), Weekly (W), Monthly (M),Never (N). #VCCS indicates number of visualization constructioncycles created by participant (see Section 3.7).Participant IDFig.1. Visualization Reference Model by Card et al. [3]. The aspectsthat were investigated in this study are emphasized.Several aspects of these visualization models, such as viewinteraction (e.g. [19, 34, 40]), individual analytical processes (e.g.[1, 12, 29]), and team level analytics (e.g. [16, 32]), have beenexplored in depth, but an understanding of how users construct visualmappings remains limited. Several case studies present howvisualizations are created from a designer’s point of view [31] or as aclose interaction between designers and users [39]. These studiesfound that an iterative process of prototyping visualizations isessential: detours are often unavoidable and can provide valuableknowledge. While these studies provide insights into thevisualization construction process, they assume experts create thevisualizations for users, whereas our study focused on how InfoVisnovices create visualizations for their own use. This shifts the focusfrom facilitating communication and iterative domain understandingto bridging gaps caused by a lack of visualization expertise. Heer etal. [14] devised some guidelines on how to support novice users:facilitate user-friendly data input, provide automatic selection ofvisualization type using sensible defaults, and provide contextualinformation that explains which data are displayed and whichencodings are used. Our study corroborates these guidelines withempirical evidence and provides suggestions for additional toolsupport features.In summary, we offer several contributions beyond existing work.We build a model of how InfoVis novices think about visualizationspecifications and how they construct visualizations. We alsoprovide design guidelines for tool support to help novices createvisualizations. We note that our model and design guidelines arebased on empirical evidence.3M ETHODOLOGYIn this section, we discuss our study design, its limitations and thedesign choices we made. Our research goal was to explore howInfoVis novices construct visualizations, and specifically tounderstand the processes used in mapping data elements tovisualization attributes. We define InfoVis novices as those who arenot familiar with information visualization and visual data analysisbeyond the charts and graphics encountered in everyday life. InfoVisnovices can be domain experts in their area of expertise (subjectmatter experts) and the data they are analyzing can be from this area.Our research question is:How do InfoVis novices construct visualizations during visualdata exploration?We conducted an exploratory observational study in a laboratorysetting with a human mediator who used the visualizationconstruction software on behalf of the participants. Because InfoVisnovices are typically not exposed to advanced visualization tools andare unlikely to perform many in-depth visual analytics tasks, fieldstudies and survey research were not viable strategies. We chose tolet participants construct and analyze real visualizations, because webelieve that actually seeing the underlying data rendered in thespecified visualizations provides essential feedback for designingvisual mappings. Creating and refining visualization through amediator was less dynamic than direct interaction with visualizationtools, and this might have impacted the observed process. While webelieve that such direct interaction would be more iterative DDWMMNWNW# VCCs13111818221329188dynamic, we argue that elements of the process will be the same, andthat by introducing communication with a mediator, we achieveddeeper insight into how users think about visualizations, similar to athink-aloud protocol.3.1Pilot StudiesThe study design was shaped in a series of five pilot studies withfour participants – the same person participated in the first twopilots. In the first pilot, the participant directly used Tableau Desktop4.1. It turned out that the user interface and instructions influencedthe participants’ behaviour, and we could not determine whetherproblems occurred because of the interface or lack of understandingof how to create visual mappings. After the first pilot, we switchedto an approach where the participants told a human mediator howthey wanted the data to be visualized, and the mediator in turncreated the visualizations for the participants. In contrast to Wizardof-Oz approaches, participants were aware that the visualizationswere created by a human mediator, and the goal was not to simulatea system, but to shield participants from the tool interface. By hidingthe interface, we aimed to reduce tool and instruction bias whilepreserving the iterative loop of constructing, seeing and refiningvisualizations. In the last three pilots and in the study, the mediatorwas in a different room and used predefined messages tocommunicate with the participant to further reduce the influence onthe participants’ behaviour.Similar to the influence of the software interface, we found in thefirst two pilots that the task questions strongly influenced thevisualization construction process and which visualizations wereconstructed, and participants focused too much on understanding thespecific questions. To remove the influence of the questions, weswitched to an open data exploration task after the first two pilots.We improved the setup further in the last three pilots by adding aboard with visualization samples, improving and standardizing howthe human mediator responded, and refining the predefined messagesas well as the task instructions.3.2ParticipantsNine 3rd and 4th year business students participated in the study (seeTable 1 for details). To recruit participants, we announced our studyin four business classes, posted to two business student mailing listsand put up flyers on bulletin boards across campus. Although thenumber of participants may seem low, we believe it is appropriatefor our exploratory research approach, because our findings weresaturated in the 150 visualization construction cycles (see Section3.7) that were our unit of analysis.The participants were between 20 and 24 years old with a medianage of 21. The participants had been using computers between 8 and18 years (median 11). All participants used computers for at least 1hour per day, and often more. The frequency of how oftenparticipants performed data analysis varied from daily to never. 7 outof 9 participants reported that they were familiar with statistics, butonly 3 used statistics regularly. All participants were familiar withgraphs and charts.We chose participants with no specific experience in visualizationand with backgrounds that supported the understanding of basic
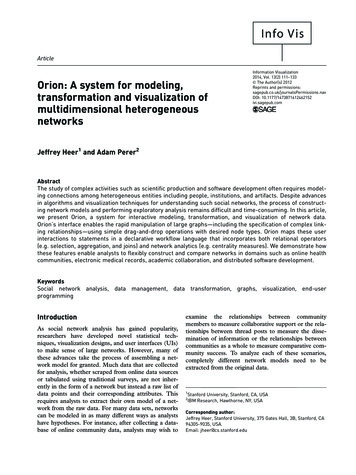
Fig.2. Participants’ Workspacebusiness data, because our data set contained sales data. Werecognize that selecting business students limits the generalizabilityof our results. Nevertheless, we believe that our results are similar toother groups of InfoVis novices, because the impact of the data setand domain on the visual mapping process itself is limited. Also,while we did not observe significant inter-participant variations onthe level of visualization construction cycles (see Section 3.7), it ispossible that individual differences such as cognitive style [20]influenced the visualization construction behaviour, as variationshave been observed by Kang et al. [18] for the sensemaking process.3.3ProcedureFor each participant, there was a separate study session that lastedabout 1 hour and 45 minutes. It started with a computer-basedbackground survey. Next, the materials for the observation phase, i.e.the sample visualizations, the task instructions, the visualizationcheat sheet, and the data attributes were explained. The participantwas invited to ask questions, and was given a 5 minute trainingphase to become familiar with the procedure. The goal of the trainingphase was to reduce the influence of learning. We still observedminor learning effects in some sessions, but those were usuallylimited to the first few minutes and participants were able toconstruct visualizations during that time. After the training phase, weobserved how the participant created and analyzed visualizations for45 minutes. Participants were encouraged to verbalize their thoughts.The study session concluded with a follow-up interview, in which weasked the participant about any encountered problems and thecreated visualizations. The interview was also used to clarify anyother observations made during the observation phase.3.4Setting and ApparatusParticipants were seated in a usability lab throughout the procedure.The two operators were in a control room linked by video and audio,except while the initial instructions were being given. Theparticipants’ workspace (see Figure 2) consisted of a 19’’ LCDmonitor that was used to display the constructed visualizations, aboard with 16 example visualizations, a notepad and three coloredpens. The participants were observed using cameras and amicrophone. Three cameras recorded the workspace and theparticipant’s actions from an above, a back-left and a back-rightviewpoint. The participants’ screen was also recorded.Operator 1 (mediator) observed the participant on three monitors,and had a dual monitor workstation on which he created therequested visualizations using Tableau 4.1. One monitor output wasduplicated to the participant’s screen. In response to a visualizationrequest, the mediator moved the visualization window to his privatescreen, created or adjusted the visualization, switched to presentationmode and moved the window to the duplicated screen. By switchingFig.3. Board with 16 Sample Visualizations. The board showed 5variations of bar charts (D, E, I, N, O), 4 variations of scatter plots (A,B, H, P – A & B only use 1 dimension for numerical values), 3variations of line charts (C, F, G – the line in F was not chronological),a pie chart (M), a histogram (J), a map (L), and horizontal lines withchanging width and color (K).to Tableau’s presentation mode, the controls and data attributes werehidden. We chose Tableau Desktop 4.1 as the visualization software,because it allowed us to rapidly create and modify a diverse set ofvisualizations on behalf of the participants. One limitation of ourstudy is that the range of visualizations which could be created withTableau 4.1 and the defaults provided by the tool still influenced thecreated visualizations and the mediator responses to some degree.However, a further reduction of tool influence was not possible,because we needed a software tool to allow for rapid iterative visualdata exploration within a study session. Also, separating mediatorand participants in different rooms might have led to increasedmiscommunication, and waiting for visualizations to appear mighthave influenced the participants to switch to different questionsbefore finishing their current analysis. However, we consideredreducing the mediator influence more important than retainingrealistic communication, because it increases the reproducibility ofthe study.In addition to creating visualizations, the mediator was also able todisplay text messages to the participant. Whenever the participantsasked for clarification, a visualization could not be created orrequested data was not available, the mediator responded to theparticipant using text messages. Predefined responses were usedwhenever possible. The audio channel from mediator to participantwas only used if text messages did not suffice, which happenedrarely. Operator 2 controlled the recording and took notes to informthe follow-up interview.3.5Task and MaterialsThe participants were asked to explore a fictitious sales data set andlook for interesting insights. They were told to imagine that theywere new employees in a company, and their supervisor had askedthem to analyze the sales data of the last 4 years and report theirinsights. The instruction to look for insights was solely intended toguide the participants. We did not analyze their insights, and not allparticipants reported their insights in a think-aloud manner.We used the superstore sales example data set from Tableau 4.1. Itcontains about 8,400 sales records with 28 different attributes. Thisdata was chosen based on two important characteristics: it containedenough attributes to support interesting exploration tasks for 45minutes, the length of our study, and participants were unlikely to befamiliar with the data and make preconceived assumptions about it.Participants received a task sheet containing the available dataattributes, the visual properties that could be mapped (color, shape,size, label, position, animation), the possible operations (filtering,
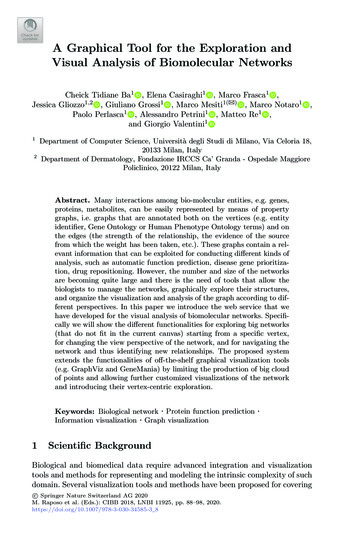
sorting, grouping, calculations, visualization history), and the taskdescription including a short scenario. The participants also had anotebook for sketches and notes, and a board of 16 examplevisualizations labelled by letters (see Figure 3). We chose to providesample visualizations, because we noticed in the pilots thatparticipants tended to use only the visualizations they are mostfamiliar with. We selected a broad range of different visualizationsthat are possible in Tableau 4.1 by choosing from the Tableauvisualization samples web page and adding three standardvisualizations (samples D, E, M). We aimed at covering as manyvisual elements and visualization types as possible in visualizationsamples of similar visual complexity. The visualizations were put ona board so they were all visible. We intentionally put more commonvisualizations (bar, line, and pie charts) on the less prominent partsof the board (left, bottom, and top), hoping that participants wouldgive greater consideration to visualizations that are presumably lessfamiliar.3.6Follow-up InterviewThe goal of the follow-up interview was to elicit more informationabout the designed visual mappings and the experienced difficulties.We followed an interview guide that contained questions about thosetopics. The interview was audio-recorded. Operator 2 selected adiverse set of about five different visualizations that the participantcreated during the observation session, and asked about the reasonsfor choosing those visualizations. We showed the correspondingvideo passages and visualizations, if necessary. We also asked aboutthe encountered difficulties and what might have helped to resolvethem. At the beginning of the interview, the participants rated theirunderstanding of the data set and their preference for familiarvisualizations on a 5 point Likert scale. We also asked them aboutthe reasons for preferring or not preferring familiar visualizations.3.7Data AnalysisWe analyzed the video and interview material using the qualitativedata analysis approach outlined by Creswell [7]. The transcribedmaterial was coded in several passes during which the codes weredeveloped, refined and consolidated. Themes that emerged from thecodes were compared to the interview data and the raw videomaterial to check their validity and to provide richer descriptions ofthe themes. We also analyzed the code occurrences to gain insightsinto the distributions and likelihoods of the underlying events.We used visualization construction cycles as units of analysis. Wedefine visualization construction cycles (VCCs) as instances duringwhich the participants created and refined a visualization. Theyended when the final visualization was displayed. New VCCs startedwhen the participants changed their analysis questions, switched todifferent data or started creating a new visualization. Minorrefinements were not considered to be new VCCs. We observed 150visualization construction cycles, ranging between 8 and 29 perparticipant, with a median of 18 (see Table 1). The VCCs are notstatistically independent samples, because each participant createdseveral VCCs. However, on the level of VCCs, the observationsreported here were evident across all participants, and we did notobserve that inter-participant differences had a big influence.To prepare the data for analysis, we transcribed the entireinterview and most of the video material. The only parts of the videothat we did not transcribe completely were the participants’interpretations of the visualizations; we only transcribed passagesthat led to changes of the visualization, led to switching the analysisgoal, or exposed difficulties interpreting the visualization. The videotranscription also included gazes, gestures and sketching.Our analysis was an iterative process with three to five passes by asingle coder (the first author) in which the coder developed, refinedand consolidated codes. First, codes were attached to transcribedpassages. These codes described what was immediately apparentfrom the data, e.g. ‘[reference to] sample visualization’, ‘time span’or ‘[reference to] visual property’. Next, the coder grouped codesFig.4. Consolidated Transitions and Activities in VCCs. The numbersand sizes indicate how often an activity or transition between activitiesoccurred. The numbers in brackets show how often a VCC endedafter an activity. All numbers are aggregated over all VCCs. Arrowsoriginating in “system displays visualization” indicate refinementsperformed by the participants. Arrows originating in the VCC box atthe top indicate how VCCs were started.and their context into themes, e.g. ‘data attribute selection’. Whengrouping codes into higher-level codes and themes, the relationshipbetween the codes was taken into account, e.g. words linking codestogether as in ‘[ ] consumers down the y-axis [ ]’. In thisexample, ‘consumers’ was coded as ‘data attribute’ and ‘y-axis’ wascoded as ‘visual property’. Taking the linking word ‘down’ intoaccount, the passage was coded as ‘visual mapping’.For each VCC, we identified how it was entered, between whichmain activities (themes identified in exploratory coding) transitionshappened, and where difficulties occurred. The findings across allVCCs were then summarized and are presented in Section 4.Interview material was used to support and explain themes thatemerged during coding. Background survey data was evaluated inthe context of particular observations, e.g. the preference of familiarvisualizations.4F INDINGSWe found that there were three main activities in the iterativevisualization construction process: data attribute selection, visualtemplate selection, and visual mapping specification (4.1). The majorbarriers were translating questions into data attributes, designingvisual mappings that support answering these questions, andinterpreting the visualizations (4.2). The participants often omittedparts of the visualization specification (4.3), and used simpleheuristics or preferred visualizations they were already familiar with,such as bar, line and pie charts (4.4).4.1Visualization Construction ProcessIn the visualization construction cycles (VCCs), the participantsstarted by creating a visualization specification, and after the systemvisualized the data according to that specification, the participantsinterpreted the visualization and refined the specification. Thevisualization specification consisted of data tables, visual structures(i.e. visualization types and their properties) and visual mappings(i.e. connections between attributes and visual properties) that aresimilar to those from the visualization reference model by Card et al.
[3]. The participants used different modes of expression, i.e.gestures, verbal statements, and sketches, to communicate thevisualization specification. The gestures included pointing atsketches, samples, and the current visualization, as well as drawingshapes in the air, e.g. circles for pie chart or waves for lines. Themodes of expression were used separately and combined. Weobserved three different specification activities (data attributeselection, visualization template selection and visual mappingspecification). Together these three specification activities indicatedwhich visualization should be created. Figure 4 summarizes the stepstaken by the participant to construct visualizations.The participants started either by selecting data attributes (74times), by choosing a visualization template (64 times overall, 30times referring to the current visualization as part of the analysisflow) or by specifying visual mappings (12 times), e.g. by starting todraw a sketch. We were able to identify a concrete hypothesis orquestion in 29% of the VCCs. For example, one participant asked atthe beginning of a visualization construction cycle “What are ourbest sellers? What do we make the most money on?”The participants then moved to different specification activities orwaited for the visualization to be displayed. There was no commontemporal order in which these activities happened. Instead, theparticipants seemed to switch between data attribute selection andvisual mapping specification. The visual template was selected atdifferent points during that process, but typically only once pervisualization construction. Participants specified at least the dataattributes that should be used, either directly or as part of the visualmapping specification or the visualization template. Waiting andlooking at the screen indicated that they expected the visualization toappear, and was observed after all three activities. Because theparticipants often omitted information (see 4.3), the differentelements of the visualization specification are not necessarilycomplete and connected. For example, operations that need to beapplied to data attributes might be missing, or the visual mappingsmight be incomplete.During data attribute selection, participants expressed whichdata attributes and relationships they wanted to see in thevisualization without mapping them to any visual property, forexample: “Can I see the sales per state?” This specification often alsoincluded expressing the expected level of abstraction, filtering,sorting, and operations that should be applied. For example, oneparticipant asked for filtering to concrete categories this way: “Can Isee the furniture data for Washington State divided by the customersegment in terms of sales [ ]?” Another participant expressed thelevel of abstraction for a data property and the application of thetotals operations like this: “Can I see the regional sales for each yearfor the past 4 years and then the total?” Sometimes, the participantsalso expressed the cognitive operation they planned to apply, e.g.“[ ] to compare that time to order priority”. Data attribute selectioncovers only the data attributes that are selected without referring tovisual properties. The participants could also implicitly add dataattributes to the visualization by including them in visual mappingspecification or visual template selection activities. We did notinclude such references to data attributes in the data attributeselection activity.For visualization template selection, participants de
How Information Visualization Novices Construct Visualizations Lars Grammel, Melanie Tory, and Margaret-Anne Storey Abstract—It remains challenging for information visualization novices to rapidly construct visualizations during exploratory data analysis. We conducted an exploratory laboratory study in which information visualization novices explored fictitious sales data by