Transcription
INSTITUT NATIONAL DE RECHERCHE EN INFORMATIQUE ET EN AUTOMATIQUETeam GRAVITÉGraph Visualization and InteractiveExplorationBordeaux - Sud-OuestTHEME COGc tivityeport2008
Table of contentsTeam . . . . . . . . . . . . . . . . . . . . . . . . . . . . . . . . . . . . . . . . . . . . . . . . . . . . . . . . . . . . . . . . . . . . . . . . . . . . . . . . . . . . 1Overall Objectives . . . . . . . . . . . . . . . . . . . . . . . . . . . . . . . . . . . . . . . . . . . . . . . . . . . . . . . . . . . . . . . . . . . . . . . . 12.1. Introduction12.2. Highlights23. Scientific Foundations . . . . . . . . . . . . . . . . . . . . . . . . . . . . . . . . . . . . . . . . . . . . . . . . . . . . . . . . . . . . . . . . . . . . . 33.1. Introduction33.2. Visual Graph Mining43.3. Visual Analytics for Graphs54. Application Domains . . . . . . . . . . . . . . . . . . . . . . . . . . . . . . . . . . . . . . . . . . . . . . . . . . . . . . . . . . . . . . . . . . . . . . 64.1. Introduction64.2. Social sciences64.3. Biology and bio-informatics74.4. Strategic watch85. Software . . . . . . . . . . . . . . . . . . . . . . . . . . . . . . . . . . . . . . . . . . . . . . . . . . . . . . . . . . . . . . . . . . . . . . . . . . . . . . . . . 86. New Results . . . . . . . . . . . . . . . . . . . . . . . . . . . . . . . . . . . . . . . . . . . . . . . . . . . . . . . . . . . . . . . . . . . . . . . . . . . . . 106.1. Graph Drawing106.1.1. Drawability of Euler diagrams106.1.2. Adaptive DAG drawing126.2. Graph statistics and graph clustering126.2.1. Graph comparison126.2.2. Metric survey136.3. Interactive graph mining136.3.1. GrouseFlocks: Steerable Exploration of Graph Hierarchy Space136.3.2. Code flows166.3.3. Hierarchies176.3.4. Applications176.3.4.1. Community identification176.3.4.2. Subsidiaries network176.3.4.3. Commuter network177. Contracts and Grants with Industry . . . . . . . . . . . . . . . . . . . . . . . . . . . . . . . . . . . . . . . . . . . . . . . . . . . . . . 208. Other Grants and Activities . . . . . . . . . . . . . . . . . . . . . . . . . . . . . . . . . . . . . . . . . . . . . . . . . . . . . . . . . . . . . . 218.1. ANR Systryp218.2. ANR SPANGEO228.3. ERDF RAUDIN239. Dissemination . . . . . . . . . . . . . . . . . . . . . . . . . . . . . . . . . . . . . . . . . . . . . . . . . . . . . . . . . . . . . . . . . . . . . . . . . . . 2310. Bibliography . . . . . . . . . . . . . . . . . . . . . . . . . . . . . . . . . . . . . . . . . . . . . . . . . . . . . . . . . . . . . . . . . . . . . . . . . . .231.2.
GRAVITE is an INRIA Team joint with University of Bordeaux (UB1) and CNRS (LaBRI, UMR 5800)1. TeamFaculty MemberGuy Melançon [ University Bordeaux 1, Team Leader, University Professor (Pr), HdR ]David Auber [ University Bordeaux 1, Assistant Professor (MdC) ]Maylis Delest [ University Bordeaux 1, University Professor (Pr), HdR ]Jean-Philippe Bordeaux Domenger [ University Bordeaux 1, University Professor (Pr), HdR ]Bruno Pinaud [ University Bordeaux 1, Assistant Professor ]Technical StaffJonathan Dubois [ University Bordeaux 1, Research Engineer ]Antoine Lambert [ University Bordeaux 1, Research Engineer ]Patrick Mary [ University Bordeaux 1, Research Engineer ]Morgan Mathiaut [ INRIA, Research Engineer ]PhD StudentRomain Bourqui [ Université Bordeaux 1, Conseil Régional d’Aquitaine grant, since Apr. 2007 ]Frédéric Gilbert [ University Bordeaux 1, MENRT grant, since Oct. 2008 ]Pierre-Yves Koenig [ University Montpellier 2, Research contract, since Apr. 2007 ]Trung Tien Phan Quang [ University Bordeaux 1, MENRT grant, since Apr. 2007 ]Arnaud Sallaberry [ PIKKO CIFRE, since Mar. 2008 ]Paolo Simonetto [ University Bordeaux 1, MENRT grant, since Nov. 2007 ]Faraz Zaidi [ SFERE, since Sep. 2007 ]Post-Doctoral FellowDaniel Archambault [ INRIA, from September 1st, 2008 till September 30, 2009 ]Visiting ScientistAlexandru C. Telea [ University of Gröningen, Nederland, from January 1st till March 31, 2008 ]Helen C. Purchase [ University of Glasgow, United Kingdom, from April 7 till April 18, 2008 ]Administrative AssistantAlice Rivière [ INRIA ]2. Overall Objectives2.1. IntroductionA recent U.S. report to the funding agencies NIH and NSF [33] provides strong arguments in favor of thedevelopment of visualization as a research field.“Visualization is indispensable to the solution of complex problems in every sector, fromtraditional medical, science and engineering domains to such key areas as financial markets,national security, and public health. Advances in visualization enable researchers to analyzeand understand unprecedented amounts of experimental, simulated, and observational dataand through this understanding to address problems previously deemed intractable or beyondimagination.”[from the Executive summary of [33]].
2Activity Report INRIA 2008Visualization is becoming a critical issue in a number of areas. It is more and more seen as a complementaryapproach - not only as a tool - for data retrieval and exploration or strategic and competitive watch, forinstance, where the structure of data is typically unknown and must be discovered and understood. It is also areliable approach when navigating already known and structured information space such as large ontologies.Information Visualization usefully combines with Scientific Visualization to help expert users explore andunderstand complex models underlying large scale simulations.In response to this challenge, GRAVITÉ aims at designing interactive visualization methods and tools toanalyze and mine large datasets. Our emphasis is on the visualization of graph structures to help users gaininsights from large datasets and large-scale simulations, to understand the data and/or the underlying model,and ultimately, to identify intrinsic properties or emergent phenomenon.More than just being able to deal with large volume and inhomogeneous data, we are required to deal withconstant changes in data, possibly making it ambiguous and uncertain. In the context of graph visualization,the challenge we face is thus to design methods and tools: to deal with large and dynamically changing graphs; to visually identify salient properties in changing substructures; identify the multiscale nature of data; to produce visual cues helping the user to track such changes in either one three different situationswhere dynamic graphs occur.A clear priority for our research is to address the needs of expert users faced with interpreting dynamic data.Our agenda is based on the needs expressed by our research community [75] [33] [34]. Our collaborations withexperts of other scientific fields as well as with industry contribute to the overall organization of this researchagenda and serve a twofold objective: to build theoretical knowledge relevant to information visualization and visual analytics, and developa sound methodology for graph visualization and navigation; to target transfer opportunities favoring the adoption of our ideas and technology by other scientificcommunities and by the industry.2.2. Highlights01/2008 Guy Melançon was appointed as a member of the steering committee for the I3 journal (see theURL http://www.revue-i3.org). The Information - Interaction - Intelligence (I3) Journal was foundedby members of the research group GDR I3, created by the CNRS in January 1998.The journal serves as a forum favoring the dissemination of interdependent and interdisciplinaryresearch involved in information retrieval, database, human-machine communication and artificialintelligence. The recent developments in these fields call for cross-discipline collaborations andperspectives. The I3 journal intends to promote inter-disciplinarity working at the development ofcommon terminology, concepts, typologies, methods and ontologies and aiming at the identificationof a unified perspective on research issues.The journal is published both as a traditional paper publication (published by Cépaduès http://www.cepadues.com/) and as an electronic journal on the web.04/2008 Our Graph Visualization framework was released under version Tulip 3.0 last April. One of thenew features provided with this version is a plugin manager easing the download and update of theentire collection of plugins developed by the team through a server. Each time the Tulip GUI islaunched, Tulip automatically connects to the plugin server hosted at LaBRI to check the availabilityof new plugins or application updates. Each connection is logged with the current date and clientIP initiating the connection. Exploring the collection of user logs provided feedback on the actualuse of the framework by our user community. Assuming that different IPs correspond to differentusers, excluding LaBRI IPs, the statistics showed that our 1600 users distribute over 69 different
Team GRAVITÉ3countries. Based on user logs collected since the tracking system was launched, about 40 differentusers from 10 different countries launch the application everyday. Other statistics extracted fromsourceforge.net (hosting the Tulip sources and binaries) and http://www.tulip-software.org (Tulip’swebsite) also reveal the increasing evolution of our user community: each new version of Tulip isdownloaded about 3300 times and this number has increased of 38% during the last twelve monthesperiod. Tulip’s website is visited about 2500 times per month and this number has increased of 15%over the same period of time.(07/2008) A subset of all our PhD students (and our intern Umang Sharan) took part in the VAST contest2008 (mini challenge number 3, see the URL http://www.cs.umd.edu/hcil/VASTchallenge08/). Theprimary task of the mini challenge was to provide characteristics for the Catalano/Vidro socialnetwork and to provide evidence on the temporal changes occuring in this social structure. Thedata set gathered information on 9834 (mobile) phone calls between 400 cellphones over a 10 dayperiod in June 2006 on the Isla Del Sueno. The records were expected to provide critical informationabout the Catalano social network structure. Given the quantity and nature of the data involved, ourstudent team developed a visualization environment built on top of our framework Tulip [4] to helpanalyze the evolution of the call structure over time. The various relationships between members ofthe network were modeled as a phone call graph and a location graph. Temporal snapshots of thegraphs were used as an analytic artefact to assist investigators analyzing the Catalano social networkstructure. The strength of the approach lied in its ease of use when exploring and navigating throughthe data set, easily switching between different views.This work won our team a publication in the VisWeek Conference Compendium [22], [27].(10/2008) GRAVITÉ will enjoy a three year grant from the ANR, working in collaboration with ThalèsCommunications and Xerox. The project called TANGUY – from Text to Arguments throughNetworks with Goals and User Initiative – will be concerned with the analysis of text fragmentsfrom which implicit pieces of information will be extracted, mixed with user data and interaction,focused at hypothesis building and validation ultimately helping law experts to build cases.(11/2008) The SPANGEO ANR project in which we took part was elected as Highlight of the Massesde données 2005 call, thanks to its coordinator Professor Céline Rozenblat (now at University ofLausanne, Switzerland). The project gathered quantitative geographers and computer scientists inan effort to develop and exploit results from network science. The project had a decisive impact onthe geographers ability to study data describing how network flows organize, confronting multi-levelorganizations of flows against territorial strategies.3. Scientific Foundations3.1. IntroductionThe visualization of data or information with the help of a computer, most often referred to as InformationVisualization, originated from ideas in fields as diverse as computer graphics, computer-human interaction,cognitive psychology, semiotics, graphics design, cartography and graphical arts. One of its early motivationswas to help users explore and analyze large quantities of data by developing software tools exploiting humanvisual capabilities according to [95], 40% of our cortical activities are dedicated to processing visual signals.The design of new visualization methods and tools becomes even more necessary with the continuouslyincreasing volume of available data, which poses a problem that obviously cannot be solved by relying solelyon the increase of CPU power. According to the « How much information » project developed at Berkeley,one exabyte of data (1 million terabytes) was produced in 2001, with 99,997% being exclusively availabledigitally (see [Keim 2001]). In 2003, that quantity seen as individual data production corresponded to 800megabytes per person in one year on the whole planet [88]. This abundance of information of course raisesmany questions and problems to solve. A number of research fields now contribute in their own way to thedesign of methods and tools to exploit this richness of information, among which visual approaches experiencegrowing success.
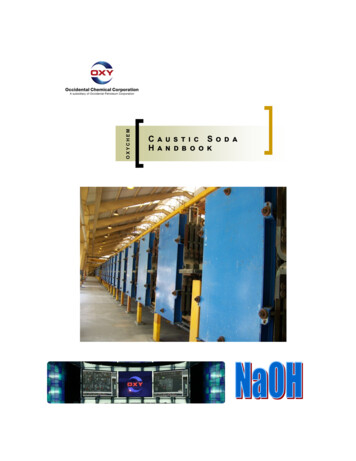
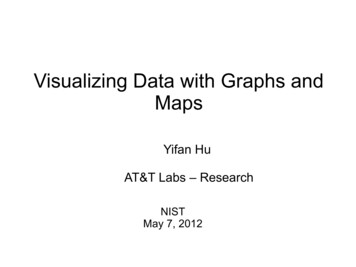
4Activity Report INRIA 20083.2. Visual Graph MiningVisually mining data requires astutely combining data analysis with visual graphics and interaction. Miningitself draws not only on statistics but in a rather astute mixture of mathematical rigor and heuristic procedures.As David Hand puts it [70], [69] :“To many, the essence of data mining is the possibility of serendipitous discovery of unsuspectedbut valuable information. This means the process is essentially exploratory.”From Hands perspective, we see that visualization has much to share with data mining because visualizationoften comes as an aid to exploratory analysis. The analysis task we are concerned with however differs fromthat conducted by dataminers, in that we seek to be able to produce readable and interactive visualizationsrather than coming up with reasonable, arguable and final conclusions on the data. The perspective to adopt isa combination of (semi) automated data processing together with human analytical and perceptual capabilities.Although relying on technology, the analysis task remains in total control of the human user. The NVACresearch agenda [34] clearly states:“[The] analysis process requires human judgment to make the best possible evaluation ofincomplete, inconsistent, and potentially deceptive information [.]”later calling for the development of[.] visually based methods to support the entire analytic reasoning process, [.].That is, in ideal cases the visualization should be designed in order not only to assist the analysis but to alsoactively contribute to its progress. Visualization thus appears as a multi-disciplinary field embracing a largespectrum of competencies. This partly comes from the need to cover all processes involved in the so-calledVisualization pipeline as depicted here:Figure 1. Visualization pipeline (adapted from [100]).A decade ago, Ben Shneiderman1 - who definitely helped Information Visualization to gain scientific visibility- suggested that visualization scenarios should obey his now celebrated mantra “Overview first, zoom and filter,then details on demand” [90]. The pipeline is coherent with Shneidermans mantra which actually provides anexcellent framework applying to almost any visualization environment. The back arrows correspond to theuser interacting on the view, asking for details or zooming in on a particular subset of the data.Daniel Keim has recently proposed a revised mantra, changing the focus towards data analysis2 :Analyse First - Show the Important - Zoom, Filter and Analyse Further - Details on DemandKeims mantra is closer to our perspective, merging graph mining together with visualization resulting ineffective visual analytics for relational data. However, the visualization process is not a linear one as mightsuggest the plain reading of the mantras and pipeline. The analyst exercises its exploration cyclically iterating1 Ben Shneiderman is professor in the Department of Computer Science, and Founding Director (1983-2000) of the Human-ComputerInteraction Laboratory at the University of Maryland (USA).2 See the Event Summary of the Workshop on Visual Analytics held at Konstanz University in June 2005: http://infovis.uni-konstanz.de/index.php?region events&event VisAnalyticsWs05
Team GRAVITÉ5through Shneiderman and Keims analysis/overview/zoom/details process. This is what makes visualization sodifferent from graphical statistics and presents a real challenge. The back arrows in Fig. 1 actually encapsulatea complex process through which the user gains insight and understanding on the visualized data. A moreuser-centred depiction of the same visualization process is given in the NVAC document:More recently, van Wijk suggested how to measure the effectiveness and benefits of a visualization in termsof learning efforts and acquired knowledge [102].3.3. Visual Analytics for GraphsGraphs offer a powerful and flexible mathematical tool to model real life phenomena. Biologists naturally usegraphs to infer relationships between subcellular components (proteins, peptides, genes, RNAs, molecules,.). Geographers have long used graphs to represent exchange networks (roads, air traffic, immigration, ).Sociologists heavily rely on the use of graphs to study social networks. In all cases, the visual inspection of anetwork supports the analysis of its community structure and helps to answer questions concerning prominentactors (proteins; cities; manager; logical entity) or subgroups (biological function; territory; team; logical unit).The identification of communities in a network is an essential step towards understanding the whole networkarchitecture. Once a subgroup has been identified, and when it appears as such within the visualization, itcan be zoomed in to allow a more detailed inspection of its own dynamics. Graphs also appear as a naturalmodelling tool in computer science itself (data structures, web graphs, workflows, etc.).Graphs moreover become a profitable metaphor when studying data equipped with a similarity measure eitherinherited from the data or computed from semantic attributes. A graph can readily be constructed applying athreshold on similarities. The use of a correlation measure to infer similarities is a common approach bringingsimilarities into the picture when analyzing data.The case of image classification/indexing is typical. Structural indicators such as the MPEG-7 colour structuredescriptors [82] [91] can be computed for each image; as a consequence, the similarity between any twoimages can be computed as a [0, 1] value. Images being highly similar can then be considered as neighboursin a (weighted) graph, enabling the analyst to exploit analytical tools borrowed from graph drawing, graphalgorithmics, graph theory and combinatorial mathematics.Bio-informatics also provide other interesting examples. For instance, an important use of DNA microarraydata is to annotate genes by clustering them on the basis of their gene expression profiles across severalmicroarrays. Because the transcriptional response of cells to changing conditions involves the coordinated coexpression of genes encoding interacting proteins, studying co-expression patterns can provide insights into theunderlying cellular processes. In this context, the (Pearson) correlation coefficient is a standard dissimilaritymeasure used to infer network structure. On the assumption that genes and their protein products carry outcellular processes in the context of functional modules, it is natural to ask whether such modular organizationcan be revealed through the study of gene or protein interaction networks.Graph Visualization is an active subfield of Information Visualization dealing with graph algorithms tofind patterns, test properties, embed graphs in particular geometries (most often 2D or 3D Euclidean) orinteractively manipulate their representations on the screen. Each year, a number of papers accepted at theIEEE InfoVis Symposium3 , the IEEE/Eurographics EuroVis Conference4 or the IEEE London InformationVisualization Conference5 concern graph visualization. The Graph Drawing community, with its own annualinternational symposium also contributes to the development of the field6 .When focusing on relational data (graphs), combinatorial mathematics offer tools to exploit the topologyof graphs and other structural regularities either numerically or from an algorithmic standpoint. A typicalgraph drawing algorithm will assume or test specific topological conditions such as being a tree or beingbi-connected. Visualization techniques can benefit from combinatorial knowledge on particular graphs. One3 See the URL http://www.infovis.org4 See the URL http://www.eurovis.org5 See the URL http://www.graphicslink.co.uk6 See the URL http://www.graphdrawing.org
6Activity Report INRIA 2008good example picked from our own results is the use of Strahler numbers (generalized to general directed orundirected graphs) to optimize the rendering of large graphs on a screen [38]. Other examples from our groupexploit the fact that combinatorial parameters in a tree can be approximated using a Gaussian distribution [74][39], folding or unfolding subtrees as the user navigates. Community identification methods based on using anode or edge dissimilarity measure in conjunction with a clustering method have proved fruitful.The development and full exploitation of combinatorics to feed all subprocesses of the visualization pipeline(Fig. 1) with emphasis on the data analysis part is at the heart of our project. The core strength of our teamresides in the development of combinatorial mathematics and graph algorithmics to serve the aims of graphvisualization. We deploy our mathematical and algorithmic skills in Information Visualization to develop: Graph statistics: that capture key properties of the data, including scalable implementations; Clustering methods: that handle large datasets both visually and computationally; Graph hierarchies: that transform large graphs into a hierarchy of smaller, more readable and easierto-manipulate sub-structures; Graph drawing algorithms: that lay out large datasets rapidly, enhancing scalability and addressingdomain-specific conventions and requirements; Interactions: that exploit graph hierarchies as a central mechanism for navigating large graphs, whiletaking domain-specific tasks into account; Evaluation methods: that generate artificial datasets (randomly) based on key properties of the targetdata.4. Application Domains4.1. Introduction“Collaborating with Application Domains. To achieve greater penetration of visualization intoapplication domains we must better integrate visualization capabilities with the requirementsand environments of these domains. To achieve this integration, we must allow application goals,domain knowledge, and domain-specific conventions and metaphors to shape visualizationmethods. Visualization methods must address the characteristics of real, rather than ideal,data, addressing among others the challenges of heterogeneity, change over time, error anduncertainty, very large scale, and data provenance.” [33]Visualization is by nature fed by application domains. Questions are raised by and embodied in domain specificdatasets. Working close to our end users is mandatory the users we are concerned with are experts fromspecific scientific domains or industrial sectors. Following an iterative process, the analysis/hypotheses evolveand refine while the visualization becomes more focused and adapted to the users task. Put differently, thevisualization helps expert users refine their hypotheses on the data while at the same time they become able toexpress their needs for visualization more effectively.4.2. Social sciences“Visualization has thus far had less impact on the social sciences than the physical sciences, inpart because of a dearth of funding for such efforts, but it holds the promise of effecting similartransformations.” [33]From our experience, we see social sciences as a fertile area from which ideas can emerge, and where visualanalytics techniques and methods can be designed, tested and validated. Because social sciences deal with nondeterministic phenomenon, it places us right in front of challenges underlined by Thomas and Cook: to dealwith large volume and inhomogeneous data, with constant changes in data, possibly making it ambiguous anduncertain. It is part of our agenda to develop closer relationships with research teams or industrial partners insocial sciences.
Team GRAVITÉ7We have had the opportunity to work in close collaboration with experts from quantitative geography throughthe ANR SPANGEO (Masses de données 2005 call) project7 . This ANR project has established close tiesbetween individuals and long-term collaborations with the community research in geography. It gave usthe opportunity to enter social sciences and explore the potentialities of interactive graph visualization andgraph hierarchies for geographers [1] [51], [79], [49], [89] [26], [23], [16]. Our approach clearly appears ascomplementary to classical cartography.Cartographers and geographers, because they often stick to the usual geographical world map to depictstatistical data, are limited by the size of the dataset they can visualize and thus visually analyze. Graphvisualization offers them the possibility of visualizing and navigating whole datasets, at the price of leavingaside geographical constraints.Moreover, quantitative geography also offered us the occasion to compare graph combinatorics with tools andapproaches based on graph theory developed by geographers. The theory of small world network as initiatedby Watts and Strogatz [96], [98], [97] draws new insights on spatial analysis as well as to systems theory. Itsconcepts and methods are particularly relevant to geography where spatial interactions are mainstream, andwhere interactions can be described and studied using large volume of exchanges or similarities matrix. Interms of geographical analysis of spatial networks, our methodology helped expert identify network entitiesacting as bridges between several components and offer a higher capacity for urban communities to benefitfrom opportunities and create future synergies.Multiscale models. Our methodology exploiting hierarchical graphs [5] [11] [83] appears as a fruitful strategyto discover scales in datasets [1].Identifying structural changes. The data we study with quantitative geographers typically is time-stamped.That is, we often have data on populations, companies, air traffic, etc., collected through public surveys or byprivate companies over several years or months. The issues we now address is to identify structural changes orevolving patterns in networks. The task here is of great interest: the answer does not solely rely on mathematicsor algorithms, but requires that experts link the identified pattern to real-life phenomenon and assess of itsexistence based on factual arguments (territorial policies, partnerships between companies, etc.).Other partnership have been established with partners aiming at the development of visual approaches tohypothesis building and validation for law experts. The heterogeneous nature of the data will once againchallenge us since law experts usually build cases based on information from texts (mail exchanges, newspaperextracts, etc.) and informal information from interviews or personal diaries.4.3. Biology and bio-informaticsBecause post-genomic data is made available publicly and is easily accessible on the web, biological data oftenbecomes a target for visualization techniques we develop. Protein interaction networks nowadays are easy tofind on the web; authors publishing in bio-informatics journals even sometimes provide the datasets they usedas a benchmark.Biology offers a fertile area for research in visualization because of massive data produced from experimentation, and also from a strong demand on the side of biologists. Problems in biology and bio-informatics concernalmost all issues cited above: graph statistics enter the scene when inferring graph structures from biological data, or wheninterpreting measures/attributes associated with the data; the nested structure of metabolism naturally makes use of graph hierarchies.Strong graphical conventions in biology (when drawing metabolic pathways or RNA secondary structures forinstance) turn the design of automatic graph drawing algorithms into a real challenge. Part of our researchwas developed through the ANR AReNa project8 . RNA comparisons required the development of new graph7 SPANGEO is a working group part of the S4 European initiative, see the URL http://s4.parisgeo.cnrs.fr/spangeo/spangeo.htm8 See the URL http://www.lri.fr/ denise/AReNa/
8Activity Report INRIA 2008drawing algorithms and graph visualization software [65] [6]. The Bordeaux environment places us close tobiologists and bio-informatics researchers. We also have contributed to the study of metabolism, more recentlytogether with researchers from the INRIA HELIX project in Lyon [8]. The questions addressed through thisstarting collaboration this time concern the identification of biological patterns in metabolic or signal networks.We have direct collaboration with biologists and bio-informatics researchers since the LaBRI team from whichour project stems is directly concerned with bio-informatics, placing us close to the actual users (as withSPANGEO). Team members interact with researchers of the INRIA MAGNOME project; these interactionsalready gave rise to the development of the software application ProViz [76].The recently launched ANR project SysTryp already gave us the occasion to renew and reinforce collaborations with researchers from INRA Toulouse (Fabien Jourda
Information Visualization usefully combines with Scientific Visualization to help expert users explore and understand complex models underlying large scale simulations. In response to this challenge, GRAVITÉ aims at designing interactive visualization methods and tools to analyze and mine large datasets.