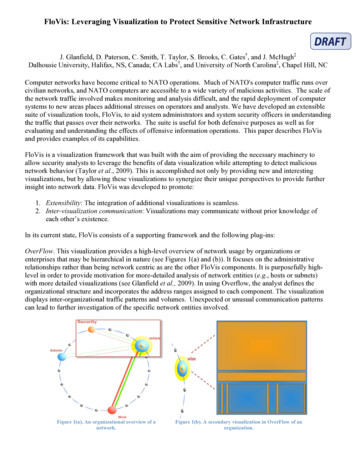
Transcription
Turkish Online Journal of Distance Education-TOJDE July 2010 ISSN 1302-6488 Volume: 11 Number: 3 Article 8INFORMATION VISUALIZATION AND PROPOSING NEWINTERFACE FOR MOVIE RETRIEVAL SYSTEM (IMDBRonak ETEMADPOURMona MASOODCentre for Instructional Technology and Multimedia,Universiti Sains Malaysia, MALAYSIABahari BELATONSchool of Computer Sciences,Universiti Sains Malaysia, MALAYSIAABSTRACTThis research studies the development of a new prototype of visualization in supportof movie retrieval. The goal of information visualization is unveiling of large amountsof data or abstract data set using visual presentation. With this knowledge the maingoal is to develop a 2D presentation of information on movies from the IMDB(Internet Movie Database) as our movie search engine. The aim is to amplify theperception of users over the retrieval environment while preserving the outputquality at an acceptable meaningful level. Visualization ideas deal with visualizationof information seeking results. These visualization techniques have been collectedfrom the literature on how to map the results of the information retrieval process. Wepropose a 2D visual interface for mapping collections of movies and exploration oftheir related information to maximize density of needed information in a single page.For this purpose, we introduce a movie categorization scheme to help users innavigating through the movies information.The traditional style (interface) of clicking a link to view details of documents in mostof the search engines like the IMDB (Internet Movie Database) as our movie searchengine to find information is very uninteresting and tedious. This is because whenclicking a particular link the user’s focus is shifted to the new page, and if theinformation presented is not to their interest, they will need to switch back to themovie’s search results. The key contribution is thus a reasonable mapping result of aquery on an actor/actress movie database displayed in just one page that can amplifyvisual perception of retrieved movies. This theory of data graphics interface focuseson maximization of the density of useful pertinent information with respect to usersquery in a screen page. This method of grouping of information needs some dataextraction algorithms by parsing and crawling the IMDB web pages that are useful toretrieve important movies information. Our graphical-based visualization provides acorrect understanding of information that users can view information withoutreading them. A qualitative experimental test comparing the classic (traditional)interface of the IMDB and visual interface was conducted.Keywords: Visualization, Retrieval system (IMDB), 2D visual interface, Contribution,Extraction algorithm, experimental test, IMDB Movies’ InformationVisualization162
INTRODUCTIONInformation is one important need in our private life, thus World Wide Web hasbecome a necessary important information source as part of our life. Technology hasdone a tremendous job of enabling the world to capture, store, and transfer hugeamount of data. However, to help people make good decision, large amount of data isused to uncover important meanings in an accurate, clear, and useful way. Findingthe interested data is one challenge for users, therefore "Visualization" leads us tofirst use graphical elements carefully in representing large amount of information anddatasets; second, attempting to display the datasets graphically, in two or threedimensions, grouped by topic, categories or clusters.This ability of the human mind to rapidly perceive visual information makesinformation visualization not only useful, but also powerful and a necessary tool forinformation discovery. Visualization tools are strongly related to the users and theirtasks. For example in printed form, visualization has included the display ofnumerical data (bar charts, plot charts, pie charts) and geographic data (encodedmaps). Users, Tasks, Data, and Basic visualization interactions are four importantissues for visualization implementation that focus on understanding the user’s needs.As Tufte (1990) says the main goal of information visualization is to amplify a deeperlevel of understanding and insights into the underlying process. “The application ofthe visualization is a technique to information retrieval really broadens the horizon ofinformation retrieval” (Zhang & Korfhage, 1999). In fact visualized data is muchbetter, more creative and obviously an interesting way for presentation of datasetsbecause data visualization is a modern approach and highly efficient for people todirectly perceive data and discover knowledge and insight from it. Traditionallyvaluable information has been achieved through charts and graphs. The model that isshown in Figure 1 is the data transformation from the input in the form of raw data todata tables and then visual mapping to visual structure and the final interface. Thewhole processes and tasks are manipulated by human interaction (Mann, 2002).Raw DataData TransformationDataTablesVisualStructureVisual MappingViewsView TransformationFigure: 1Human InteractionTraditional Retrieval Systems ProblemsLarge collections of documents are accessible to users via powerful search enginesand retrieval algorithms; in fact Search engines are very useful because they allowthe user to retrieve documents of interest from the World Wide Web. Since thecomputer is a powerful tool for searching, most conventional search engines likemovie search engines actually return thousands of hit documents as their output andfollow traditional interface of search engine that provide a linear list of resultsmatched with query. Various searching mechanism and algorithms are becominguseful to allow the user to retrieve documents of their interest.163
Search engines retrieve a ranked list of potentially relevant documents and usuallyresult of retrieved information displays in text list of titles. The only way to browsethe content on these sites is by choosing from a long linear list and scrolling throughthem to find useful information. This process is tiresome and tedious, simply becauseit is impossible to navigate such a long list. Based on this logic movie results of Moviesearch engines like Internet Movie Database (IMDB) are typically displayed in analphabetic organization that is difficult to use. They employ a traditional approach todatabase queries with textual response in forming scrolling list. Due to limited screenspace, the results are displayed in more than one page.ObjectivesTherefore, the main aim is to produce an interactive 2D visual interface in one pagethat reduces the needed screen space. It is a visual interface for visualizing theresults of movie retrieval system that summarizes the results using groupingtechniques, features that facilitate user navigation through displayed information.Using visual, attractive and understandable abstract shapes amplify users’ perceptionand this theory of data graphics interface focuses on maximization of the density ofinterested information in just one screen page.Related Works on Information VisualizationAn enormous amount of work has been done in the field of Information Visualizationin the last few years that ranges from geometric techniques (e.g., scatter plots,parallel coordinates), spiral- and axes-techniques to interactive visualizations forhierarchical information (e.g., cone), graph-based techniques (e.g., curved line) andicon-based techniques (e.g., Chernoff faces). Multivariate data visualizationtechniques are often limited in terms of data records to the limited size of the screen.One presentation technique is the tree map.Figure: 2Treemap display in a hierarchical data setThe tree map is a rectangle space-filling technique which separates rectangles intosmaller rectangles repeatedly to represent a hierarchical structure. Each rectanglerepresents a node. Vertical and horizontal lines are used alternatively to separate therectangles to small segments. Figure: 2 shows a sample of traditional tree view andits equivalent visualization technique in a tree map (Schneiderman, 1990).Simpleshapes like faces are effective graphical representation to reduce screen space whenpresenting huge complex datasets. Colors can be used to represent strategy throughmapping; the more similar the strategies, the closer the colors. For example, eachsegment (rectangle) in a tree map can be used to represent different score. Thepresentation of search engine result and representations of abstract data can beimproved in order to facilitate cognition of users specifically to achieve pertinentinformation by using interactive graphics to reduce time in finding the correspondingdata.164
Previous Works on Visualization of Retrieved ResultsFinding relevant information becomes increasingly difficult by the growth of the web.In 1997, Zimmer noted in a German newspaper that “the chance to find certaininformation decreases drastically with the increase of information possibilities”. Hisconclusion was that information overload is the key word; information rejection isalready the necessary action. The availability of large collections of documentscoupled with powerful search and retrieval algorithms provides the opportunity forpeople to access large sets of relevant documents in electronic form. Visualinformation retrieval technique has two distinct design genres: the cognitivestrategies of the human mind to solve problems and observed interaction patternswith existing information retrieval systems.There are many challenges to visualize information including choosing between 2Dand 3D interfaces, navigation and interaction methods, and selecting an appropriatelevel of detail. Animation is used more and more in information visualization systemsto help users keep their orientation when transformations or changes of mappingsoccur. Cat-a-Cone (Hearst & Karadi, 1997) also uses 3D animation for presentation ofhierarchical categories.The second technologies that we discuss are 2D visualization using simple HTML withJavaScript supports. This has recently gained popularity primarily due to certainapplications mapping search engine results. Some Visual Search assistant like oSkopewith a highly intuitive visual interface is producing interactive 2D visual interfacethat browses quickly through a large number of images to let us preview informationwith minimal paging regarding reduced needed screen space.Accordingly, in our study, the list of retrieved movies from IMDB can be representedvisually by using images or shapes in order to avoid long textual list of movies. 2Dpresentation is handled using a display graphic data structure from a shape. However3D-ideas have an important role in the area of documents visualization; but theyhave no potential components in most systems because the technical environment ofthe target users is standard PCs and input devices.PROPOSED METHODThe issue here is to present data on limited screen and to amplify user cognition ofretrieved movie results. In general though, a 2D mapping interface for search engineresults handles the comprehension aspect (producing variant category by usingdifferent colors and abstract shapes).Thus, construction of a graphical display will become important in representing theretrieval interest of texts or documents that consist of movies/videos. IMDb(http://www.imdb.com) is a popular site cataloging almost every movie ever made.Most people know about movies and can relate to movies and actors that arepresented with a visualization of the movie data that makes them eager to find theirfavorite movies and actors, check movies and explore actor/actress of their interest.That is why the study of IMDB as a movies engine is interesting.The dataset has rich information on each movie and actor scope. Figure 3 illustratesthe position of our proposed methods in the search engine visualization based on 2Dinterface.165
QuerySearch in IMDBdatabaseActor/Actress scopeRetrieveddocs2D interface2D visual methodFigure: 3Architecture of proposed methodIn this study, we are concentrating on the visualization of movie search results. Thespecific features are Data Presentation and Data Exploration that focus on themaximization of the density of useful information in a single page; these are twofascinating aspects in user comprehension. Information Visualization can be used asthe solution to present information by providing an interactive environment forpeople to discover information about movies.Problems in existing interface of IMDB that have been identified as follows: The searched results of IMDB are represented in the typical linearfashion.The standard style of click the link to view details of particular movie ispracticed here while it is useful for normal text based web navigation.Because by clicking a particular link the user focus is shifted to the newpage, and if the information presented are not to their interest, need toswitch back to the first page.The first page doesn’t show movies information such as genres,pictures, and actors of each movie.Principles of our visual interface are organized as follows:Phase 1 introduces the data preparation that consists of a list of over20,000 Actors/Actresses. We extracted 26000 names of famous actorsand actresses from the IMDB using a surface crawling procedure fromwww.IMDB.com. Surface crawling method enable searching of 10,000movies in the IMDB web site.Phase 2 explains the data analyses and results and this trend is furthercomplemented by extracting some summarized information from theIMDB, mainly to speed up our visualization progress. In fact wereduced and limit our data scope to a list of all actor/actress names,movies of per actor/actress, year that actor/actress play in a movie,genres of movies, and any documentation related to each movie.Phase 3 discusses the design of the visualization. The aim is to provide 2Dvisualization interface with one search box to retrieve the name of actor/actress ofinterest from the IMDB. Thus these retrieved texts will be presented using special 2Dinterface with different colors and different shapes or icons. A graphical modelcommunicates with users through iconic presentation of documents that users havemore control over the information retrieval process. Each document offers a 2D viewof the dataset to yield information for user decision-making with regard to itemselection. The entire document set is presented to make an environment toaccommodate users’ needs in an interesting way. The most functional rules forinformation retrieval visualization include proximity, closure, and continuity.166
These principles provide a framework of visualization-based information retrievalsystem interfaces from the users view. Proximity refers to perception of people on the grouping of elements;accordingly it is one of the best principles in interface design area.The law of closure is clear when the brain perceives boundaries ofobjects or when interface has contours that separate spaces.Text may be minimally used. Instead icons and abstract shapes areused while it is essential to make sense of the display and interpret themeaning of the icons or any shapes that is used (symbols to representconcepts).Color is used to sort, group or categorize such as year and name ofdirector are used as popular design features (here, colours andtextures highlight or differentiate elements).Graphical presentation of results are easy on the eye, colors are powerful element invisualization and have greatest psychological impact on visitors, and at the sametime the computer screen supports RGB color model. Furthermore, movie genres aresorted and color coded by genre that give them a distinct color each as shown inTable: 1.Table: 1Sorting genres based on colorsList of GenresActionLight etRomancePinkList of GenresAnimationDark taryLight greenGenres are represented in a circle that is divided into 12 slices; each slice is dedicatedfor one of the genres in Table 1. As Figure 4 demonstrates since each movie may havemore than one genre, using the slice technique for one genre is specified.Figure: 4Movie is divided into 12 slicesCircles are arranged in a year block and a star symbol is chosen to represent theactor/actress who plays the main role in the specific movie (Fig: 5).167
a)b)Figure: 5a) Star Symbol, b) Revolution size of circlesAn information triangle card provides more informationactors/actresses, documents, pictures is displayed in ordereffort to obtain an overview of a text or pictures that isreading view. As figure 6 displays the symbol of eachvisualization represents the movie information.about attributes such asto give tips to users in andirectly tied to a normalsegment in the triangleFigure: 6Triangle card InformationAs Figure 5 shows for handling of large volumes of data we determined our threshold3.16 close to 4 based on the average number of movies that an actor may play a rolein a year.Movies more than 4 can be mapped in a year square with changing the size of circlesto handle large volumes of data in a limited space of blocks that guarantees allrelevant movies with the same year located in a square block. Size of the smalldiagonal is 2/3 of current diagonal.D1 Size of current circle diagonalD2 Size of small circle diagonalD2 2/3 * D12/3 * 2r2r D12r D2SmallCurrentFigure: 6Revolution sizes of circles168
The final 2D proposed visual user interface is demonstrated in Figure 7.Title and Overview of movieMain Actorsof movieStar SymbolInformation triangle cardOverview ofmovieChanging sizeof CirclesFigure: 7Final 2D Proposed Visual InterfaceEXPERIMENTS, RESULTS AND PERFORMANCE ANALYSISA qualitative comparative survey between existing the IMDB interface and proposedvisual interface was developed. Twelve participants were given 5 minutes of trainingsession individually because each user has unique skills and experience. Allparticipants perform the same two tasks during a 20-30 minutes session. Eachsession includes a search on traditional interface of the IMDB and another with ourproposed visual interface. T-test Statistical method is applied to show significantdifferences in mean values. Our evaluation setting had the goal of comparingvisualization and non-visualization condition. Two groups of people, one group withcomputer science knowledge (6 participants: 3 males, 3 females) another withoutcomputer science knowledge (6 participants: 3 males, 3 females) were chosen tocomplete both parts (“viz” & “noviz”). All participants had no experience related toinformation visualization techniques.As illustrated in Figure 8, visualization has an increased trend in “wonderful” and“easy complete task”. Overall the graph shows fluctuations regarding the usersatisfaction parameters in the visual interface. The Graph has a dip in “easy”parameter; again indicating that traditional interface with the difference rate of0.1509 is much easier than visualization environment. Zero T-value in the logical itemshows both methods of presentation have an equal trend and has the same logic. Thisis good enough for our purpose since it shows the qualitative growth between thetwo interfaces. The visual results of movies is facilitated by different parameters suchas navigation using grouping, satisfaction and high density of interested informationbut do not say about the user's ability to work with structures. Therefore, it is notguaranteed as an easy interface. A correct understanding of search results is asuccessful visualization technique that our graphical visualization provides usefulhints to solve the information overloading.169
0.60.50.40.3T-Value0.20.10-0.1easy complete tasksstraightforwardQualitative epowereasysatisfyingwonderful-0.2Figure: 8T-value GraphAs discussed before our proposed method of visualization is a pre-developing stagethat aims to amplify cognition of users in a touchable way in work via some searchengines like IMDB while preserving all retrieved information from the huge IMDBdatabase. The design of an effective information visualization system is still more anart than a science.We have used information visualization techniques as an aid to the understanding ofthe IMDB environment as a model of a search engine. In order to perform the tasksuccessfully, we can suggest a set of structural description rules and legend in visualworking. In order to generalize the results to other information retrieval applications,the performance of all factors were evaluated with qualitative measures. In order togeneralize the results to other information retrieval applications the performance ofall factors were evaluated with qualitative measures. We convert textual informationinto graphical representation that can be processed visually rather than reading.Therefore, user can see information without reading the information. But asevaluations shows most of the users were unfamiliar with this kind of result (Movie)representation.This research implicates to improve the visualization of items interactivity. We needmore extensive usage studies and evaluations to investigate and observe userinteraction to determine a suitable implementation enhancing better support for dataexploration.BIODATA and CONTACT ADDRESSES of AUTHORSRonak ETEMADPOUR, she is a Ph. D. student in Instructional SystemsTechnology and Multimedia from Universiti Sains Malaysia (2009), anM.S.C Computer Science from Universiti Sains Malaysia (2008), and B.S.in Computer software engineering from Central Tehran Azad universityof Iran (2003). She is currently a PHD fellowship student at UniversitiSains Malaysia and researches on Information visualization and visualliteracy.170
She had 1 year work experience as web designer (2005-2006) and she was a personin charge of IT in Blue Gulf Shipping lines Company (2003-2005). Her interests arethe use of visualization in Education and psychological aspects of visual interfaces.She has participated in 3rd international computer and Instructional technologyConference.Ronak ETEMADPOURCentre for Instructional Technology and Multimedia,Universiti Sains Malaysia, MALAYSIAEmail: r etemadpour@yahoo.comMona MASOOD, she has a Ph. D. in Instructional Systems Technologyfrom Indiana University (2004), an M.S.Ed from Arizona State (1987),and B.S. in Mathematic and Economics from Oklahoma State (1986).She is currently a Senior Lecturer at Universiti Sains Malaysia andteaches both graduate and undergraduate levels including VisualCommunication and Human Computer Interaction. Her interests are inthe use of ICT in Education, e-learning, instructional systemstechnology, trends in educational technology, and multimedia designand production. She has published 40 papers in journals and proceedings in the fieldof instructional technology and presented at both national and internationalconferences, seminars and workshops. Presently she is actively involved in severalresearch grants that look into issues and standards of ICT and InstructionalTechnology. Association: Member of the South East Asian Association for InstitutionalResearch (SEAAIR) and Member of the Malaysian Educational TechnologyAssociation.Mona MASOODCentre for Instructional Technology and Multimedia,Universiti Sains Malaysia, MALAYSIAEmail: msmona@usm.myBahari BELATON, he is Assoc. Prof. Dr in Computer science school ofUniversiti Sains Malaysia, He has BAppSc.(Comp.Studies) from SouthAustralian Inst. of Technologu, Australia, B.Sc.(Hons) Flinders andPhD. Leeds, U.K. his research interests are Scientific DataVisualization, Computer Graphics & Network Security. Currently he isActing Research Dean and Information & CommunicationsTechnology Research Platform and he is Head of Visualization AndGraphics Group.Bahari BELATONSchool of Computer Sciences,Universiti Sains Malaysia, MALAYSIAEmail: bahari@cs.usm.myREFERENCESHearst, M. A. & Karadi, C. (1997). Cat-a-cone: an interactive interface for specifyingsearches and viewing retrieval results using a large category. P roceedings of the 20thannual international ACM SI GI R conference on Research and developm ent ininform ation retrieval. Philadelphia, Pennsylvania, United States, ACM, 246 - 255.171
Shneiderman, B. (1990). Tree Visualization with tree-maps: A 2D space fillingapproach. ACM Trans. Graphics, 11, 92–99.Tufte, E. R. (1983). The visual display of quantitative inform ation . Cheshire, CT:Graphics Press.Tufte, E. R. (1990). Envisioning I nform ation . Cheshire, CT: Graphics Press.Tufte, E. R. (1997). Visual ex planation . Cheshire, CT: Graphics Press.Zhang, J. & Korfhage, R. (1999). Dare, distance and angle retrieval environment: Atale of the two measures. Journal of the Am erican Society for I nform ation Science,50 , 779–787.172
information visualization not only useful, but also powerful and a necessary tool for information discovery. Visualization tools are strongly related to the users and their tasks. For example in printed form, visualization has included the display of numerical data (bar charts, plot charts, pie charts) and geographic data (encoded maps).