Transcription
ArticleOrion: A system for modeling,transformation and visualization ofmultidimensional heterogeneousnetworksInformation Visualization2014, Vol. 13(2) 111–133Ó The Author(s) 2012Reprints and OI: 10.1177/1473871612462152ivi.sagepub.comJeffrey Heer1 and Adam Perer2AbstractThe study of complex activities such as scientific production and software development often requires modeling connections among heterogeneous entities including people, institutions, and artifacts. Despite advancesin algorithms and visualization techniques for understanding such social networks, the process of constructing network models and performing exploratory analysis remains difficult and time-consuming. In this article,we present Orion, a system for interactive modeling, transformation, and visualization of network data.Orion’s interface enables the rapid manipulation of large graphs—including the specification of complex linking relationships—using simple drag-and-drop operations with desired node types. Orion maps these userinteractions to statements in a declarative workflow language that incorporates both relational operators(e.g. selection, aggregation, and joins) and network analytics (e.g. centrality measures). We demonstrate howthese features enable analysts to flexibly construct and compare networks in domains such as online healthcommunities, electronic medical records, academic collaboration, and distributed software development.KeywordsSocial network analysis, data management, data transformation, graphs, visualization, end-userprogrammingIntroductionAs social network analysis has gained popularity,researchers have developed novel statistical techniques, visualization designs, and user interfaces (UIs)to make sense of large networks. However, many ofthese advances take the process of assembling a network model for granted. Much data that are collectedfor analysis, whether scraped from online data sourcesor tabulated using traditional surveys, are not inherently in the form of a network but instead a raw list ofdata points and their corresponding attributes. Thisrequires analysts to extract their own model of a network from the raw data. For many data sets, networkscan be modeled in as many different ways as analystshave hypotheses. For instance, after collecting a database of online community data, analysts may wish toexamine the relationships between communitymembers to measure collaborative support or the relationships between thread posts to measure the dissemination of information or the relationships betweencommunities as a whole to measure comparative community success. To analyze each of these scenarios,completely different network models need to beextracted from the original data.1Stanford University, Stanford, CA, USAIBM Research, Hawthorne, NY, USA2Corresponding author:Jeffrey Heer, Stanford University, 375 Gates Hall, 3B, Stanford, CA94305-9035, USA.Email: jheer@cs.stanford.edu
112Typically, refactoring network data into such various models requires custom code that can take analystsdays or even weeks to write. While it is also possible toexpress most of the necessary operations as databasequeries, this requires defining a schema, loading thedata, and then forming the correct Structured QueryLanguage (SQL) queries—including complex queriessuch as multitable joins. Repeating this level of effortas new questions emerge may undermine the exploratory process and even dissuade some analysts fromtesting all hypotheses.To address these issues, we introduce Orion, a system for interactive modeling, transformation, andvisualization of network data. While many visualizationand data mining techniques have been proposed forsocial network analysis, Orion focuses on the oftenoverlooked early stages of data transformation andassessment when forming network models from sourcedata. Orion enables iterative, exploratory analysis byreducing hours of programming and transformation toa few minutes of interactive, graphical specification.We make the following contributions:A unified model and workflow language for network data.We use relational data tables as our fundamentalmodel and represent networks as edge tables over adomain of integer node indices. We chose this modelto correspond to those used by analytic databases andscalable network analysis packages. Our workflow language provides both relational operators and graphanalysis routines and enables the generation of reusable analysis scripts. The language supports a range ofanalysis tasks including network definition, filtering,aggregation, and statistics computation.A graphical UI for iterative network manipulation andvisualization. Orion translates UI actions, such asdrag-and-drop and menu commands, into operationsin the underlying workflow language. Orion also supports the specification of complex linking relationships. The system first constructs a graph model oflinks among table columns; a traversal algorithm thenidentifies all feasible linking paths defining networksfor a set of user-selected node types. This approachsimplifies the otherwise difficult process of specifyinga series of relational join and aggregation operations.Once a network has been defined, Orion enablesvisual exploration using tabular, matrix, and node-linkviews. Networks can also be exported for use in otheranalysis tools.The rest of the article is structured as follows: Afterreviewing prior work, we describe our data model andpresent the Orion interface. Next, we discuss ourenabling algorithms for network extraction anddescribe our workflow language. As a preliminaryInformation Visualization 13(2)evaluation of Orion, we demonstrate its use in casestudies of online health communities, electronic medical records (EMR), academic collaboration, and distributed software development. We then discuss futurework and conclude.This article is an extended version of an earlier publication1 and features more network operators, furtherdetails on our workflow language, and an additionalcase study. This version also includes Appendix 1 withimplementation and evaluation details for our foreignkey identification algorithm.Related workOrion draws on related work in graph visualization,analysis tools, and data management. We discussselected relevant projects below.Graph visualization techniquesResearchers have devised a variety of visualizationtechniques for networks.2 Two common representations used in social network analysis are node-link diagrams (typically using force-directed placement) andadjacency matrix views.3 Hybrids of the two have alsobeen proposed.4,5 These approaches organize elements according to the linkage structure of the graph.An alternative approach is to plot network dataaccording to the attributes of the nodes,6,7 as in a scatter plot or so-called semantic substrates.6 Networklinks can then be drawn between nodes. This approachis well suited for assessing potential correlationsbetween node attributes and network structure.In a related vein, PaperLens8 uses multiple coordinated views of network attributes to explore publication databases. The NetLens system9 generalizes thisapproach to support networks that fit a ‘‘contentactor’’ data model, that is, bipartite networks such aspublications and authors. In contrast, Orion supportsan arbitrary number of linking relationships bothwithin and between data tables.Others have researched means of dealing with largegraphs in excess of tens of thousands nodes. Commonstrategies include filtering and aggregation. Van Hamand Perer10 introduce a degree-of-interest function11that reduces a graph to a small connected subset ofnodes based on a set of foci (e.g. search results).PivotGraph7 and Honeycomb12 aggregate networks by‘‘rolling up’’ edges according to node attributes, forexample, an analyst can collapse a social network ofcorporate employees to show the summed connectionstrengths between workers’ geographic locations.ManyNets13 enables comparison among multiple networks using a tabular view of summary graph
Heer and Pererstatistics. If desired, users can still view standard(albeit less scalable) node-link diagrams on demand.Orion draws on this prior work: it provides bothnode-link and matrix visualizations and supports network aggregation based on node attributes. However,with the sole exception of NetLens,9 each of the abovesystems assumes that a well-defined network is givenas input to the tool. None of these tools help the userdefine and assess a variety of network models derivedfrom arbitrary data tables.Network analysis toolsRecent years have seen a proliferation of network analysis tools. Many of these tools combine visualizationand statistics within an interactive environment.14–18Others are programming libraries19–21 or menu-driveninterfaces22,23 that provide access to analysis algorithms. While these tools support data import fromcommon file formats (e.g. GraphML) and externaldata services (e.g. Twitter or Facebook), they do littleto facilitate the flexible construction of network models from arbitrary data tables. Orion is not intended asa replacement for these systems; rather, it is designedto assist the unsupported early stages of network analysis. In the process, it enables the use of these downstream tools.Managing graph dataAnother domain of related work is graph data management. Database researchers24,25 have developed storagestrategies and query languages25 for large networks.Similarly, a number of commercial systems—includingneo4j, InfiniteGraph, AllegroGraph, DEX, OrientDB,and sones/GraphDB—are now available. These systems facilitate storage, indexing, and querying of largegraphs but with goals different from Orion.Representative applications include managing socialnetwork websites and querying motifs in biological networks. Orion instead supports the construction andassessment of network models from source data.113not only data but also a declarative transformationscript that can be reapplied to new data and inspectedto review data provenance. In this light, Orion can alsobe understood as an end-user programming tool fornetwork manipulation.Orion was particularly influenced by (and is namedin relation to) the Polaris system,29 now commercialized as Tableau. Polaris maps drag-and-drop operations of data variables into a formal algebra fromwhich both database queries and resulting visualizations are derived. One key insight from this work is thevalue of deeply coupling visualization tools with richfacilities for data transformation. Orion similarly provides a UI in which user actions are mapped to statements in an underlying data transformation language.While Polaris enables filtering and aggregation operations over a single data table, Orion instead enablesmanipulation of multiple tables, including linking relationships realized as relational joins.The two systems most similar to Orion are Gilbertand Auber’s30 work on automated graph generationand Liu et al.’s31 Ploceus. Both of these systems enableanalysts to extract network models from tabular dataand visualize the results. Gilbert and Auber30 analyzethe relationships among table columns to infer a hierarchy of values (e.g. continent, country, and city).They present an interactive visualization of these hierarchies with which users can select a desired networkmodel that links entities according to shared columnvalues. However, the system only operates on a singletable. Ploceus31 enables users to similarly extract networks based on shared properties and provides a suiteof filtering, aggregation, and subdivision operations.Like Orion, Ploceus defines most of its operationsusing relational algebra and includes support for multitable joins. However, Orion provides more sophisticated subdivision methods and is unique in providingmixed-initiative support for network construction:Orion can automatically infer foreign key relationshipsand recommend possible network models forrequested node types.Interactive data transformation and queryingData modelOrion focuses on transforming data to create networkmodels. In a related vein, other research systems havebeen designed to assist the early stages of data cleaningand reformatting. Google Refine26 and DataWrangler27 enable analysts to reformat input data setsand correct data errors prior to analysis. D-Dupe28assists the process of finding and resolving duplicateswithin a data set. Any of these tools might be used toprepare data tables prior to network modeling withOrion. Similar to Wrangler, Orion produces as outputA variety of data models exist for handling graph data;common structures include adjacency lists and adjacency matrices. However, these representations aloneare insufficient for network analytics, as in many casesnetworks must be derived from a prior data sourcepermitting a number of models and parameterizations.As a simple example, a social network extracted froman email archive might include links only between senders and recipients or might include links among allco-recipients.
114Prior research on visualization toolkits has noted thevalue of representing networks as relational tables:32each row represents an edge in the graph, and columnscontain source and target node values among other edgeattributes. This format provides a sparse representation of the network, enables easy querying of attributes, and supports efficient edge iteration. On theother hand, this format is inefficient for path followingand is thus ill-suited for many graph algorithms. As aresult, we adopt a hybrid data model in Orion.We use relational data tables as our base representation. Tables can represent individual node types orlinking relationships. At times, node types may beimplicit within the attributes of a table; Orion providesmethods to promote these values to their own table.Networks can be inferred from the foreign key relations among tables. This design allows us to supportarbitrary node types and linking relations while facilitating integration with relational databases.Once a specific linking relationship has been chosen(as described in subsequent sections), Orion modelsthe network using a specialized edge table format.Source and target columns represent incident nodesusing zero-based integer indices. For efficient processing, these indices default to the row index in the corresponding node table. This scheme works well for edgesinvolving a single node table but leads to index collisions among different tables. To ensure distinct keys,we bias the indices for a given table by the total size ofany previous tables. The mapping from node tables toindex ranges is stored as metadata for the edge table.Some graph analysis routines, such as force-directedlayout or clustering coefficient calculation, can be performed by simply iterating over edges. However, othermethods—including shortest path and betweennesscentrality algorithms—must traverse the graph by following paths. Accordingly, our edge tables support theconstruction and caching of adjacency lists, represented as an array of sorted integer arrays for in-links,out-links, or both.This integer-based representation provides multiplebenefits. In particular, it allows rapid access of associated node data via index-based table lookups and facilitates the creation of efficient network analysisroutines. Representing nodes as zero-based integersenables the use of simple arrays to keep state withingraph algorithms, avoiding the overhead of associativedata structures.Our data model, like the rest of Orion, is implemented in the Java programming language. We haveimplemented our own data structures and processingroutines, but our data model was intentionally chosento correspond to those used by modern analytic databases and scalable network analysis packages.21 Infuture work, we want to exploit this correspondence toInformation Visualization 13(2)implement our workflows on massively scalable platforms. We use relational operators for as much of ourworkflow as possible, so that we can later leverageshared-nothing parallel databases. That said, we willshow shortly that our own implementation alreadyscales to networks involving millions of elements andso supports a broad class of data sets.The Orion UIWith the Orion UI, analysts can import source datafrom multiple formats, specify a variety of networkmodels, compute statistics, and visualize the results.Analysts can then export either the resulting data or adeclarative script defining the transformation workflow. In this section, we first describe the design of theOrion interface through a concrete usage scenario. Wethen provide more detailed descriptions of Orion’s UIcomponents.Usage scenarioConsider the real-world example of a researcher (aComputer Science PhD student) studying onlinehealth communities organized around medical conditions (e.g. asthma, lupus, and lyme disease). Drivingquestions include the following: How do communitydynamics and structure vary across conditions? Canwe gain new insights from the co-occurrence of symptoms and conditions? To explore these questions, ouranalyst collected over 3 million discussion posts fromMedHelp.org, a public online health site. The initialdatabase consists of a single table where each row represents a post on the site. Table columns include aforum (community) name, the user name of the poster, the post date, the title of the discussion thread,and the post text.From these data, the analyst would like to analyzethe social networks of the individual communities. Shebegins by importing the data table (a large commaseparated values (CSV) file) into Orion. The table andits columns are displayed in the Schema Viewer inFigure 1(a).Next, she must define the entities of interest thatmight form the nodes of her graph. Currently, theseentities reside implicitly as values within the table. Theanalyst right-clicks the username field and selects‘‘Promote’’ in the resulting context menu. This operation causes all username values to be extracted fromthe table: a new table is constructed with one row foreach unique user and the username field in the original table is replaced with a foreign key referencing thenew table. As the analyst wishes to model a social network based on co-participation within a discussion
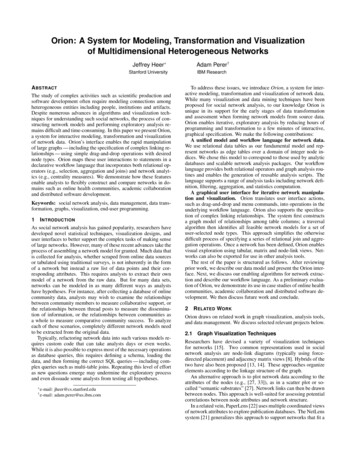
Heer and Perer115Figure 1. The Orion user interface, consisting of (a) a schema viewer for manipulating data tables and (b) a linkerinterface for creating network models. Analysts drag-and-drop desired node types to the linker and Orion responds with(c) a table of possible linking paths. (d) The preview display shows the resulting network data. Analysts can also specify(e) aggregation, (f) filtering, and (g) splitting (subdivision) criteria.thread, she similarly promotes the thread id field as anentity of interest.The analyst would now like to construct a socialnetwork among users. She drags the id field (the primary key) from the username table and drops it on theLinker interface in the center of the Orion window(Figure 1(b)). The interface allows analysts to specifydesired source and target node types. In response,Orion calculates all feasible network definitions involving username entities as nodes (Figure 1(c)). In thiscase, there is only one feasible result: linking users byshared threads. Should the analyst wish to consideralternatives, she could promote other entities (e.g.individual forums).When the analyst clicks the check box to include thelinking path, Orion responds by showing a preview ofthe resulting graph (Figure 1(d)). Orion previewsinclude both a list of tables that will be generated andan inspector for individual table values. For now, theanalyst would like to limit her exploration to a singlecommunity. She drags the forum field from the SchemaViewer to the Filter region of the Linker; she thenselects the ‘‘Asthma’’ forum using the resulting searchbox (Figure 1(f)). The preview updates in turn.Satisfied, the analyst clicks the ‘‘Create Network’’button to add the network to the data set; the SchemaViewer updates with a new edge table containing linksbetween all posters to the ‘‘Asthma’’ forum who haveposted to the same thread; by default, edge weightsindicate the number of shared threads between twousers.By right-clicking the ‘‘Asthma’’ edge table, the analyst reveals additional options. She can choose tovisualize the network using both matrix and node-linkdiagrams. In a matrix overview (Figure 2(a)), the disjoint structure of the community becomes evident,which suggests that newcomers arrive into the community, ask a question, and it gets handled by one of ahandful of leaders. This also suggests that the community may serve as an ‘‘answer mill’’ rather than a placeof prolonged discussion. The analyst can dig deeperby filtering the visualization to only show a highlyactive cluster and pivots to a node-link visualization(Figure 2(b)). Here, with nodes sized by their postcount and colored according to their betweenness centrality, the analyst can focus on specific nodes of interest for further analysis.Individual tables can be inspected and visualizedusing bar or scatterplot charts. Each visualization alsosupports interactive filtering controls. After filtering
116Information Visualization 13(2)Figure 2. Orion visualizations of online health communities. (a) A sorted matrix view of an online asthma forum. A fewcentral leaders divide up responses among incoming questions. (b) Node-link diagram of highly active cluster of thesame forum. (c) Plot of betweenness centrality values for two different network models, sized by number of posts. Themodels have similar centrality distributions.the graph to highlight interesting patterns, the analystcan save the filtered edge table as an additional entryin the Schema Viewer. The analyst can also computestatistics, including node degrees, betweenness centrality, and clustering coefficients. Statistical operatorsadd additional columns to the implicated edge and/ornode tables.Now the analyst would like to assess the effects ofusing a different network model. The current modelincludes edges connecting all posters to the samethread. What happens if instead thread respondentsare connected only to the thread initiator? The analystfollows the same modeling path as before, but thistime adds a join predicate: she right-clicks the linkingpath of the network and chooses to filter how the ohctable is linked to itself. In these particular data, a poster has a post id of 0 if they initiated the thread and apost id greater than 0 if they responded to the thread.As these data characteristics are specific to this particular community data, the analyst enters a customizedformula in the resulting dialog: INT1(‘‘post id’’) 0&& INT2(‘‘post id’’) . 0.The formula ensures that the source node alwayscorresponds to the thread initiator and that the targetnode is a respondent. The analyst creates this network,computes betweenness centrality values, compares
Heer and Perervalues for the two models in a scatter plot (Figure2(c)), and notes a high degree of correlation. She decides to proceed with the simpler model connecting onlyinitiators to respondents.The analyst would now like to start comparing thevarious health communities. She revisits her previoussteps, but instead of filtering the forum field, she dragsit to the Split region. The preview display then showsentries for multiple networks—one for each forum.Upon completion, these networks are grouped togetherwithin a subtree of the Schema Viewer. Context menusfor the grouping element enables batch invocation ofstatistics for all contained networks (see Figure 13 foran example). The analyst can now continue analyzingthe diverse characteristics of health communities.UI designThe previous scenario illustrates a subset of the modeling and visualization functionality supported by Orion.We now describe the UI components in detail. Alongthe way, we outline additional functionality, such asthe ability to merge multiple sets of edges and construct ‘‘rollup’’ graphs via node aggregation.Schema viewer. The Schema Viewer (Figure 1(a))provides an overview of all data tables in the currentdata set and supports data manipulation. Source datatables and generated edge tables are indicated by icons.Table attributes are displayed using icons indicatingtheir data type, with special annotations for primaryand foreign key fields. Context menus enable analyststo rename and remove both tables and columns, createderived columns using an expression language, specifyprimary keys, and promote values in one or more columns to new node tables. Analysts can also access statistics and visualization options via context menus.Drag-and-drop interactions allow analysts to specifyforeign key relations (by dragging a field on to a primary key with a matching type), import data (by dragging external data files from the operating system), andquery for network models (by dragging fields to theLinker interface).Link specification. The Linker interface (Figure 1(b))is the primary means of defining networks. Analystsstart by dragging desired node types to fields for sourceand target nodes. Orion responds by computing thepossible linking paths between the source and targetnodes and displays the results in a table. Users canselect the resulting paths to include those edges withinthe resulting network model.Filtering. Analysts can drag-and-drop fields to specify filtering criteria (Figure 1(f)). Filters can be117created for any table involved in the network. Oriongenerates dynamic query widgets—selection lists andrange sliders—based on the data type. Correspondingpredicates are then applied during network construction to limit the nodes and edges included in the finalgraph. In addition to single-table predicates, analystscan specify filtering criteria directly on joins. Filterablejoins are presented in a context menu when an analystright-clicks a linking path. Currently, Orion only supports user-defined join predicates specified as Javacode statements.Splitting. An alternative to filtering is to split a network into a collection of subgraphs. Examples includeinspecting time slices and splitting on categorical variables (e.g. health forums). To specify subdivision criteria, a user first drags a node or edge field to the Splitregion (Figure 1(g)). Orion then displays a widgetenabling further parameterization (Figure 3). Networksgenerated by splitting appear in the Schema Viewer asgrouped collections that support batch operations.Orion supports splitting by categorical variables tocreate separate networks that isolate a given node oredge attribute value. For quantitative and temporalattributes, users can specify window functions; bothsliding windows (which sequentially cover a domain)and anchored windows (which extend from fixed reference bounds) are supported. Of course, not all suchsplits are useful: naively splitting on a node’s primarykey results in a collection of singleton graphs. In thisspecial case, Orion instead interprets the split as arequest for subgraphs centered at each node and provides a graph distance control. Analysts can extract allnodes and edges within a specified graph distance toisolate egocentric networks. For example, a distance of1.0 includes all neighbors, a distance of 1.5 includesall neighbors and edges between them, a distance of2.0 includes all nodes within two hops, and so on.Rollup. When specifying desired node types viadrag-and-drop, typically the primary key of a nodetable is used. If analysts instead drag-and-drop a nonkey field, an aggregated network will be constructedthat uses the unique field values as individual nodes(cf. PivotGraph7). The underlying nodes are groupedaccording to the requested field; edges between groupsare tallied to provide an aggregate representation ofthe underlying graph.Multiple edge sets. By selecting multiple linkingpaths, Orion allows analysts to construct networks withmultiple edge sets. When multiple paths are selected,the linking interface enables controls for choosing anaggregate function for merging edge sets (Figure 1(e));options include basic logical (or, and) and arithmetic(count, sum, product) operations. For arithmetic
118Information Visualization 13(2)Figure 3. Network splitting operations supported by Orion: (a) subdivision by category, (b) sliding windows, (c) anchoredwindows, and (d) subgraph extraction.operations, analysts can also provide numerical weightsfor each edge set.Preview and confirmation. As analysts manipulatesettings within the linker display, a preview panelupdates in response (Figure 1(d)). Analysts can reviewthe number and size of all tables generated and inspectthe values of individual tables. Once an analyst is satisfied with the linking definition, they can click the‘‘Add Network’’ button to add all resulting tables tothe Schema Viewer.Visualization. Orion also supports visualizations: tabledisplays, basic data graphics (bar and scatterplot charts),node-link diagrams, and matrix views (see Figure 2).Visualizations are shown in a separate window with different visualization types accessible via tabbed panes.These windows include a schema viewer showing onlythe data tables implicated in the current visualization.Orion uses the Java implementation of the Protovis specification language33 to generate these visualizations.Analysts can parameterize a display using filtering,sorting, zooming, and visual encoding controls. Nodelink diagrams use a force-directed layout algorithmbased on a physical simulation. Matrix rows and columns can be sorted by node attributes or by linkage tohunt for patterns within the data. Layout and sortingfacilities are included among the analytic operatorsdescribed in section ‘‘Network analysis.’’ As our interactive data transformation methods constitute the primarycontributions of this article, we leave consideration ofadditional visualization facilities to future work.network modeling. While relational tables
Orion draws on related work in graph visualization, analysis tools, and data management. We discuss selected relevant projects below. Graph visualization techniques Researchers have devised a variety of visualization techniques for networks.2 Two common representa-tions used in social network analysis are node-link dia-