Transcription
MetaTrader5 User Guide
ContentsOpen an accountNetting or Hedging AccountsWhere to check your account typeMarket WatchSymbolsSpecificationBarsTicksPlacing a tradeNew orderOne click tradingDepth of marketChartMaximum barTimeframesDrawingChart view functionsDocking chartWindow/chart viewsMetaQuotes language editorRegister a virtual serverSignal serviceStrategy testerTradeHistoryHow to produce a report of your trading lsA showcase of trading signalsThe main parameters of trading signalsTrade statistics, growth, equity & balanceRisks, distribution, news and reviews of trading signalsVisualizing a signal on a chartSubscribing to a trading signalThe report on copied tradesArticlesCode baseExpertsJournalHelp topicsConclusion Other ThinkMarkets 1314151616161616161717171717181818
IntroductionWelcome to the ThinkMarkets MT5 User Guide.If you have used MT4 in the past you will notice that much of the functionality in MT5 remains the same. Therefore, this guide isdedicated to the learning how to use the more technical features and new functions within MT5.If you’re looking for a guide on how to place trades in general then please visit our Learn to Trade tutorials on our websiteat https://www.thinkmarkets.com/en/learn-to-trade/. These guides will teach you general skills on how to trade CFDs withThinkMarkets.
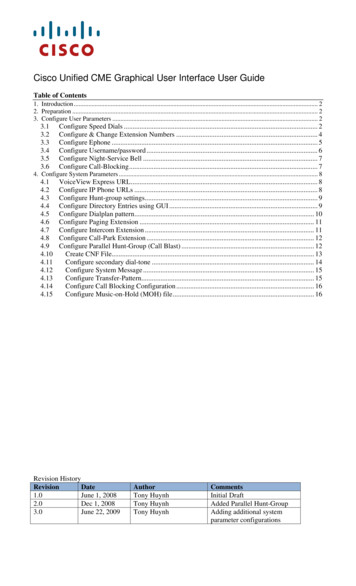
Getting startedSide panelTop panel and drawing instrumentsHere you can find MarketWatch, Navigator, Symbolsand TicksIt contains Auto trading, Virtual server, Chart functions, Signalservice, all the Drawing tools and TimeframesToolboxCharts panelHere are all your current trades, History of yourtrades, News, Mailbox, Calendar, Company,Market, Alerts, Signals, Articles, Code base,Experts and Journal.Charts of specific trading instruments (by your ownchoice), Trading functions (Buy/Sell), One clicktrading and Depth of market
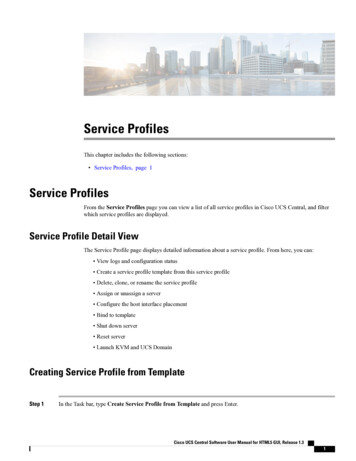
Open an accountTo open a new MT5 account, please visit your ThinkPortal - https://portal.thinkmarkets.com/en/loginThen select Trading Accounts from the menu. Select whether you want a new live or demo account and choose MT5 as yournew account option. The details of your new account will then be displayed, as well as emailed to you.Please note that unused accounts will be deleted after 30 days.Netting or Hedging AccountsHedging system allows you to open as many positions you want in one symbol. There is no limitation to the number ofpositions you can hold at the same time. Positions are additionally opened after one another. Your current position does notchange. Below example shows executions of two 1.0 lot EURUSD trades simultaneously.You can see two separate positions opened on EURUSD. Hedging account is very common execution method. Basically, thisaccount type allows multiple open positions on one single symbol.On the other hand, Netting system will simply limit your trading activity in terms of open positions. As you can only have oneopen position for one symbol. The examples show execution of two consecutive 1.0 lot EURUSD trades.Where to Check YourAccount TypeMT5 allows users to trade using either Netting orHedging accounts. After account creation, userscan identify if their account is netting or hedgingby looking at “Journal” tab of “Trade” window.
Market WatchThe Market Watch window provides an overview of pricedata of financial instruments: quotes, price statistics and tickchart. It also provides details of contract specifications andOne Click Trading options.At the market watch, you can list/hide interested financialinstruments and other price data such as spread, high/low,times and source. The displayed data can be configured inthe context menu. For example, you can show the “Source”field — the provider of the financial instrument liquidity.Double-clicking on one of the instruments opens a newposition opening window. A symbol chart can be openedby dragging it to the chart viewing area using a mouse(Drag’n’Drop); in this case windows of currently open chartswill be closed. If you hold down “Ctrl” while dragging, thechart is opened in a separate tab, and other charts remainopen.You can add new symbols at ‘click to add’ field. Availablefinancial instruments will appear as you type. Also, you canright click on market watch and click “Show All” to list allavailable products at once. Alternatively, you may click “HideAll” to make them disappear.SymbolsSymbols is a page where you can find information abouta specific symbol. Go View Symbols or click “Symbols”by right click on market watch. Here, you can find contractspecification of a symbol, also, you can retrieve bars or ticksto see historic data.SpecificationYou can browse symbol properties of each financial product.You may see contract size, maximum/minimum trade size,swap long/short rate and trading hours, etc. Basically everyinformation you need to know while trading.BarsYou can retrieve historic data of bars. You can choose a timerange and select timeframe (M1, 15M, 1H, etc.). Historic dataincludes Open, High, Low and Close. These can be exportedExcel .csv file, simply click “Export Bars” located at thebottom of the window.TicksYou can retrieve BID and ASK of a symbol at specific timerange. Again, you can export this into an Excel .csv file byclicking ‘Export Ticks’ button located at the bottom of thewindow.
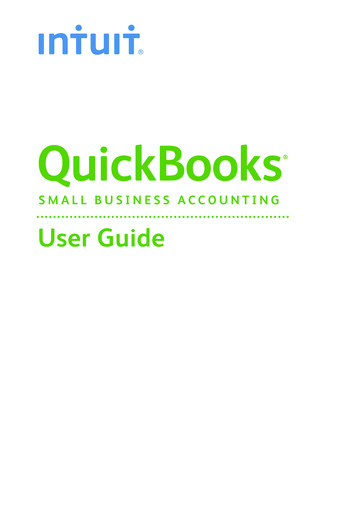
Placing a TradeThere are multiple ways to place a trade in MT5. This section will discuss the various ways you can place a trade.New orderThe first way is selecting the “New Order” button orpressing F9. This will bring up the standard MT5 orderwindow. Tick chart – Displays the tick chart, which is themovement of the last decimal place of the symbol. Redprice is Ask, Blue price is Bid. Symbol – Defaults to the active chart. However, youcan choose any available pair to place a trade on. Type – Choose whether you want to place a tradeat Market (Market Execution) or Pending order. If youselect a Pending order, further options will appear soyou can choose whether you want to place wither aBuy Stop, Buy Limit, Sell Stop, Sell Limit, Buy StopLimit and Sell Stop Limit. For further informationon Pending order types please visit - ne/help/trade/general concept/order types Price – Price level at which you want to place yourPending order. Stop Loss – Price level at which you want to exit thetrade if in loss. Take Profit - Price level at which you want to exit thetrade if in profit. Comment – Add a comment to your trade. Bid / Ask Prices – The active market Bid price andAsk price.One all the details above have been chosen, if it is a MarketExecution trade you can press either the “Sell by Market” or“Buy by Market” buttons to place the trade. If it is a Pendingorder type click “Place” button.One Click TradingAnother way to place a trade is via the One-Click Tradingmethod. One-Click Trading allow you to place an orderdirectly in the market without the above-mentioned NewOrder window appearing. To choose this option you mustfirst go to Tools menu Options Trade tab and selectOne-Click trading option.You can select this by either selecting the Trade Panelbutton in top left corner of the Window or right clicking onthe chart and selecting One Click Trading (or ALT-T)When you click either the SELL or BUY buttons above youare placing an at Market Execution order at the currentlydisplayed prices and specified volume, i.e. 1.00 lots. You
can simply press the up or down arrows to increase ordecrease the volume you want to place, or type in thevolume directly.Please note that when selecting price levels for either entryor exits, those prices are never guaranteed to be filled atthe exact levels. Slippage may occur and we recommendyou familiarize yourself with our Fair execution and slippagepolicy here - regulation/fair-execution-policy/Another function of One-Click Trading allows you to place apending order by right-clicking on the chart/window at theprecise level you want.If you right click above the current price level it will presentyou with the Sell Limit and Buy Stop order options. This willplace the order directly at the volume you have selected inthe Trade Panel above. Therefore, you can change that preset volume within Trade Panel.Depth of MarketThere is one more way you can place orders in MT5, usingthe Depth of Market window. Click the Depth of Marketbutton in top left of the chart/window or press Alt-B.This will bring up the standard MT5 order window.The Depth of Market window allows you to zoom in on thetick chart price levels and graph whilst giving you the abilityinstantly place your orders from within the same window.By clicking on the either the “Sell” or “Buy” button youare placing your order at Market Execution, at the volumespecified, i.e. 1.0 lot.By clicking on the arrows you are placing a Pending order,relative to the price. Simply hover the mouse cursor over thearrows to familiarize yourself with the types of orders.If you click in above the price level you are entering in witheither a Sell Limit or But Stop order at the volume specified.If you click in below the price level you are entering witheither a Sell Stop or But Limit order at the volume specified.You can also set Stop Loss and Take Profit levels in ticks,next to where you set the Volume of order.Once your order has been placed it will be displayed underthe Trade column.
ChartAppearance and properties of each chart in the terminalcan be set up individually. To do so, user must execute the“Chart – Properties” menu command. You can also accessthis by pressing F8. These actions result in appearing ofthe “Properties” window that can be used for setting of thecolour of various elements of the chart (the “Colours”) tab: Background – chart background colour; Foreground – colour of axes, scales, OHLC line; Grid – chart grid colour; Bar Up – bar up, shades and fringing of the BullCandle body; Bar Down – bar down, shades and fringing of the BearCandle body; Bull candle – colour of the Bull Candle body; Bear candle – colour of the Bear Candle body; Line chart – line chart and Doji bars; Volumes – volumes and levels of open positions; Ask price line – colour of the Ask line; Last price line - colour of the Ask line; Stop levels – levels of stop orders (Stop Loss andTake Profit).Maximum BarCharts show up to 100,000 bars by default. However, onsome occasions you can only see few or limited number ofbars in a chart. Then you can modify chart settings from“Tools – Options – Charts”. The number of bars in one chartcan be set from 5000 to unlimited.If your trading device’s CPU load and RAM is available andcan process the larger numbers of bars smoothly, you mayincrease the number of bars accordingly. Vice versa, if yourdevice cannot afford high load of bars, consider loweringnumber of bars in a chart.TimeframesTo set timeframes of a chart, you can look for “Timeframes”.Please go to “View Toolbars tick Timeframes”.This will bring up below timeframe scales. Now you cantarget a chart and choose how much each bar/candle/linerepresents in time.Additionally, users can choose from more timeframeoptions on MT5. Simply right click on the chart and look for“Timeframes” arrow.
DrawingMT5 supports drawing tools to help users do chart analysis.They can draw using below pre-installed drawing tools.You can access this by clicking “View – Toolbars – LineStudies”. Basic drawing tool appear in the toolbox includesline drawing, texting box.Additionally, you can access more drawing tools by rightclicking on drawing tools and click “Customize”. You canadd or remove from “Available buttons” and “Selectedbuttons”.Chart View FunctionsDocking ChartThe trading platform allows detaching financial symbolcharts from the main terminal working area.This feature is convenient when using multiple monitors.Thus, you may set the main platform window on onemonitor to control your account state and move your chartsto the second screen to observe the market situation.To detach a chart from the terminal, disable the “ Docked”option in its context menu. After that move the chart to thedesired monitor.Window/Chart ViewsWhen working with multiple charts on one screen you canalso press the following button (or press Alt-R) to allow allcharts to fit in the one screen.Simply click the Maximize button on the selected chart tomaximize that chart again.You can also Zoom in and Zoom out on charts, using thetoolbar buttons or keys (zoom in) and – (zoom out).By selecting the Window menu you can arrange theWindows in the way that you like. Cascade – puts all windows/charts on top of eachother. Tile Horizontally – Fits all windows/charts horizontallyacross the screen. Tile Vertically – Fits all windows/charts vertically acrossthe screen.
MetaQuotes Language EditorThe MetaQuotes Language Editor gives a trader the abilityto create customized Indicators, Expert Advisors andScripts. They can either be created by the inbuilt MQLWizard or by coding in the programming language knownas MQL5 which is native to MetaTrader 5. Indicators – Allow you to display objects on chartsthat can help you to signal when certain price or otherindicator criteria is met. Expert Advisors (EA) – Are programs that cancontinually run to automatically produce signals ortrades. Also known as Robots or algorithms. Scripts – Are like programs that can produce a signalsor trades; however, they run one time and do not havethe ability to run continuous.To access the MetaQuotes Language Editor in your MT5platform either find it on the toolbar, Press F4 on thekeyboard.Alternatively, go to Tools menu MetaQuotes LanguageEditor.For more information on the MetaQuotes Language Editorand MQL5 press F1 for the user guide or visit - https://www.mql5.com/en/codeRegister a Virtual ServerThe Virtual Server service allows you to run your ExpertAdvisor trading strateg
Introduction Welcome to the ThinkMarkets MT5 User Guide. If you have used MT4 in the past you will notice that much of the functionality in MT5 remains the same.