Transcription
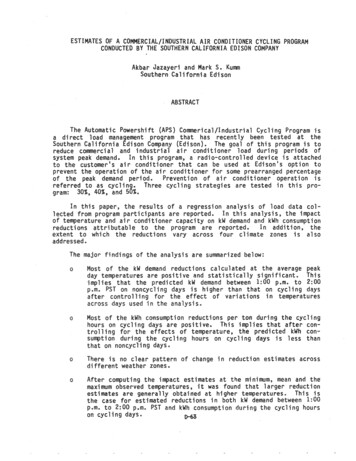
ESTIMATES OF A COMMERCIAL/INDUSTRIAL AIR CONDITIONER CYCLING PROGRAMCONDUCTED BY THE SOUTHERN CALIFORNIA EDISON COMPANYAkbar Jazayeri and Mark 58 KummSouthern California EdisonABSTRACTThe Automatit Powershift (APS) Commerical/Industrial Cycling Program isa direct load management program that has recently been tested at theSouthern California Edison Company (Edison). The goal of this program is toreduce commercial and industrial air conditioner load during periods ofsystem peak demand. In this program, a radio-controlled device is attachedto the customerBs air conditio.ner that can be used at Edison's option toprevent the operation of the air conditioner for some prearranged percentageof the peak demand period Prevention of air conditioner operation isreferred to as cycl i ng8 Three eycl i ng strategi es are tested in thi s program: 30%, 40%, and 50%@of a regression analysis of load data colIn this analysis, the impactkW demand and kWh' consumptionattributable to the program are reportede In addition, thewhich theons vary across four climate zones is a-lsoI"'Ul"&"'ll't :im partipants are reported tenm'era1tUr e and air c6ndioner capacity ons are summarized below:ndings ofMostaverage peakThis1iesthe predicted kW demand betw;een 1:00 p.m. to 2':00 m@ PST on noncycl idays is hi gher than that on cycl i ng daysdaykWnd reductions calculatedtemperatures are pasi . ve and statistically significant@1acrossovari at ions in temperaturess kWhon reductions perduring the cyclinghours on cycling days are positive. This implies that after controll;for the effects of temperature t tilE p:·redicted' kWin consuonthe cycling hours on cycling d:atYs is less thanMost ofthat onng days.no clear pattern of change in reduction estimate!! acrosso . ofor the effectnweather zones After computing the imf)CJ,ct e,s:timates at the mlnlmum, mean and themaxi mum observed temperatures,was found that 1arger reduct ionestimates are generally obtained at higher temperatureSeThis isthe case for estimated reductions in both kW demand between 1:00pem@ to 2:00 p.m PST and kWh consumption duon cycling days D-6!n9 the cycling hours
JAZAYERI ET AL.INTRODUCTIONIn 1980, Edison initiated plans to test the Automatic Powershift Commercial and Industrial Air Conditioning Cycling Program (ell Cycling Program), a direct load management program designed for Edison's nonresidentialcustomers. The program wa planned to continue for thirty months beginningin mid-19Bl.The opportunity to participate in the ell Cycling Program was offeredto a sample of commercial and industrial customers assigned to Edisonls GS-2and A-7 rate classes. The GS-2 rate class includes customers with maximumkW demands ranging from 20 to 200 kW, and the A-7 rate class includes customers with maximum kW demand ranging from 200 to 500 kW@ From this population of customers, the offer to participate was made to customers withmaximum kW demands between 30 and 500 kW. For each weather zone, participants were solicited from four different strata that were based upon maximumkW demand:30-50 kW,50-100 kW,100-200 kW,200-500 kW.The sample wasstrati ed in order to address questions concerning the effect of maximum kWdemand on program impact. In addition, beginning in summer 1982, customersng over 500 kW were given an opportunity to participate in the programoThese customers are subject to the TOUB rate structure@pants in the program were solicited from 34 Edison service dis34 service districts were approximately evenly dist butedacrossve di fferent weather zones that were defi ned for Edi son IS loadmanagement programs. The'Ie weather zones are identified as: mild, moderate, hot, very,super hot. Participants were solicited from fivelones in orderaddressions related to the effect ofnf"l'''lt''n''':: m impact@werelowedselect one of threei ndi vi dua 1 strategy is expressed as thewhich the air conditioner compressorused in the program are 30 , 40%, andi ci pants depend;onrto estimate the program1s impact on parconsumption, magnetic tape recorders were atof 245 customers in GS-2 and A-7 rate clas;nrateassData on the ai r tand; oniof the 245 customers in the GS-2 and A-7 rate classes were alsoThe numbermeters installed in each demand range/weather zoneto the number of volunteered participants in thatzone cell@@In this report, statisticaJ estimates of the impact of the program ondemand and kWh consumption of participants are presented.Thissection of the reportdesc bed the background and purpose of the
JAZAYERI ET Al.ell Cycling Program and the program evaluation.The next section presentsa description of the data used in the analysis including an evaluation ofsample design and allocation. In the final section, the econometric methodsused to analyze the load data and the results from the analysis aredescribed.DATA USED IN THE ANALYSISIn this section, the data used in the statistical analysis of load rlataare described.DataSourcesThree data sources have been used in the statistical analysis of theell Cycl i ng Program. Data used in the ana lysi s of kW demand and kWhconsumpti on were obtai ned from magnet; c tape recorders that recorded theelectricity usage of each participant, from Edison weather stations wheretemperature readings were recorded, and from administrative records.Data on the electricity usage of program participants were obtainedfrom magnetic tape recorders attached to the electricity meters that re-corded the elect city usage of the customer at five-minute intervals@ Thenute interval data were aggregated into 15-minute intervals by Edisonis Load Researchvision@There are 245tomers in TOUS ratecipants in GS-2 and A-7 rate classes and 33 cusass who had magnet i c tape recordersOf the 245@customers in the main sample, 40 had magnetic tape recorders attached totheir air conditisystem to record load data for the air conditioningin isolation@ Consequently, for these 40 customers data are availe oncustomer's total load and the customerls air conditioning load.in the ana lysi s are the projectlist of days with the highest systemisto identify the cycling andring the analysis period. The project plan is used toon on the des; gn of the program, and the 1i st of days ofload is used to select the days included in the analysis.data used in the analysis presented in this report consistnute i nterva 1 temperature readi ngs that were obtai ned fromweather stations selected to correspond to the location of the propants@merging the above data sets, data from 13 cycling days during theJuly 1, 1983 through September 30, 1983 and data from the 13 noncycdays of highest system load during 1983 were chosen for analysis@
JAZAYERI ET AL.By focusing on only these days, evaluatation of the impact of ell CyclingProgram on days that are likely to be cycling days in future programs can bemade.Characteristics of the Load Analysis SampleIn this section the sampling characteristics of the load analysis sample are described. Table I presents the distribution of the main, TOU8, andsubmetered samples b y weather zone. In addition, the main samplels distribution is also reported by kW demand range.As this table indicates, the firms in the main sample are likely tohave more than 100 kW demand, to be in the moderate or mild weather zones,and to have chosen the 30% cycling strategy (see Table II). Because of thesmall number of firms in the hotter zones, the predicted reductions forthese weather zones may exhibit larger variations than similar predictionsfor the mild and moderate weather zones@ Due to a small number of participants in each of the demand ranges in the super hot weather zone, estimatedreductions for this zone are computed for the entire zone rather than by kWdemand range@e IsSampby kw Demand Range and
JAZAYERI ET AL.Similar distributions are also observ"ed for TOUS and submetered samThere are no participants with load data from the super hot weatherzone in either of the samples. Moreover, in both samples the very hotweather zone is represented by only 2 firms."pleseThe distribution of the main, TOU-8, and submetered sample across thecycling strategies is presented in Table II.LOAD ANALYSIS RESULTSIntroductionIn this section the results from the statistical analysis of the ellCycling Program are provided. The primary objective of this analysis is toobtain estimates of the programls impact on the kW demand and kWh consumption of the participants@ Estimates of the program's impact are obtained bycompari ng the parti ci pant group I s kW demand across cycl i ng and noncycl i ngdays. In order to facilitate comparison of the impact estimates across thefi ve weather zones and four kW demand ranges, est; mates are presented forparticipants in each weather zone by kW demand range@Regression analysis is used to estimate the impact of CII Cycling Program on participants' kW demand after controlling for the effects of temperature@ Reduction estimates are obtained by subtracting predicted kWdemand on cycling days from that on noncycling days.Relts from the Re ression Anal sisIn the model used to guide the statistical analysis of load data fromGIl Cycling Program, each part; pating firm is assumed to combine inas labor, raw materials, capital, and energy to produce an output0-61
JAZAYERI ET AL@that is sold in the marketplace@ In this model, it is further assumed thateach firm maximizes its level of output subject to a constraint on the totalcost of the purchased inputs@ Additional factors that are assumed to beimportant determinants of the firm's consumption of inputs are weather characteristics. The maximization of output subject to the cost constraint oninput expenditures yields equations relating the firm1s consumption of inputs to input prices, the firmls output level, and the weather characteristicse In summary, the model yields kW demand equations for each hour of theday that can be expressed in mathematical form as:where:kWit the firm 8 s kW demand on the tth hour of the ith day(t l, 2,@@e,24, i : : cycling, noncycling)p::Q the firmls outputW::::0 ana vector of input pricescharacteristicsicator of whether or not cycl iis conducted@iuenceinputces on the kW demand of program particiis not addressed in the analysis presented in this report for tworeasons@,1cipants in the main sample are assigned to Edi-sonlsGS-2 rate classes, which are very similar@In addition,separate ana lysesbeen performed for these customers and the TOUBin orderdxi ng customers subjectdi fferent rate struc itassumed that1rms face approximately the same1Undercondi ons, input pri ces are noterences i n kWbetweenoring. uaIIU,ofci pants is re 1ated to weatherwhether or not cycling is conducted on theconsideration, and the air conditioner tonnage@e the analysis has been performed by weatherto report results for each weather zone!is assumed to be a proxy for therm e S, its expected that each regression equationrmssimilar scales of output@ For the TOU8 sample, thesis performed by weather zone on ly, due to the fact that all parhave a demand of above 500 kW@ The ana lysi s for the submeterede was a1so performed on a weather zone bas i s on ly because the sma 11nISlf'nl"\"' participants with load data in each weather zone doeslowdion byrange@
JAZAVERI ET ALeTo estimate the ell Cycling ProgramGs impact on the kW demand of participants, the following linear regression equation was specifiedkWitk ao a3t a4 t2 asCi TEMPitk alC; a2TEMP itka6 Ci t alCi t 2 eitk(1)where:the mean kw demand per ton of ai r condi ti oner by fi rmk(k l, 2,oee,N) during the tth hour (t l, 2, , 24) ofthe ith day (i cycling, noncycling)kW;tkCo1 TEMPitk::the mean temperature at the tth hour of the ith daybyfirm k (in fahrenheit degrees)@time of day (t l, 2' @' 24)random error term tk faced t1 i f i :: eye 1i n9inoncyclingo ifthe kthrm at hour t of the ithdayremai ng variables in the equation, such as Ci TEMPitk, forexample, are interaction variables f rmed by multiplying together the variables defined above@The variable tis defined as the square of the timeindex t neeobjectivethe regression analysis is to estimate the reduction indemand of the participants during cycling days relative tononcycling days, equation (1) was used to form a reduction equation. Thiswas done byn9 kW demand per ton equations for cycling days, by settingCj ::: 1, andnoncyc 1 i n9 days by sett i ng Ci 0 sand subt ract i ng thekW demandion for c.yelingfrom that for noncycling days@Thetionon takes on the form: b TEMpNon b TEMpCyc b t b t 2 e1tk2tk34tk(2)the mean kW demand reduction per ton of air conditioningon cycling days relative to noncycling days for firm k athour tTEMpNon ::tk@the mean temperature at the tth hour of noncycling daysfaced by firm k (in Fahrenheit degrees)@D-69-
JAZAYERI ET AloTEMP C the mean temperature at the tth hour of cycling days faced byfirm k (in Fahrenheit degrees).etk random error term for the kth firm at hour tobO' bl , b2 , b3 , b4 parameters to be estimatedEstimating the parameters of the reduction equation (2) instead of the demand equation (1) also reduced the cost of the analysis.The SAS TSCSREG (Time Series Cross Sectional Regression) procedure isused to estimate equation (2) for 17 groups of customers in the main sample,4 groups of customers in the TOUB sample, and 4 groups of customers in thesubmetered sample. The parameter estimates from the regression equationsare used to calculate the predicted kW demand reductions per ton at eachhour of cycling days relative to noncycling days. These reductions can beinterpreted as kW demand reductions on cycling days that are attributable tothe ell Cycling Program. Estimated demand reductions per ton between 1:00p@m to 2:00 p@m@ PST that correspond to the average peak day (September 12,1983) temperatures observed in the sample are presented in Table III@ TableIV presents the estimated kWh consumption reductions per ton during the cycling hours on cycling days relative to noncycling days@ These estimatedreductions are also computed at the average peak day temperatures observedin the sample@ The estimated reductions in these tables can be summarizedaslows:othe kW demand reduct; onscul atedthe average peak day temperares are1 positive when statistically significant, except for thesubmetered accounts in the very hot weather zone. Thi simp 1i es thatkW demand between 1:00 p@m. to 2:00 p@m@ PST on noncyct n that on cycling days after controlling for theons inres across days used in the ana 1s oonsng the cycling hours on cycling daysaverage peak day temperatures are all positive whencant, except for the submetered accounts in the'is implies that after controlling for the effects ofpredicted kWh consumption per ton during the cyclinging days is higher than that on cycling dayseoois no earweather :zones.of change in reduction estimates across direduction per ton estimates do not exhibit a clear pattern ofchange across di fferent kW demand ranges@Thi s mi ght be due to thefact that reductions are estimated on the per ton basis and customersth larger kW demand generally possess larger air conditioningcapacity@
JAZAYERI ET AL.olarger reduction per ton estimates are generally obtained at highertemperatures. However, increases in temperature do not increase thenumber of statistically significant reduction estimates. Not surprising, the significance of an estimated reduction generally seems todepend on the number of participants in the cell.Table III EstimatedkW Demand Reductions per Ton between 1:00 p.m@2:00 p.rn. PST at the Average Peak Day Temperatures#toWeather ZonekW [98.12][98.15].1233**@2381**[95.30]@0967-.0394[78@ 14]'**'*Super Hotnfa[90.66]. . sTOU8Very Hot[81.96 ][81 @96]200. r··' .3367**average peak day temperatures between 1:00 p@m@ to 2:00 p@m. PST are reported in brackets@gni cant at 95% confidence level@sicant at 99% confidence level@icates that there re no data or insufficient data in the cell.
JAZAYERI ET Al.Table IVEstimated kWh Consumption Reductions per Ton during theHours on Cycling Days at the Average Peak Day TemperaturesWeather ZonekW DemandRangeMildModerateHotVery HotSuper 910nfa.4187**50-100.9165**1 566**-.4736nfa1.584**Submetered***nfa0 .1697gni cant at 95% confidence level.significant at 99% confid nce level@indicatesare no data or insufficient data in the cell@
Southern California Edison ABSTRACT The Automatit Powershift (APS) Commerical/Industrial Cycling Program is a direct load management program that has recently been tested at the Southern California Edison Company (Edison). The goal of this program is to reduce commercial and industrial air conditioner load during periods of system peak demand.

