Transcription
AUTOMOTIVE LEAD-ACID BATTERYSTATE-OF-HEALTH MONITORING SYSTEMRoss KerleyThesis submitted to the faculty of the Virginia Polytechnic Institute and State University inpartial fulfillment of the requirements for the degree ofMaster of ScienceInElectrical EngineeringChair: Dong S. HaKwan-Jin KohQiang LiJuly 30, 2014Blacksburg, VirginiaKeywords: Lead Acid Battery, State of Charge, State of Health 2014 Ross Kerley
Automotive Lead-Acid Battery State-of-Health Monitoring SystemRoss KerleyABSTRACTThis thesis describes the development of a system to continuously monitor the battery in a carand warn the user of an upcoming battery failure. An automotive battery endures enormousstrain when it starts the engine, and when it supplies loads without the engine running. Note thatthe current during a cranking event often exceeds 500 Amperes. Despite the strains, a car batterystill typically lasts 4-6 years before requiring replacement. There is often no warning of when abattery should be replaced and there is never a good time for a battery failure.All currently available lead-acid battery monitoring systems use voltage and current sensing tomonitor battery impedance and estimate battery health. However, such a system is costly due tothe current sensor and typically requires an expert to operate the system. This thesis describes aprototype system to monitor battery state of health and provide advance warning of an upcomingbattery failure using only voltage sensing. The prototype measures the voltage during a crankingevent and determines if the battery is healthy or not. The voltage of an unhealthy battery willdrop lower than a healthy one, and it will not recover as quickly.The major contributions of the proposed research to the field are an algorithm to predictautomotive battery state-of-health that is temperature-dependent and a prototype implementationof the algorithm on an ARM processor development board.
ACKNOWLEDGEMENTSI would like to acknowledge and thank a number of people and organizations that have helpedmake this thesis a reality.Dr. Dong Ha for providing me with the advice and support to see this project through.Dr. Kwan-Jin Koh and Dr. Qiang Li for the commitment of their time and effort in support of myresearch.Ji-Hoon Hyun for his neverending assistance with the batteries.Interstate Batteries in Salem, VA for providing the batteries for this experiment.Virginia Tech Fleet Services for initial battery measurements that started this work.This work was supported by the Center for Integrated Smart Sensors funded by the Ministry ofScience, ICT & Future Planning of Korea as Global Frontier Project (CISS-2-3).My parents for always encouraging me to do the right thing, and for being proud of everything Ihave done.My girlfriend Stephanie for all of her love and patience despite the distance between us, and mymind often wandering to batteries instead of our conversations.iii
TABLE OF CONTENTSABSTRACT . IIACKNOWLEDGEMENTS . IIITABLE OF CONTENTS . IVLIST OF FIGURES . VIILIST OF TABLES . IX1INTRODUCTION . 12BACKGROUND . 52.1QUANTIFYING STATE OF HEALTH IN LEAD ACID BATTERIES . 52.2EXISTING METHODS APPLICABLE TO CAR BATTERY SOH . 62.2.1 Coup de Fouet SOH Estimation. 62.2.2 Impedance Based SOH Estimation . 72.2.3 Battery Cranking Voltage Based SOH Monitoring Method . 82.2.4 Parity-Relation Based SOH Monitoring . 102.2.5 Commercial In-car SOH Monitoring . 122.2.6 Commercial Out-of-car SOH Estimation. 132.33PROPOSED RESEARCH AND CONTRIBUTIONS . 14PROTOTYPE STATE OF HEALTH MONITORING SYSTEM . 163.1STATE OF HEALTH ESTIMATION ALGORITHM . 163.1.1 Algorithm Overview . 16iv
3.1.2 State of Charge Estimation . 183.1.3 Voltage Sampling. 213.1.4 Slope Detection . 223.1.5 Valley Detection . 233.1.6 State of Health Estimation . 243.1.6.1Temperature Consideration . 253.1.6.2ΔV1 Consideration . 263.1.6.3ΔV2 Consideration . 263.1.7 Example SOH Estimation . 263.24HARDWARE PROTOTYPE . 27TESTING PROCEDURE AND EXPERIMENTAL RESULTS . 304.1TESTING PROCEDURE . 304.2BATTERY AGING TESTBENCH . 314.2.1 Requirements . 314.2.2 Hot Water Bath . 314.2.3 Battery Charging and Discharging. 334.2.4 Data Logging . 364.3TEST CRANKING . 364.4RESULTS . 38v
4.55SERVICE LIFE ESTIMATE . 42CONCLUSION . 435.1FUTURE IMPROVEMENTS . 45BIBLIOGRAPHY . 46APPENDIX A: BATTERY MEASUREMENTS. 49APPENDIX B: BATTERY IDENTIFICATION. 51vi
LIST OF FIGURESFigure 1: Simplified Chemical Reactions in a Lead Acid Battery. 2Figure 2:Thevenin-discharge battery model [3]. . 3Figure 3: Extracted current and voltage waveforms as V-I plot [4] . 4Figure 4: Coup de fouet of a Oldham 2HI275 cell discharged at 275A [9]. 6Figure 5: Typical Battery Voltage Waveforms During Cranking for a Healthy Battery (top) andan Unhealthy Battery (Bottom) [4] . 8Figure 6: Voltage and Current Waveforms of healthy (left) and unhealthy (right) batteries [4] . 10Figure 7: V-I plot of cranking data collected during battery aging process [4]. . 11Figure 8: Battery model during cranking [4]. . 11Figure 9: Battery model parameters as battery ages. Left: Rb, Right: Vloss [4]. 12Figure 10: Delphi Battery Monitoring Device [21]. . 13Figure 11: Midtronics MDX-600 Battery Analyzer [22] . 14Figure 12: Decision Path for SOH Algorithm . 17Figure 13: Lead-acid cell voltage at 25 C as a function of H2SO4 relative density [2] . 19Figure 14: Temperature Coefficient of Open-Circuit Voltage of Lead-Acid Cell as a Function ofElectrolyte Specific Gravity [1] . 20Figure 15: Typical cranking waveform. 23Figure 16: First and second valleys from the waveform given in Figure 15. . 24Figure 17: Typical Cranking Waveform for SOH Estimation . 25Figure 18: ARM development board with daughterboard. . 29Figure 19: Stock tank with foam insulation. . 32vii
Figure 20: Open stock tank with nine batteries and large heater. . 32Figure 21: Slave load controller with cooling fan, power supply, and power resistor. . 33Figure 22: Block diagram of load controller. 34Figure 23: Master load controller. . 35Figure 24: Block diagram of battery aging testbench . 35Figure 25: Graphed data log of charging and discharging a battery . 36Figure 26: Testing the battery of a car . 37Figure 27: Comparison of battery terminal and MCU measurements . 38Figure 28: Crank voltage waveforms for battery #6 . 39viii
LIST OF TABLESTable 1: Lead-Acid Cell Voltage vs Specific Gravity of H2SO4 Electrolyte [2] . 19Table 2: State of Charge vs Specific Gravity of Lead-Acid Batteries [1] . 21Table 3: Estimates of memory usage. . 22Table 4: Individual voltage samples during crank from the circled region of Figure 15. . 23Table 5: Vth1 across temperature. . 25Table 6: Vth2 with various ΔV1 . 26Table 7: Example SOH calculations. (Subset of Table 8) . 27Table 8: Battery #6 data extracted from crank waveforms (Year: 2014) . 40Table 9: Results from ten batteries . 41ix
1INTRODUCTIONThis thesis explores existing methods of automobile starting, lighting, and ignition (SLI) batterystate of health (SOH) estimation. Additionally, it presents and tests a novel technique to estimateSOH. SLI batteries wear out after several years, but there is never a convenient time for them toexpire. No advance warning is available in modern cars for an impending battery failure. SLIbattery SOH monitoring would warn the driver that their battery has little life remaining, and thatthey should have their battery tested by a professional or replaced.The strain applied to car batteries is increasing every year. Electrical loads in vehicles, such asentertainment systems and active suspension can require significant amounts of power that mustbe instantaneously supplied by the battery. As our cars become more advanced, these loadsincrease. Additionally, numerous cars that turn off the engine automatically instead of idlingwhen stopped, such as at a red light, are coming to market. These are referred to as ‘microhybrid’ or ‘stop-start’ vehicles. This technology requires that the battery sustains all electricalloads frequently when the alternator is not supplying power, and it increases the frequency ofengine starting. Starting the engine is still the most strenuous role for a car battery. During thecranking event, currents are on the order of several hundred amperes, greater than 1 kA for somevehicles [1].Lead acid batteries are common and are used in automobiles for starting the engine and forrunning the lights and various electronics. They are also used in some electric vehicles such asgolf carts and boats. In addition to mobile applications, they are used in battery backup systemsfor security systems, computers, and telephones. Additionally they are also found in alternative1
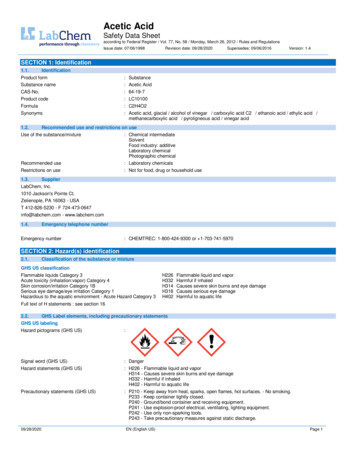
energy systems for off-grid applications. Lead acid batteries are so prevalent because they usecheap and common materials and are easy to produce and recycle [2].Lead acid batteries are a chemical system that stores energy. Discharging the battery converts thestored chemical energy into electrical energy that can be used to perform work. Two electrodes,Pb (Lead) and PbO2 (Lead Oxide) are submerged in a solution of H2SO4 (Sulfuric Acid). PbSO4(Lead Sulfate) forms on both electrodes when discharging. When charging, lead sulfate isreduced to lead and lead oxide. This reaction is shown in (1) and Figure 1. The sulfuric acidsolution is most concentrated when the battery is fully charged ngChargingPositiveElectrodePbSO4 H2O Pb H2SO4PbSO4 H2O PbO2 H2SO4Pb H2SO4 PbSO4 H2OPbO2 H2SO4 PbSO4 H2OFigure 1: Simplified Chemical Reactions in a Lead Acid BatteryThe cranking ability, or maximum discharging current of a battery, is directly proportional to thearea of the lead plates, or electrodes, inside the battery. To maximize this current, which isneeded to start a car, battery designs use gridded electrodes and thin electrodes in parallel.Batteries that require a high capacity generally have thicker plates to give more capacity. To2
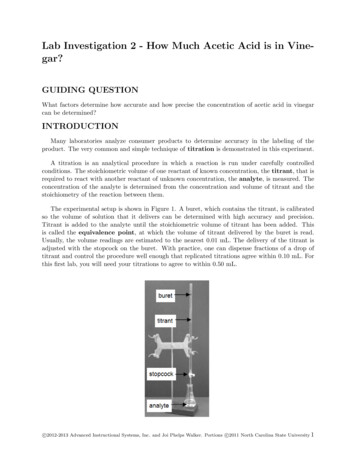
compensate for the reduced capacity due to the parallel thin plates, car starter batteries frequentlyhave higher concentration acid solutions [1].Electrical models of batteries have a wide range of complexity. The least complex models aremerely an ideal voltage source, while the most complex consist of voltage sources and dozens ofcomplex impedances. When simulating and predicting battery performance, the most simplemodel should be used to reduce complexity, but a minimum amount of accuracy is needed. Formany purposes, a Thevenin-discharge model can be used. This model is shown in Figure 2. Itrequires four parameters: Ep, Rp, C, and Ro [3]. These parameters vary with the state of charge(SOC) of the battery, and also with the SOH. This model is quite simple, but for this work aneven less sophisticated model is appropriate [3].RpIbatCIbat RotVbatVbatEp-Ibat*RptFigure 2:Thevenin-discharge battery model [3].Grube presented that the impedance of a healthy battery during cranking is almost purely ohmic[4]. This was tested by taking the voltage and current waveforms during a cranking event, andplotting voltage versus current. These points and the resulting regression are shown in Figure 3.The open circuit voltage (OCV) or no-load voltage is indicated by V0 (intercept voltage). It isapparent that as various currents are drawn from the battery, the voltage is the result of almost3
purely ohmic impedance. Therefore, the Thevenin-discharge battery model can be simplified asonly Ep and Rp for a healthy battery [4]. In Figure 3, the battery resistance is approximately 0.004Ω. With a 500 A load, the voltage drops by approximately 2 V.Figure 3: Extracted current and voltage waveforms as V-I plot [4]There are several aging mechanisms that contribute to performance degradation and end ofservice life. These include anodic corrosion, positive active mass degradation, irreversibleformation of lead sulfate, short-circuits, and loss of water. Of these five mechanisms, two arecommon in automotive starter batteries. The first, grid corrosion, is considered the most“natural” death for a lead acid battery. It is an expected failure mode when the battery isovercharged or held at a high State-of-Charge (SOC) for extended periods of time, such as whendriving a long distance. The second common aging mechanism, positive active massdegradation, is accelerated by numerous shallow discharge cycles [5].4
2BACKGROUNDLead acid batteries have been used in automobiles for many decades to start the internalcombustion engine. A typical car battery lasts about five years before requiring replacement.However, they can wear out in as little as two years or last as many as ten years under idealconditions. When a battery does reach the end of its service life, it is not at an ideal time andthere is often no warning. Therefore, it is advantageous to monitor the battery health and warnthe vehicle operator when a battery is near the end of its life [5], [6].2.1Quantifying State of Health in Lead Acid BatteriesBattery SOH is a quantification of a battery’s electrical ability with regards to storing anddelivering energy [7]. In batteries typically used for storage and slow delivery of energy, SOH isbased on their capacity. This is a relatively simple quantification, which is simply the ratio of thecurrent capacity and the designed capacity. This common method of determining SOH can befound in modern laptops and phones.(2)SOH for car starter batteries is more complicated. Car batteries degrade in both capacity andcurrent delivering ability. A battery could be discharged slowly and still release enough energyto be considered healthy according to (2). However, the battery is unhealthy if it cannot supplyenough current to start the car.5
2.2Existing Methods Applicable to Car Battery SOHThere are several existing methods or systems which can be applicable to car battery SOH. Themost relevant methods are described in this section.2.2.1Cou
STATE-OF-HEALTH MONITORING SYSTEM Ross Kerley Thesis submitted to the faculty of the Virginia Polytechnic Institute and State University in partial fulfillment of the requirements for the degree of Master of Science In Electrical Engineering Chair: Dong S. Ha