Transcription
computer programsMercury 4.0: from visualization to analysis, designand predictionISSN 1600-5767Clare F. Macrae, Ioana Sovago, Simon J. Cottrell, Peter T. A. Galek, PatrickMcCabe, Elna Pidcock, Michael Platings, Greg P. Shields, Joanna S. Stevens,Matthew Towler and Peter A. Wood*Received 28 June 2019Accepted 15 October 2019Edited by J. M. Garcı́a-Ruiz, Instituto Andaluz deCiencias de la Tierra, Granada, SpainKeywords: Mercury; computer programs; crystalstructure visualization; structure comparison;crystal packing.Cambridge Crystallographic Data Centre, 12 Union Road, Cambridge CB2 1EZ, UK. *Correspondence e-mail:wood@ccdc.cam.ac.ukThe program Mercury, developed at the Cambridge Crystallographic DataCentre, was originally designed primarily as a crystal structure visualization tool.Over the years the fields and scientific communities of chemical crystallographyand crystal engineering have developed to require more advanced structuralanalysis software. Mercury has evolved alongside these scientific communitiesand is now a powerful analysis, design and prediction platform which goes a lotfurther than simple structure visualization.1. IntroductionThe program Mercury was first launched by the CambridgeCrystallographic Data Centre (CCDC) in 2001 as a focusedcrystal structure visualization tool. Mercury has since becomeestablished as a prominent crystal structure visualizer with afree-to-access version available for any researcher and manythousands of citations of its first two versions [at the time ofwriting 4608 for Mercury 1.0 (Macrae et al., 2006) and 5459 forMercury 2.0 (Macrae et al., 2008)].In the 18 years since the launch of Mercury 1.0, the fields ofchemical crystallography (Watkin, 2010) and crystal engineering (Nangia & Desiraju, 2019) have changed dramatically,with much more sophisticated analysis of crystal structuresnow commonplace, alongside both knowledge-based andquantum chemical analysis of structures.Over this time period, and very much driven by the requestsof these communities, Mercury has become much more than avisualizer. Mercury is now a powerful platform deliveringanalysis, design and prediction functionality alongside visualization. The Mercury interface also acts as a hub for widercapabilities of the software suite built around the CambridgeStructural Database (CSD) (Allen, 2002; Groom et al., 2016).In the past decade in particular, the capabilities of Mercuryhave developed significantly, with a focus towards pharmaceutical and agrochemical solid-form informatics. These newcomponents,1 collectively referred to as CSD-Materials, havebeen significantly driven by the CCDC’s industrial CrystalForm Consortium (https://www.ccdc.cam.ac.uk/Community/1The 13 components available in CSD-Materials at the time of writing are asfollows: Motif Search, Crystal Packing Feature Search, Crystal PackingSimilarity, BFDH Morphology, MOPAC Calculations, UNI IntermolecularPotentials, Hydrogen Bond Propensity, Co-Crystal Design by MolecularComplementarity, Full Interaction Maps, Hydrate Analyser, Solvate Analyser,Conformer Generator and DASH. The original three components available inthe Materials Module of Mercury in 2008 were Motif Search, Crystal PackingFeature Search and Crystal Packing 14092J. Appl. Cryst. (2020). 53, 226–235
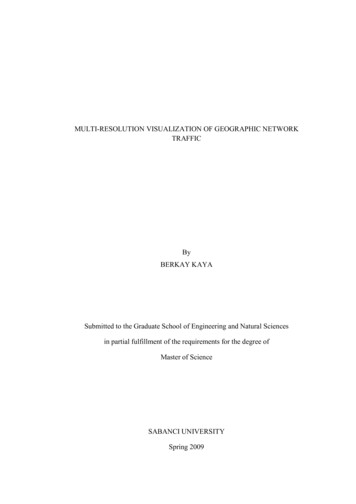
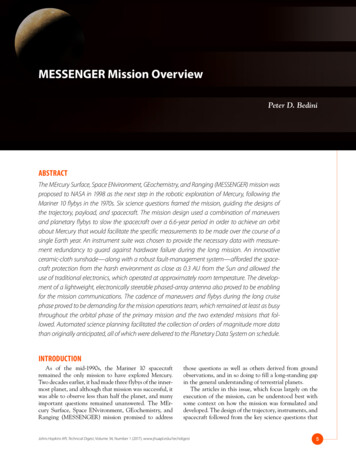
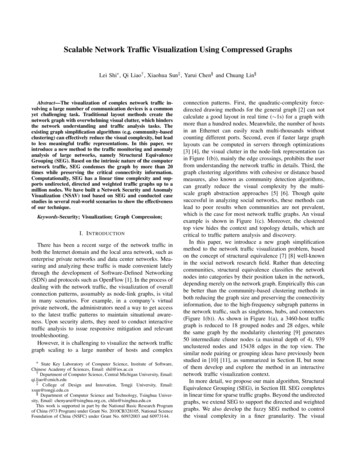
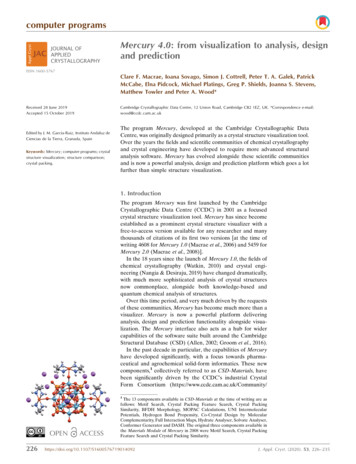
computer programscrystalformconsortium/), which was first introduced in August2008. The discussions and direction provided by the CFCmembers over the years, which continue today, help to ensureboth scientific value and clear industrial applicability in thisarea.Mercury is used by a very broad community, both geographically and by subject area, and the CCDC continues to bedirected by the needs of the scientific communities in how weplan the next iterations of the software. This paper in particular will illustrate the evolution of Mercury over the pastdecade from version 2.0, described by Macrae et al. (2008), upto the recently released version 4.0.2. General Mercury functionality2.1. Ray-traced graphicsThe need to communicate science effectively continues tobe a key challenge for scientists in outreach, education,research and industry. In order to make the generation ofhigh-quality graphics and movies for science communicationeasier, Mercury now includes an intuitive interface to the raytracing rendering program POV-Ray (Persistence of Vision,2013). This package, included in the Mercury installation,makes it straightforward to create high-resolution images(such as shown in Fig. 1) direct from Mercury, for use, forexample, on journal covers, posters and presentations. Withinthe same interface, accessible through ‘POV-Ray Image’under the ‘File’ menu in Mercury, movie frames of a rotatingstructure can also be quickly and easily generated, thencombined together into a movie file.accurate models directly from any standard 3D structural fileformat (including MOL2, XYZ, SDF, PDB, CIF and RES).The options, available under the ‘File’ menu using ‘Print in3D’, include both colour (VRML) and monochrome (STL) 3Dprinting file output to provide compatibility with a wide rangeof existing 3D printers. There is also a lot of flexibility tocontrol the size of the models and the thickness of all aspectsof the models, including atom, bond and intermolecularcontact thicknesses (Wood et al., 2017).2.3. Structure editingA range of structural editing features have been availablefor some time in Mercury (under the ‘Edit’ menu), which allowediting of bond types, editing of elements and addition of newatoms such as hydrogen atoms amongst a range of otheroptions. Newer features are now included which allow theediting of the symmetry of a crystal structure as well as theunit-cell settings. Functions to transform molecules using thesymmetry operators of the space group, as well as to applyinversion and translations, are also included. These newfeatures can be helpful when comparing structures, as well asin preparing input files for quantum calculations.Different choices of space-group setting can now beexplored, so a P21/c structure with the b axis unique could betransformed to a P21/n structure with the c axis unique, or astructure in R3 with hexagonal axes could be transformed torhombohedral axes. Origin shifts can also be applied in each2.2. 3D printingScience communication and education can also be aided byphysical models representing structures. Mercury has recentlybeen extended with functionality to generate 3D printablemodel files (in STL or VRML format) for experimentallyFigure 2Figure 1High-resolution image, generated with Mercury and POV-Ray, of aheteropolyoxoniobate-based system (CSD refcode LOFHOF; Zhang etal., 2014) using the ‘Shiny’ material property.J. Appl. Cryst. (2020). 53, 226–235Packing diagrams for CSD refcode SUGCEC (Mochida et al., 1992). (a)Unedited, presented in the original space group of C2/c with symmetryelements displayed. Note that the molecule lies on a twofold axis parallelto the b axis. (b) Unedited, with molecules coloured by symmetryoperation (other than centring) and symmetry elements shown. (c)Edited to the subgroup C2, setting 1, origin choice [0, 0, 1/4], withsymmetry elements displayed. (d) Edited to the subgroup C2, withmolecules coloured by symmetry operation (other than centring).Transforming to C2 from space group C2/c retains only the twofold axesof the space group and increases the number of formula units in theasymmetric unit to two.Clare F. Macrae et al. Mercury 4.0227
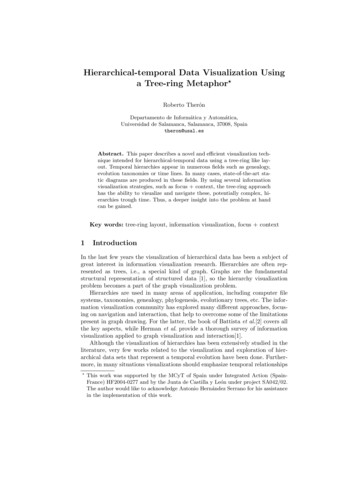
computer programscase. Going beyond changing settings within a space group,there are now options to change the space group entirely andallow the user to traverse the allowed maximal subgroups (asexemplified in Fig. 2). In each of these cases, only the allowable options are presented to the user, ensuring that the usercan not unknowingly perform transformations that are notwithin the space-group definition provided by InternationalTables for Crystallography, Vol. A (2016).2.4. Molecular shellsHydrogen bonds have been displayed in Mercury since thefirst release of the program, and hydrogen-bonding interactions from a central molecule to neighbouring molecules canbe easily explored using the ‘expand hydrogen bond’ functionality. There has been no functionality introduced so far,though, that is specifically tailored to other types of interactions, such as – stacking. The ability to build and view thewhole, or a subset, of a packing shell for a given molecule orpart of a molecule is a useful tool for understanding of nonhydrogen-bonding interactions.To this end, it is now possible to calculate a molecular shellfrom a selected molecule, substructure or cluster of moleculesusing the ‘Molecular Shell’ option under the ‘Calculate’ menu.The neighbouring molecules that contain an atom within theuser-specified distance from the selection are displayed(Fig. 3). Aromatic interactions can be explored, for exampleby selecting an aromatic ring in the base molecule andcalculating a shell of molecules around the ring that extends tocontacts within the sum of the van der Waals radii overlap 0.5 Å. As an option to simply explore structures, there is alsonow a feature to simply click into space and reveal the closestsymmetry-generated molecules to that area of the structure(‘Picking Mode’ ‘Reveal Symmetry-Generated Molecules’).3. CSD-CommunityA new menu has been introduced to Mercury including accessto the components within CSD-Community – the suite ofsoftware and services provided free of charge by the CCDCfor the benefit of the scientific community. From withinMercury it is now possible to link directly to the CSD webinterfaces, allowing deposition and structural search of theCSD. There is also a special CSD Teaching ionalresources/teaching-database/), as well as software for checking CIFsyntax (Allen et al., 2004) and unit-cell dimensions (CellCellCheckCSD; CellCheckCSD/). CSD-Community includes inaddition a free version of Mercury incorporating a range offeatures for crystal structure visualization.4. CSD-SystemThe recently added ‘CSD-System’ menu in Mercury collectstogether links to the full set of CSD-System components,including WebCSD, ConQuest, Data Analysis, Mogul andIsoStar.4.1. WebCSDWebCSD provides a web-based platform alongside thedesktop CSD-System software. This web interface, coveredunder the normal CSD licence, provides new or occasionalusers with a simple and intuitive route to access the CSD,without the need to install any software locally. CSD structures can be accessed just by using a standard web browser onany computer, tablet or mobile device. Multiple search optionsare available, based on text queries, 2D chemical structuresketches, molecular formulae or unit-cell dimensions. Userscan access the latest entries that have been added to the CSDon a continually up-to-date basis. WebCSD version 1 (Thomaset al., 2010) was first launched in 2009, and in 2017 an updatedversion built on newer technologies was introduced (https://www.ccdc.cam.ac.uk/structures), which can be accessed via amenu item in Mercury.4.2. Data search and analysisFigure 3Diagram showing the molecular shell, calculated using a radius of van derWaals 0.5 Å, from the phenyl ring fragment of a molecule in AABHTZ(Werner, 1976) (highlighted in yellow). The packing shell generated herehighlights the aromatic interactions present in the structure. Full packingshells of molecules can be calculated by selecting a molecule (rather thana fragment) as the base unit.228Clare F. Macrae et al. Mercury 4.0In previous versions of Mercury (Macrae et al., 2008),structures and associated parameters from ConQuest searches(Bruno et al., 2002) could be imported and viewed withinMercury. This has now been significantly extended throughthe ‘Data Analysis’ functionality in Mercury, providing ainteractive interface connecting data analysis (spreadsheets,statistics and plotting of results) with 3D visualization of thestructures (Sykes et al., 2011). In this way, searches fromConQuest can be directly transferred into Mercury to analysecorrelations or reveal statistically significant parameterswithin large data sets; alternatively, numerical data from a rawdata file (.csv or .tsv) or a CSD-Materials packing featuresearch can be analysed.In addition to ordering and filtering results through the dataspreadsheet, the ‘Data Analysis functionality can calculate aJ. Appl. Cryst. (2020). 53, 226–235
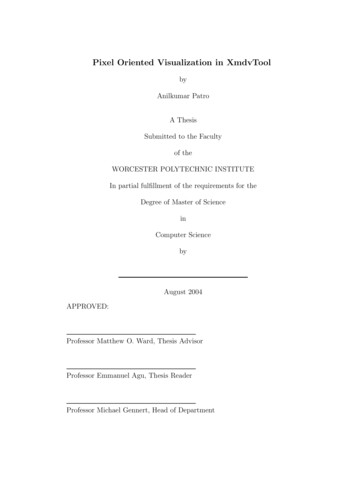
computer programsis used to show the donor-to-acceptor distance (O N) as thethird variable, with short distances in blue and longerdistances in yellow to red. The greatest density of observedhydrogen bonds can be noticed in the region of 1.5–1.9 Å forthe H N distance and 160–180 for the O—H N angle,dominated by green data points representing O N distancesof around 2.6–2.8 Å. Longer interactions (coloured yellow tored) are observed to have a greater spread in angle, with someof the longest contacts having angles close to 100 . The veryshortest hydrogen bonds, 2.5 Å (blue), exhibit closer H Ndistances as well as a tendency towards linearity, such that thehydrogen-to-acceptor and donor-to-hydrogen distances canbecome comparable in extreme cases. In these kinds of plots,the user can click on any point and immediately view thestructure corresponding to that data point in the Mercuryvisualizer.Figure 4Scatterplot of O—H N angle ( ) against H N distance (Å) forcarboxylic acid to pyridine type nitrogen–hydrogen bonds (O C—OH N C), with the O N distance (Å) shown using a colour scale.variety of statistical descriptors for a distribution (such as themean, variance, standard deviation and skewness), as well ascreating new descriptors through arithmetic operations withthe ‘Calculator’ functionality. It is also possible to carry outadvanced analysis with correlation matrices and principalcomponent analysis. A range of charting/plotting options isprovided, including histograms, polar histograms, scatterplots(Cartesian/polar/heat) and heat maps. Subsets of the data canbe easily created and highlighted to further explore trends.The plots are fully interactive with the 3D visualizer, allowingin-depth investigation of corresponding structures and theirparameters.An example of the output that can be generated is illustrated in Fig. 4, showing a coloured scatterplot of thehydrogen-bond angle (O—H N) versus the hydrogen-toacceptor distance (H N) for a carboxylic acid donating to apyridine-type nitrogen, O C—OH N C. The colour scale4.3. Knowledge-based analysisThe CCDC’s two knowledge bases are key components ofthe CSD-System – these are Mogul (Bruno et al., 2004) forderived intramolecular geometry data and IsoStar (Bruno etal., 1997) for derived intermolecular interaction data. Thesequickly provide focused, chemically specific information onconformation and interactions because pre-derived libraries ofrelevant fragments already exist within the software. Mercuryhas had links to both of these knowledge bases since version2.0, but these links have now been extended further to provideaccess to the desktop applications Mogul and IsoStar if theuser wants to launch those components directly.Mogul contains a hierarchical library of pre-derived distributions from the CSD of bond lengths, valence angles, torsionangles and ring conformations, allowing fast and chemicallyspecific assessment of intramolecular geometry [see Fig. 5(a)for an example of a Mogul distribution]. IsoStar also containspre-derived data, but in the form of scatterplots of intermolecular interaction distributions from which contoursurfaces can be determined [see Fig. 5(b) for an example of anIsoStar scatterplot].Figure 5Illustration of CSD knowledge bases, showing (a) the Mogul distribution relating to a specific S—C—N—C torsion angle (bonds in the torsion arecoloured green) in the meloxicam succinic acid co-crystal (CSD refcode ENICOU; Cheney et al., 2010) and (b) the IsoStar scatterplot relating to a ketonecentral group interacting with an alcohol probe group (contact density shown as contour surfaces).J. Appl. Cryst. (2020). 53, 226–235Clare F. Macrae et al. Mercury 4.0229
computer programs5. CSD-MaterialsCSD-Materials enables structural scientists to explore, analyseand design solid-state materials with the potential to understand structural stability, or explore new or modified solidform properties. The components within CSD-Materialsprovide in-depth understanding of experimentally determinedcrystal structures as well as insight into the likely solid-formbehaviour of new compounds. The capabilities include moresophisticated assessment of preferred intra- and intermolecular interactions, going beyond the scope of Mogul andIsoStar (‘Conformer Generator’ and ‘Full Interaction Maps’),as well as tools to help design new solid forms.A collection of tools to help interpret and compare packingtrends in crystal structures with CSD data using packingfeature, similarity and motif searches (Wang et al., 2014) wasintroduced in Mercury 2.0 (Macrae et al., 2008). Since version2.0, the quality of structural data and continued expansion insize of the CSD, as well as demand from industrial users, hasallowed the development of further sophisticated statisticaltechniques harnessing this information. In this vein, datadriven tools for prediction and analysis have been developedin CSD-Materials, such as automated polymorph risk assessment via hydrogen-bond propensity (Majumder et al., 2013;Feeder et al., 2015), co-crystal screening (Sandhu et al., 2018)and the conformer generator, which allows geometryexploration. In addition to these tools, new components haverecently been introduced to allow the user to analyse complexsolvate and hydrate structures (see Sections 5.3.2 and 5.3.3).5.1. Polymorph assessmentA knowledge-based method has been developed to assessthe risk of polymorphism based on hydrogen bonding. Thismethodology applies statistical analysis using logistic regres-Figure 6Hydrogen-bond propensity chart of levetiracetam (CSD refcodeOMIVUB; Song et al., 2003). The magenta circle represents the observedstructure.230Clare F. Macrae et al. Mercury 4.0sion and is trained against observed hydrogen bonds in theCSD (Galek et al., 2007). It results in the generation of allpossible hydrogen-bonding networks for a given system, withknowledge-based assessment of the likelihood of eachpossible network. This helps significantly in the assessment ofa given crystalline form and is usually applied alongside otheranalytical CSD-based techniques (such as conformationalanalysis and full interaction maps) in a solid-form riskassessment.For example, levetiracetam (CSD refcode OMIVUB) is amonomorphic system with two potential proton donors andtwo acceptor functional groups (Fig. 6). The hydrogen-bondpropensity chart displays all possible hydrogen-bondnetworks, with the most likely hydrogen-bond networkdisplayed in the lower-right corner. The observed structure isrepresented as a magenta circle. In this case, the observednetwork is ranked competitively in terms of hydrogen-bondpropensity and it utilizes the functional groups optimally, asdemonstrated by the high mean hydrogen-bond coordinationscore.5.2. Co-crystal designCo-crystals have represented a significant area of interestand development over recent years, with huge potential formodifying and even tailoring physicochemical properties of atarget molecule by co-crystallizing with a second molecularcomponent (co-former). Considering the potential range ofco-formers, a knowledge-based approach to co-crystal designis extremely valuable for assessing the likelihood of co-crystalformation (Wood et al., 2014). This can be considered in twosteps: (1) the screening out of co-formers to remove thosehighly unlikely to yield a co-crystal with the target molecule,and (2) subsequent ranking of the more likely co-formercandidates.(1) Mercury now incorporates virtual co-crystal screeningthrough the ‘Molecular Complementarity’ component underthe ‘Co-Crystal Design’ menu within CSD-Materials. This isbased on calculated quantitative structure–activity relationship molecular descriptors (Fábián, 2009; Galek et al., 2007,2009, 2010), whereby molecules that are observed to co-crystallize tend to have similar properties (e.g. shape, polarity).Threshold values for the molecular descriptors have beendefined, on the basis that the majority of co-crystal entries inthe CSD (90%) have been assessed as likely to co-crystallize(Fábián, 2009). Therefore these thresholds allow co-formersthat are unlikely to be effective for the target molecule to bescreened out prior to starting experimental screening.Assessment is performed for a chosen library of possible coformers against a range of different conformations for thetarget molecule (user-specified or generated using the‘Conformer Generation’ tool).Molecular complementarity analysis has been found to beparticularly effective in cases where co-crystal formation isdifficult. In the case of artemisinin only two out of 75 coformers were successful in experimental screening, but use ofmolecular complementarity analysis would have ruled out 33J. Appl. Cryst. (2020). 53, 226–235
computer programsof those 75 co-formers (44%), boosting the success rate ofexperiments and reducing the time spent (Karki et al., 2010).Details of the co-crystal screening results can also be exported,allowing further investigation: for example, whether coformers with low hit rates only pass with a specific conformation of the target molecule.(2) Once the least likely co-formers have been excluded,Mercury can be used to assist with ranking of co-formers thathave passed the first screening step; this can allow optimization of co-crystallization experiments by trying the co-formersthat are most likely to be effective first. (i) The ‘Motif Search’component (Macrae et al., 2008) reveals the frequency ofoccurrence for different motifs involving functional groups ofa target molecule. This can be utilized to probe which coformers contain motifs that are most commonly observed andthus have a higher likelihood of being successful in co-crystalformation. (ii) The ‘Hydrogen Bond Propensities’ tool withinMercury (see Section 5.1) evaluates the likelihoods of allpossible hydrogen-bond interactions between molecules,taking into account parameters such as competition and sterichindrance (Fábián, 2009; Galek et al., 2007, 2009, 2010). Thiscan be used to compare the best hetero- and homo-hydrogenbond interactions between the target molecule/co-former pair,with a higher difference between the two indicating a strongerhydrogen-bond-based drive towards co-crystallization.5.3. Structure analysis5.3.1. Full interaction maps. A complementary approach toanalyse structures and rationalize the stability of polymorphshas been introduced in Mercury through visualization ofknowledge-based interaction maps around molecules in acrystal structure (Wood et al., 2013). The ‘Full InteractionMaps’ component within CSD-Materials can be used to evaluate the preferred interactions of a molecule (Honorato et al.,2019; Price et al., 2014).For example, Fig. 7 illustrates the full interaction maps for acrystal that exhibits jumping properties, l-pyroglutamic acid,before and after a phase transition. The blue regions of theinteraction maps highlight where donors are expected to beobserved on the basis of CSD data, the red regions indicateFigure 7Full interaction maps shown around one of the molecules ofl-pyroglutamic acid in (a) the (stable) form (CSD refcode LPYGLU07,Z0 3) and (b) the (metastable) form of the compound (CSD refcodeLPYGLU08, Z0 1) (Panda et al., 2015). The circled oxygen acceptor inthe interaction map diagram shown for the form (b) is observed outsideof any preferred acceptor region of the maps (red contours), indicatingthat this hydrogen-bonding interaction has a sub-optimal geometry.J. Appl. Cryst. (2020). 53, 226–235likely acceptor positions and orange regions indicate likelypositions of hydrophobic groups. The interaction maps arescaled relative to the random chance of that particular contactoccurring, so the standard contour surface levels of 2, 4 and 6(with increasing levels of opacity) indicate 2, 4 and 6 timesgreater interaction likelihood than random chance, respectively.Upon heating of l-pyroglutamic acid, crystals of the form[Fig. 7(a); only one of the unique molecules is shown as anexample; Z0 3] convert to the form [Fig. 7(b)], and thisphase transition is observed to induce a jumping motion of thecrystalline material (Panda et al., 2015). In both structures ofl-pyroglutamic acid, full interaction maps show four welldefined hotspots with some additional diffuse interactionregions. In theform [Fig. 7(b)], one of the observedhydrogen-bonding interactions (involving the O atom of thecarboxylic group, circled) lies well outside the expected areaof the relevant acceptor hotspot, indicating that the geometryof this particular interaction is sub-optimal compared withwhat would be expected from CSD data. The full interactionmaps in the form (metastable at ambient conditions) aretherefore not fully satisfied. In contrast, the key hotspots inthe full interactions maps for the form (stable at ambientconditions) are each satisfied by an interaction.5.3.2. Hydrate Analyser. The ‘Hydrate Analyser’ component within CSD-Materials provides a quick and powerfulapproach to analyse even the most complex hydrated structures. This feature provides the capability for the user toinvestigate interactions formed by water as well as to visualizethe space taken up by the water molecule. The hydrogen-bondinteractions displayed by the water molecule are automaticallyclassified on the basis of the ten most common waterhydrogen-bonding motifs found in the CSD (Gillon et al.,2003). The user can identify the hydrogen-bonding motifs byclicking on the motif in the dialogue, which results in thedisplay of the chosen interaction in the 3D visualizer ofMercury.The volume occupied by the water molecule can be calculated under the ‘Water Space’ tab. The calculation isperformed using the same method as the established ‘Voids’feature in Mercury. This functionality can be used to displaythe volume and shape of the space occupied by water in aknown hydrate, as well as to identify the possible presence ofwater in a crystal structure containing voids. The default proberadius is set to 1.2 Å, which is the approximate molecularradius of a water molecule. The user can visualize the waterbehaviour within the crystal structure, whether it is occupyingdiscrete pockets, as in the example displayed in Fig. 8, or isforming channels.Under the ‘Water Interaction Map’ tab, the user can assesswhether the water molecules are occupying the location that isexpected on the basis of the interaction maps. This featureallows calculation of interaction maps around the molecules inthe structure based on a specific water probe.5.3.3. Solvate Analyser. Similar to the ‘Hydrate Analyser’, a‘Solvate Analyser’ component is now available within CSDMaterials. This feature enables a fast analysis of complexClare F. Macrae et al. Mercury 4.0231
computer programssolvate structures, including those with more than one solvent,a mixture of solvents, co-formers and counter-ions, and evenhighly disordered solvate structures. Like in the ‘HydrateAnalyser’, the space occupied by the solvent molecules iscalculated using the same method as is used for calculatingvoids. The tool allows the user to select solvents from thedisplayed structure and calculate the space occupied by thosemolecules. A summary of the hydrogen-bonding motifsdisplayed by the solvent molecules is listed under the ‘SolventH-Bonding’ tab.CSD refcode XUKZIM is an example of a complex solvatedstructure containing a mixture of solvents: dimethylsulfoxideand nitromethane. The space occupied by the solvents withinthe crystal structure can be calculated using the ‘SolvateAnalyser’ and visualized; dimethylsulfoxide and nitromethaneform S-shaped channels along the crystallographic c axis(Fig. 9).5.4. Conformer GenerationFigure 8Calculated water space for fasoracetam monohydrate (CSD refcodePAPNIG; Harmsen et al., 2017) with water molecules occupying discretepockets within the crystal structure.The ‘Conformer Generator’ component uses CSD-derivedrotamer and ring geometry information in order to minimizethe conformation of a molecule or generate a diverse set ofhigh-likelihood conformers for a given input molecule. Energyis not explicitly used as a criterion in the CSD ConformerGenerator (Cole et al., 2018), rather a statistical appreciationof high and low probability conformations based on CSDknowledge. A diverse set of likely conformations for a molecule can be useful for in silico co-crystal screening as well asfor ligand-based or structure-based drug design endeavours.An initial 3D conformation of a target molecule is provided asinput, and from this, a diverse range of conformations can begenerated, with control of the number of conformersproduced (Fig. 10). More information about the methodologyused to generate and rank conformations can be found arecent paper by Cole et al. (2018).5.5. Structure solution from powder dataFigure 9Calculated solvent space for oxide (space shown in cyan) nitromethane (space shown inred) solvate (CSD refcode XUKZIM; Hamann et al., 2002).Crystal structure solution from powder diffraction data canbe performed using the program DASH (David et al., 2006),another component within CSD-Materials. Structures can besolved using simulated annealing approaches within DASH,and the success rate can also be improved by reducingconformational search space using CSD data (Mogul). Thetool has been successfully used to solve structures fromvarious fields including pha
/c structure with the b axis unique could be transformed to a P2 1 /n structure with the c axis unique, or a structure in R3 with hexagonal axes could be transformed to rhombohedral axes. Origin shifts can also be applied in each computer programs J. Appl. Cryst. (2020). 53, 226-235 Clare F. Macrae et al. Mercury 4.0 227 Figure 1