Transcription
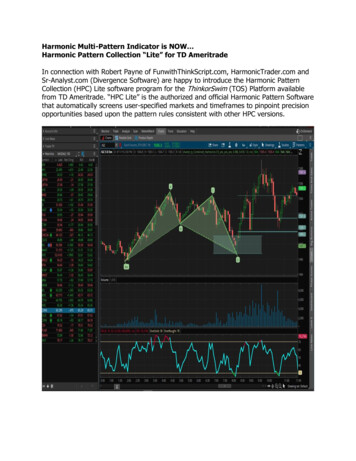
S. Foo and G. Stuart, “Neural network-based EKG Pattern Recognition”, Proceedings of the Southeastern Symposium onSystem Theory (SSST), Tallahassee, FL, March 2000.Neural Network-Based EKG Pattern RecognitionSimon Y. Foo, Geoffrey Stuart*, Bruce Harvey,Anke Meyer-Baese*Department of Electrical EngineeringFAMU-FSU College of EngineeringTallahassee, FL 32310 USASonalyst, Inc.Panama City, FL 32407 USAAbstract— The highly nonlinear chaotic nature ofelectrocardiogram (EKG) data represents a well-suitedapplication of artificial neural networks (ANNs) for thedetection of normal and abnormal heartbeats. Digitized EKGdata were applied to a two-layer feed-forward neural networktrained to distinguish between different types of heartbeatpatterns. The Levenberg-Marquardt training algorithm wasfound to provide the best training results. In our study, thetrained ANN correctly distinguished between normal heartbeatsand premature ventricular contractions in 92% of the casespresented.The neural network was successfully trained to recognizethe difference between a normal heartbeat and a prematureventricular contraction using the Levenberg-Marquardt trainingalgorithm. The Levenberg-Marquardt method was found to be veryfast in converging to a final set of weights (only 9 training epochsfor this project), but a penalty is exacted through memoryrequirements. The memory requirements are proportional to thesize of a Jacobian matrix involved in the calculation.Keywords: Neural networks, electrocardiogram, pattern recognitionI. INTRODUCTIONElectrocardiography is an important tool in diagnosing thecondition of the heart. Early detection of heart diseases/abnormaliescan prolong life and enhance the quality of living throughappropriate treatment. Numerous research and work on analyzingEKG signals such as those by [1],[2] have been reported recently.There are three basic difficulties in using artificial neuralnetworks to recognize cardiac patterns in EKG data. First was thelarge number of samples per heartbeat in the typicalelectrocardiogram; a high sample rate requires a large input layerand hidden layer, and consequently causes training difficulty. Thesecond obstacle was due to variation in voltage baseline caused byequipment setup or from electric fields induced by other musclesduring patient movement. The third obstacle in network preparationwas the variation in signal polarity due to electrode placement; thedirection of voltage deflection of the electrocardiogram outputvaries depending on which electrode placement is chosen. Byfiltering the data and resampling at 1/10th the original samplingfrequency, the number of input nodes required for the neuralnetwork was reduced to a reasonable size for training on a personalcomputer. Even though the sample rate was reduced, most of thesignal information were still retained. To overcome the difficultyposed by the variations in signal polarity and baseline, a detectionfunction was created based on a difference equation applied to eachchannel of electrocardiogram data. After filtering, resampling, andcreating a detection function, the data was ready to be applied to aneural network.An artificial neural network designed for this task wascreated using a feedforward network with one hidden layer and oneoutput layer. A form of a tapped delay line was used for the inputlayer, where one node was used for each sample in the inputwindow. The network window width was set to the maximum timewidth of a heartbeat. A separate spike detection function triggerednetwork response when a heartbeat was centered on the neuralnetwork input layer.Normal HeartbeatThe healthy heartbeat follows a characteristic pattern.First the pacemaker cells in the sinoatrial node generate an electricalimpulse. This impulse is then distributed across both atria throughconduction channels, causing the atria to contract, or depolarize.Shortly after the atria contract, the initial electrical impulse reachesthe atrioventricular node. The atrioventricular node is the top of aconduction channel known as the bundle of His. The impulsetravels through the bundle of His into the right and left bundlebranches and finally to the Purkinje fibers. The Purkinje fibersspread the electrical impulse into the lower regions of the right andleft ventricles. This causes a bottom-up contraction (depolarization)to occur in both ventricles. While the ventricles contract, the atriarelax, or repolarize. Finally, the ventricles repolarize, and a shorttime later, the cycle begins again.The EKG registers a characteristic pattern for theheartbeat cycle, shown in Figure 1. Each major event in the cycle islabeled with a letter of the alphabet, beginning with the letter P, andending with the letter U. The initial atrial contraction will registeras a small amplitude deflection termed the P-wave. Typicallywithin 100 msec following the P-wave is a large amplitudedeflection, termed the QRS complex, representing the ventricularcontraction. Within 200 msec following the QRS complex, the Twave will emerge marking the repolarization of the ventricles. Afinal deflection, termed the U wave, is sometimes observed as partof ventricular repolarization.The specific values of the deflections and amplitudes foreach portion of the heartbeat vary with the axis of the electrodes andwith the individual heart. Analysis of both the spacing of thedeflections and the shape (or morphology) can diagnosemalfunctions of specific parts of the heart and some diseases.ArrhythmiaAccording to Weinberg [3], abnormal heart operation(arrhythmia) can be classified into three categories: abnormalimpulse formation; abnormal impulse propagation; andsimultaneously abnormal impulse formation and propagation. Theresults of arrhythmias can include premature atrial contraction(PAC), premature ventricular contraction (PVC), atrial flutter,ventricular flutter, atrial fibrillation (atria quivering and noteffectively pumping), ventricular fibrillation (ventricles quivering
and not effectively pumping), bradycardia (heart rate slowing below1-Hz or 60 beats per minute (bpm)), and tachycardia (heart raterising above 1.7-Hz or 100 bpm).] End of ventricular flutter/fibrillationIsolated QRS-like artifactChange in signal qualityRhythm changeII. EKG DATA DESCRIPTIONSeveral sets of EKG data were collected from varioussources in preparation for this project. One set of data, from theMassachusetts Institute of Technology Beth Israel Hospital [4]-[5],was especially useful, and comprised all of the material used to trainand test the neural network. Four one-minute files each providedtwo channels of electrocardiogram information sampled at 360-Hz,with each significant cardiac event annotated in a separateannotation file. The annotations furnished the basis for training theneural network. An excerpt of a data file is shown below:Data 011A plain text file contains the data arranged in threecolumns of roughly 21,000 integers; the first column is the samplenumber, the second column is the Channel 1 output, and the thirdcolumn is the Channel 2 output with electrocardiogram channel dataproportional to voltage as indicated by this relation:V [in mv] (X [in A/D units] - 1024)/400An annotation file accompanies each data file, where a time stampand beat code marks every heart beat. The following excerpt showsinformation for 8 2402NNNNNNAN000000000000000000000000The first column is the time in seconds (minutes:seconds.tenths), thesecond column is the sample number corresponding to the firstcolumn of the data file, the third column is the beat annotation code,and the rest of the columns were unused for this project. Fivedifferent beat codes reside in the four one-minute files. They areNVLRANormal beatPremature ventricular contractionLeft bundle branch block beatRight bundle branch block beatAtrial premature beatSome non-beat annotations can also be found in the data, with thefollowing definitions:[!Start of ventricular flutter/fibrillationVentricular flutter waveEach of the four data files was recorded independently withdifferent patients and different electrode placements, and thedescriptions are as follow:Case 100A male, age 69, with no significant EKG abnormalities (there is oneatrial premature beat in the example). The EKG leads are MLII andV5. This file contains 74 annotated beats, all normal (N) except 1premature atrial contraction (A).Case 200A male, age 64, with high-grade ventricular arrhythmias (includingventricular bigeminy and three multifocal ventricular couplets in theexample). The EKG leads are MLII and V1 (in this example, V1 isof very low amplitude and is practically unusable). This filecontains 86 annotated beats, a mix of normal (N) and prematureventricular contractions (V).Case 203A male, age 43, with atrial fibrillation, high-grade ventriculararrhythmias (including a 3-beat VT in the example) and a noisecorrupted recording. The EKG leads are MLII and V1. This filecontains 103 annotated beats, a mix of normal (N) and prematureventricular contractions (V).Case 207A female, age 89, with first degree AV block, left bundle branchblock, and ventricular flutter. The EKG leads are MLII and V1.This file contains 101 annotated beats, a mix of Right Bundle Block(R), premature ventricular contractions (V), and Left Bundle Block(L). Many of these beats have unique shapes that could warrantadditional categories.Table 1 shows a summary of the EKG information on the 4 patients.EKG Data AppearanceFigure 2 shows a 2-second sample of a normal heartbeatdata. The two channels from the data file are plotted together. Itcan be observed that there is a different baseline voltage for each ofthe two channels. This condition could be a problem for trainingthe neural network. A look at the power spectral density of onechannel of the signal, Figure 3, shows that most of the signal energyis in the low frequencies, especially below 20-Hz. Also, theharmonics of 60-Hz hum from the power supply are noticeable.III. PREPROCESSING OF EKG DATAMuch of the EKG data is sampled between 300-Hz and 1kHz. A simple way to present the data to the neural network is touse a tapped-delay line, where each node accepts a separate sample.The tapped delay line consists of p unit delay operators. Thememory depth of a tapped delay line increases linearly with itsorder. We use the tapped delay line as the input layer for thenetwork where each input node (delay term) represents one sampledvalue. For example, a 360-Hz signal would require 360 input nodesto process 1-second worth of EKG data. The 360 input nodes comefrom the fact that there are 360 sampled values available per secondsampled at the original sampling frequency of 360Hz. However, as
observed later, the preprocessing of data greatly reduced the numberof input nodes required of the neural network.The major steps in pre-processing the EKG data are:(1) Baseline normalization(2) Filter and resample(3) Spike IdentificationBaselineEKG signals tend to have a wandering baseline. Electricfields from non-heart muscle movement, among other effects, cancause the mean voltage to increase or decrease for a particularpatient. Also, different recordings on the same or different patientswill generally have differing baseline voltages. This creates aproblem in training the neural network. Either the training matrixmust include training vectors over a spread of baseline voltages, orthe raw data must be processed to present a standard baseline to thenetwork. In our case, we chose to process the raw data. Specifically,the raw data was filtered and resampled.Centering Patterns of Interest on the Input LayerIn order to train the network to recognize a standard QRScomplex, the network must be trained to recognize when a likelypattern is centered across the input "window." One way toaccomplish this is with a "neural network does all of the work"approach which creates a training matrix that presents all of thedesired patterns centered in the input window, as well as shiftedacross the window in single-sample steps. For example, to train thenetwork to recognize a 30-sample triangular pulse centered in theinput window 90 samples wide, the training matrix will include 120vectors, each vector shifted one node to the right until the entirepattern has traversed across the window, as well as one vectorcontaining all zeroes. The network will be trained to produce anegative response for all vectors except the one centered across thewindow. The problem with this approach is that the network willtrain to always produce the same zero output; the error will be verylow even if it never responds to any signal. To aid the trainingprocess, extra copies of the centered pulse can be mixed in with theoriginal 120, which will increase the size of the training matrix andraise the training error to give the training algorithm significantdirection for minimization.A better approach, as used in our case studies, is topreprocess the data and provide a trigger to the neural network thatindicates a pulse of interest is centered on the input layer. Thistriggering method makes it possible to use only signals of interest tobuild the training matrix.Data PreparationTo address the size and wandering-baseline issues, asingle detection function was generated based on the two channelsof data included in each of the four files. Van Bemmel [2]discusses the use of transformations to aid the detection of variousEKG complexes. The detection function used in this study is a twosided difference equation:d (i ) A(i 1) A(i 1) B(i 1) B(i 1)2222(1)where A represents the first channel (Channel 1) of data and Brepresents the second channel (Channel 2). The index i runs from 2to n-1, where n is the number of samples in the file.When this detection function is created, high frequencysignals cluttered the low frequency information. It was found thatfiltering the data supplied to the right side of the detection function,to 1/10 of the 180-Hz Nyquist frequency, allowed the characteristicsof the heartbeat to pass through while removing the unwanted 60Hz noise. The filtering removes some amplitude on the QRScomplexes, but otherwise retains the original signal information.Figure 4 shows effect of filtering EKG raw data while Figure 5shows the impact of filtering on the power spectral density. Noticethe 60-Hz noise and harmonics are removed.Figure 6 shows the detection function output using rawchannel data. The QRS complexes are quite visible, but the P and Tdata is almost totally covered by noise. Since this signal lies mostlyin the low frequencies, the size of the information can be reducedby refiltering and resampling at 36-Hz. The EKG contains highfrequency components (noise) which are irrelevant for a correctpattern recognition. To get rid of those components we apply a lowpass filter to the EKG signal and from Figure 5 we see that we haveto resample the new obtained filtered signal with a samplingfrequency of 36 Hz.The power spectral density in Figure 7 shows the initialdetection function using raw channel data (dashed line), thedetection function using filtered channel data (dotted line), and thefiltered detection function created with filtered channel data (solidline). As observed in Figure 7, the 60 Hz noise and its harmonicswere removed.Figure 8 shows the 36-Hz detection function afterresampling as compared to the 360-Hz detection function. Thefeatures are well defined and the size of the data is reasonablysmall. To address the problem of centering a single heartbeat on aneural network window, a simple spike detection routine waswritten that identified all spikes whose normalized amplitudes werelarger than 0.5. After identifying the spike, the routine skippedahead by a fixed number of samples in order to only identify thespike once. This method proved very successful in identifyingalmost all of the normal and premature ventricular contractionswithin 1 sample.Spike IdentificationThe spike identification routine provided the sample indexnumbers for amplitude spikes that exceeded a nominal threshold of0.4 normalized input level. After acquiring a spike, the routineraised the index by a "look-ahead" factor, nominally 8 samples, or222 msec. This straightforward method of identifying spikes wasvery successful at picking out each of the pulses identified in thecorresponding annotation file, but required human intervention toadjust the threshold and look-ahead factor. Four files were passedthrough the spike detector, file 100, file 200, file 203, and file 207.File 100 used an amplitude threshold of 0.4 and a look-aheadwindow of 6. A total of 74 pulses were annotated, and 73 pulseswere identified (the first pulse was rejected due to insufficientnumber of samples in the window). 15 pulses were detected earlyby 1 sample, where 1 sample represents 28 msec; a difference of 1or 2 samples either early or late subjectively seems reasonable forthe applications discussed later.File 200 used an amplitude thresholdwindow of 8. A total of 86 pulses weredetected. Out of the 86 detections, 1samples, 13 detected early by 1 sample,by 1 sample.of 0.5 and a look-aheadannotated and all 86 werewas detected early by 2and 11 were detected lateFile 203 used an amplitude threshold of 0.4 and a look-ahead
window of 8. A total of 103 pulses were annotated with 102 pulsesidentified (1 pulse amplitude was too low for the threshold). Of the102 pulses identified, 20 were detected early by 1 sample, and 4detected late by 1 sample.File 207 used an amplitude threshold of 0.4 and a look-aheadwindow of 6.A total of 45 non-fibrillation pulses were annotated, and all 45 weredetected. Several fibrillation pulses were annotated but were nottrained for, since this was the only file that contained them. Of the45 pulses identified, 2 were detected early by 2 samples, 1 wasdetected early by 1 sample, and 2 pulses were detected late by 1sample.IV. EKG PATTERN RECOGNITIONFeedforward neural networks [6] with backpropagationalgorithm have been a popular approach to pattern recognition. Thebackpropagation algorithm uses a gradient descent technique tominimize the error between the desired output(s) and the actualoutput(s). An alternative to gradient descent is a nonlinear leastsquares algorithm known as the Levenberg-Marquardt[7] algorithm.This algorithm is an approximation to Newton's method, and can beused to train neural networks more quickly than the standardbackpropagation algorithm.Training a feedforward neural network requires anoptimization of a nonlinear objective function with a continuoussecond derivative. This is guaranteed for differentiable activationfunctions and resulting error functions. In practice, the LevenbergMarquardt often finds better optima for a variety of problems thanother optimization methods and is typically 10 to 100 times fasterthan the gradient descent backpropagation method.Levenberg-Marquardt Training AlgorithmThe Levenberg-Marquardt algorithm switches betweengradient descent and solution of a quadratic-form equation. Whenthe weights place the network near a minimum in the error energysurface, a quadratic matrix function approximates the shape of thesurface which can be solved in a single step. If the assumedfunction does not fit very well, and if the network is relatively farfrom a minimum, the network error will be pushed upward. Insteadof letting the network error rise, the Levenberg-Marquardtalgorithm changes a scaling factor, µ, and recalculates the functionsolution. As the scaling factor increases, the solution changes to agradient descent type of minimization. In the Levenberg-Marquardtalgorithm, both the first and second derivatives of the error functionmust be calculated and manipulation of large matrices is necessary.A C-language computer program was written toimplement the Levenberg-Marquardt algorithm.Supportingroutines include the Nguyen-Widrow [8] initialization code that setsinitial weight values for the neural network and a Choleskyfactorization routine [9] for inverting the Hessian term of theLevenberg-Marquardt algorithm.V. RESULTSThe goal of the neural network training is to recognizepremature ventricular contractions as a separate pattern from normalheartbeats; all four data files contained several beats of at least oneof these categories. The neural network was set up with twooutputs; one for a normal heartbeat signal and the other for apremature ventricular contraction signal. The annotation files wereused to identify all normal and premature ventricular contractionswhile a small number from each file were used to train the network.File 100 provided 10 normal beats, file 200 provided 10 normalbeats and 10 premature ventricular contractions, file 203 provided10 normal beats and 10 premature ventricular contractions, and file207 provided 10 premature ventricular contractions. So, a total of60 pulses were used to make up the training epoch. Thepreprocessing of the data made a very compact training set, with awindow of 17 rows and an epoch size of 60. For this reason, thenetwork trained very rapidly, in 9 epochs, using less than a minuteof CPU time on a personal computer. The Levenberg-Marquardttraining algorithm can train very quickly, however demandsrelatively large memory resources. A Jacobian matrix is generatedcontaining [(S0 1)*S1 (S1 1)*S2] columns by a number of rowsequal to the training patterns (S0 represents the number of inputnodes, S1 is the number of hidden nodes, and S2 is the number ofoutput nodes).Our network used 17 input nodes, 10 hidden nodes, and 2output nodes, for a total of 24,240 elements in the Jacobian matrix.The 17 input nodes come from the fact that there are 17 rows in thewindow. The inputs to the neural network came from the detectionfunction refiltered and resampled at 36-Hz. The number of hiddennodes (10) is empirically determined – a tradeoff betweencomputations overhead and optimal pattern discrimination. Thehidden nodes can thought of as feature detectors; however, toomany of them can result in a “grandmother” network. The two (2)output nodes are required to determine whether the heartbeat fallsunder Normal (N), Right Bundle Block (R), Left Bundle Block (L),or premature ventricular contractions (V). Training times becomelonger and computer memory requirements more demanding as thenumber of input, hidden, and output nodes increases.Figure 9 shows the Levenberg-Marquardt training recordfor this neural network. As the figure shows, only 9 epochs wereneeded to train the network to a sum-squared-error of 0.02.The results of our neural network EKG patternrecognition can summarized as follows:File 100File 100 had one error, only checking for normal heartbeats, but thatwas for a premature atrial contraction for which it had not beentrained. So the error was discarded, leaving a total of 0 misses outof 73.File 200File 200 missed 8 of 86, where a miss was counted as normal errorof less than 0.5 (or a premature ventricular error of more than 0.5) for 90.7% correct.File 203File 203 missed a total of 9 out of 101, both normal and prematureventricular contractions, for a total of 91.1% correct.File 207File 207 missed 5 out of 23 premature ventricular contractions, for atotal of 78.2% correct.The overall results were 22 misses out of 282 trials, for ascore of 92.2% correctly matching the pattern. The metrics used tograde the network were simplistic, but the network trained quickly.Given a larger training database, the network could be used in amore sophisticated way to identify specific patterns.VI. CONCLUSIONS
detectors." Frontiers of Engineering in Health Care: Proceedingsof the 4th Annual Conference of the IEEE Engineering in Medicineand Biology Society, pp. 205-210. New York: IEEE Press (1982).[6] D.E. Rumelhart, G.E. Hinton, and R.J. Williams, "LearningRepresentations by Back-Propagating Errors," Nature, vol. 323, pp.533-536, 1986, cited by M.T. Hagan, M.B. Menhaj, "TrainingFeedforward Networks with the Marquardt Algorithm," IEEETransactions On Neural Networks, vol. 5, no. 6, pp. 989-993,November 1994[7] M.T. Hagan, M.B. Menhaj, "Training Feedforward Networkswith the Marquardt Algorithm," IEEE Transactions On NeuralNetworks, vol. 5, no. 6, pp. 989-993, November 1994[8] Nguyen, D., B. Widrow, "Improving the Learning Speed of 2Layer Neural Networks by Choosing Initial Values of the AdaptiveWeights," International Joint Conference of Neural Networks, vol.3, pp. 21-26, July 1990.[9] W. H. Press, S.A. Teukolsky, W.T. Vetterling, B.P. Flannery,Numerical Recipes in C, The Art of Scientific Computing, 2d ed.,Cambridge University Press, New York, p. 97, 1992.0.15VentricularContraction0.1VII. onVentricularRepolarizationP-0.1T-0.15Special thanks to Dr. George Moody of the MassachusettsInstitute of Technology for providing the EKG data needed for thisproject. The authors are also grateful to John McDonnell of NRAD,Steve Marinello of Siemens, Dr. Janice Jenkins of University ofMichigan, Nancy Vincent of Hewlett-Packard, Joe Hamrick ofNorth Florida Anesthesia Group, Joe Rudolph of CSS, Dr. JamesCook and the staff of Cardiology Associates, and Corrie Freund ofMedtronics for all their invaluable discussions and support.-0.2-0.2500.10.20.30.60.4 0.5Time (sec)0.80.70.9Figure 1. An EKG pattern illustration.VIII. REFERENCESTwo Channels of Normal Heartbeat Data0.50.40.3Voltage (mv)[1] T. Conde, "Automatic Neural Detection of AnomaliesElectrocardiogram Signals," Proceedings of the IEEE ICNN,Orlando, FL, June 28 - July 2, 1994, pp. 3552 - 3558.[2] J.H. van Bemmel, "Recognition of ElectrocardiographicPatterns," Handbook of Statistics, vol. 2, ed. by P.R. Krishnaiah andL.N. Kanal, Elsevier Science Publishing Company, Inc., New York,pp. 501-527, 1982.[3] G.M. Weinberg, “Mechanisms of Cardiac Arrhythmias,” Designof Cardiac Pacemakers, ed. by J.G. Webster, IEEE Press, NewYork, pp. 34-63, 1995.[4] G.B. Moody, R.G. Mark, "The MIT-BIH Arrhythmia Databaseon CD-ROM and software for use with it." Computers inCardiology 1990, pp. 185-188. Los Alamitos, CA: IEEE ComputerSociety Press (1990).[5] R.G. Mark, P.S. Schluter, G.B. Moody, P.H. Devlin, D.Chernoff, "An annotated ECG database for evaluating arrhythmiaNormal Heartbeat Filtered 18 Hz0.2Voltage (mV)Neural networks using the Levenberg-Marquardtalgorithm can be trained quickly to correctly recognize differentheartbeat patterns. Possible applications of this type of networkinclude storage of historical cardiac condition for different patients,detection of complex patterns from a pacemaker sensor, and in thesensing lines of a defibrillator. The use of neural networks torecognize heartbeat patterns may provide a means to store ahistorical record of a patient's cardiac condition for latercomparisons. In this application, a patient's digitized EKG is usedto train a neural network to recognize all of the different heartbeatpatterns. The weights from this training would then be stored in arelatively small electronic medical history file. At a later date, thestored weights could be loaded into the neural network and a new,up-to-date EKG could be passed through the network, which woulddetect any changes that had occurred to the heartbeat patterns sincethe last measurement. The latest EKG could now be used to retrainthe network and store the latest weights in an updated medicalhistory file. In the second application, a neural network could beused in an artificial pacemaker unit to identify conditions thatrequire the pacemaker to fire in place of the natural pacemakercells. A pattern recognition unit could be placed on line with theintra-cardiac electrodes feeding a tapped delay line trained to detectand classify the owner's heartbeats. When the neural networkoutput rises past a threshold, the artificial pacemaker would triggera heartbeat. Otherwise, the artificial pacemaker would allow theheart's natural pacemaker cells to control the heartbeat. Finally, aneural network could be used in a defibrillator in a similar means asthe artificial pacemaker. The network would be trained torecognize conditions suitable for a defibrillator pulse, then triggerthe defibrillator. In summary, the heartbeat is an area that proves tobe a rich in applications for signal processing and neural networkpattern recognition techniques.0.20.10-0.1-0.2-0.300.51Time (sec)1.5Figure 2. Two Channel Data from MIT File 1002
Power Spectral Density for Normal Heartbeat 360Hz SamplingDetection Function, Raw Signals5010x 104.54-13.5Sampling UnitsNormalized quency120140160018000.51Time (sec)1.52Figure 3. Spectrum of MIT File 100 Channel 1Figure 6. Detection Function Output using Raw Data InputsFiltered vs. Unfiltered (dotted) Normal Heartbeat0.5Filtering Effects on Detection Fn PSD0.40100.2Normalized PowerVoltage (mv)0.30.10-0.1-0.2-0.300.51Time (sec)1.5-510-10102-1510Figure 4. Effects of Filtering EKG Data (Dotted is Raw Data)020406080100Frequency(Hz)120140160Figure 7. Power Spectral Density of Detection Function After ReFilteringPSD (Using Raw Inputs vs. Filtered)010-210Normalized quency (Hz)140160Figure 5. Power Spectral Density, Before and After Filtering180180
Detection Fn Filtered & Resampled 36 Hz4x 108Detection Function Amplitude76543210-121.51Time (sec)0.50Figure 8. Detection Function after Resampling at 36-HzSum-Squared Network Error for 9 Epochs2101Sum-Squared Error10010-110-210-310012345678EpochFigure 9. Training Record of the Levenberg-Marquardt Algorithm.Table 1. EKG Summary of the 4 of beats74BeatcodesN86N, V103N, V101R, V,L9
III. PREPROCESSING OF EKG DATA Much of the EKG data is sampled between 300-Hz and 1-kHz. A simple way to present the data to the neural network is to use a tapped-delay line, where each node accepts a separate sample. The tapped delay line consists of p unit delay operators. The memory depth of a tapped delay line increases linearly with its order.