Transcription
MULTI-RESOLUTION VISUALIZATION OF GEOGRAPHIC NETWORKTRAFFICByBERKAY KAYASubmitted to the Graduate School of Engineering and Natural Sciencesin partial fulfillment of the requirements for the degree ofMaster of ScienceSABANCI UNIVERSITYSpring 2009
MULTI-RESOLUTION VISUALIZATION OF GEOGRAPHIC NETWORKTRAFFICAPPROVED BY:Assist. Prof. Dr. Selim Balcisoy(Dissertation Advisor)Assoc. Prof. Dr. Albert LeviAssist. Prof. Dr. Burçin BozkayaElif AyıterAssist. Prof. Dr. Yücel SaygınDATE OF APPROVAL:ii
Berkay Kaya 2009All Rights Reservediii
MULTI-RESOLUTION VISUALIZATION OF GEOGRAPHIC NETWORKTRAFFICBerkay KayaEECS, M.Sc. Thesis, 2009Thesis Supervisor: Assist. Prof. Dr. Selim BalcisoyKeywords: Geographic Visualization, Network Visualization, Flow Visualization, Levelof Detail, Usability TestingAbstractFlow visualization techniques are vastly used to visualize scientific data among manyfields including meteorology, computational fluid dynamics, medical visualization andaerodynamics. In this thesis, we employ flow visualization techniques in conjunctionwith conventional network visualization methods to represent geographic networktraffic data. The proposed visualization system integrates two visualization techniques,flow visualization and node-link diagram, in a level of detail framework. While flowvisualization emphasizes general trends, node-link diagram visualization concentrateson the detailed analysis of the data. Usability studies are performed to evaluate thesuccess of our approach.iv
COĞRAFĐ AĞ VERĐLERĐNĐN ÇOKLU ÇÖZÜNÜRLÜKLERDEGÖRSELLEŞTĐRMESĐBerkay KayaEECS, Yüksek Lisans Tezi, 2009Tez Danışmanı: Yar. Doç. Dr. Selim BalcisoyAnahtar Kelimeler: Coğrafi Bilgi Görselleştirmesi, Ağ Görselleştirmesi, AkışGörselleştirmesi, Detay Seviyeleri, Kullanılabilirlik ÇalışmalarıÖzetAkış görselleştirme teknikleri yaygın olarak; meteoroji, hesaplamalı akışkanlardinamiği, medikal görselleştirme ve aerodinamik gibi bilimsel verileri görselleştirmektekullanılır. Bu tezde, akış görselleştirme tekniklerini ağ görselleştirme yöntemlerinden deyararlanarak coğrafi ağ trafiği verilerini görselleştirmek için uyguladık. Öne sürülengörselleştirme sistemi, detay seviyeleri tekniği kapsamında akış görselleştirmesi ektedir.Kullanılanakışgörselleştirmesi tekniği genel eğilimleri vurgularken, nokta-bağlantı diyagramıgörselleştirmesi verinin detaylı analizi üzerine yoğunlaşır. Yaklaşımımızın başarısı,kullanılabilirlik çalışmaları yardımıyla değerlendirilmiştir.v
ACKNOWLEDGEMENTSI would like to express my gratitude to my advisor Selim Balcısoy for his support andguidance during my MSc. period. His thoughtful feedbacks, valuable suggestions andinfinite support, have significantly enhanced my thought processes.I would like to thank all my friends and colleagues, particularly to Çagatay Turkay andUraz Cengiz Türker, in the Computer Graphics Lab for their friendship and assistance.I am grateful to my thesis committee members Albert Levi, Burçin Bozkaya, ElifAyıter, and Yücel Saygın for their valuable review and comments on the dissertation.I would like to thank to my precious family for their unconditional love and support thatmade everything possible for me.Finally, I would like to thank Berfin Dinler for encouraging me at all my times ofhesitation. I am also grateful to Burak Karaboğa for his continuous support, especiallyduring my last two weeks.I also thankfully acknowledge the financial support provided by the Scientific andTechnological Research Council of Turkey (TÜBĐTAK).vi
TABLE OF CONTENTS1.INTRODUCTION . 11.1. Information Visualization . 11.2. Problem Definition . 21.3. Summary of Contributions . 41.4. Thesis Outline . 52.MOTIVATION AND RELATED WORK . 62.1 Stages in Visualization . 62.2. Network Visualization. 62.3. Flow Visualization . 102.3.1. Direct Flow Visualization . 102.3.2. Dense Texture-Based Flow Visualization . 162.4. Level of Detail . 182.5. Geographic Visualization . 203.FLOW VISUALIZATION FOR GEOGRAPHIC NETWORKS . 233.1. Line Integral Convolution . 233.2. UFLIC (Unsteady Flow Line Integral Convolution). 253.3. Path Generation . 283.4. Value Scattering Process . 313.5. Convolution Process . 324.LEVEL OF DETAIL FOR GEOGRAPHIC NETWORKS . 334.1. Node-Link Diagram Visualization . 344.2. Level of Detail Framework . 375.EXPERIMENTS AND USABILITY TESTING . 395.1. Introduction to Usability Testing . 395.2. Usability Tests . 405.2.1. Readability of Flow Visualization Technique . 405.2.2. Identification of Locations with High Traffic Density. 415.2.3. Recognition of Global Trends . 435.2.4. Subjective Comments . 44vii
6.CONCLUSION . 50REFERENCES . 51viii
LIST OF FIGURESFigure 1.1 Proposed visualization when flow visualization is integrated. 3Figure 1.2 Proposed visualization when node-link visualization is enabled . 4Figure 2.1 Force-directed graph (Spring-embedding) . 7Figure 2.2 Linkmap visualization. Links denote relationships between nodes. . 8Figure 2.3 Circular Layout. 9Figure 2.4 Two visualization methods representing the same dataset. Node-linkdiagram on the left, matrix representation on the right. 9Figure 2.5 Arrow Plot Visualization. Each arrow represents a vector in the 2D vectorfield . 11Figure 2.6 Icons placed on a jitter grid. Image courtesy of . 11Figure 2.7 Study of Kirby et al. . 12Figure 2.8 Streamline visualization of randomly generated 2D vector field. . 13Figure 2.9 Unsteady flow data visualization using streamlines Jobard et al. . 14Figure 2.10 Dashtubes by Fuhrmann et al. . 15Figure 2.11 Stream surface visualization . 15Figure 2.12 Spot noise algorithm. . 16Figure 2.13 Research fields based on LIC . 17Figure 2.14 LIC output of a white noise texture convolved with fluid dynamics vectorfield . 17Figure 2.15 Terrains with different level of detail and their subdivisions . 19Figure 2.16 LOD applied to meshes via polygon reduction . 19ix
Figure 2.17 Visualization of geospatial data points in ADVIZOR. 21Figure 2.18 Munzner’s visualization of MBone. Arcs denoting links between locations. 21Figure 2.19 Population in USA by States. . 22Figure 2.20 Visualization of World Population in Worldmapper . 22Figure 3.1 LIC Pipeline . 24Figure 3.2 Convolution path. Source pixel (blue) and visited pixels (red) . 25Figure 3.3 Successive Feed Forward Scheme . 27Figure 3.4 Calculation of control points . 29Figure 3.5 Calculation of new control points depending on the width of the flow . 29Figure 3.6 Example path in terms of pixel positions. Numbers above pixels denote thepath indexes. . 30Figure 3.7 Value scattering process. Numbers above pixels denote depositingtimestamps. . 31Figure 3.8 C-Buffer and Bucket Structures . 32Figure 3.9 A bidirectional flow drawn between South America and Europe . 33Figure 4.1 Path Generation of Trails. . 34Figure 4.2 Bidirectional trails . 35Figure 4.3 Region Coloring Scheme. 35Figure 4.4 Gradient Coloring of Trails . 36Figure 4.5 Trails with different widths, 1(top) and 5(bottom). 36Figure 4.6 A trail split into 4 branches . 36Figure 4.7 A trail with animating bubbles . 37x
Figure 4.8 Comparison of two visualizations in low level of detail. Node-link diagramvisualization with branching enabled (left) and flow visualization (right) . 38Figure 4.9 Traffic in North America in high level of detail. Node-link visualization(branching is enabled) . 38Figure 4.10 Traffic in North America in high level of detail. Node-link visualization(width coding is enabled) . 39Figure 5.1 Width coding is enabled. Camera distance is set to maximum distance (left),camera is zoomed into nearest perspective (right). 42Figure 5.2 Branching is enabled. Camera distance is set to maximum distance (left),camera is zoomed into nearest perspective (right). 43Figure 5.3 Global trends highlighted with red . 44Figure 5.4 Readability of flow direction. . 45Figure 5.5 Identification of the number of locations with high density traffic in Europewhen branching method is enabled . 46Figure 5.6 Identification of the number of locations with high density traffic in Europewhen width coding is enabled. . 46Figure 5.7 Identification of global trends. . 48xi
TABLE OF ABBREVIATIONSLICLine Integral ConvolutionUFLICUnsteady Flow Line Integral ConvolutionLODLevel Of Detailxii
1. INTRODUCTION1.1. Information VisualizationThe developments in hardware technology made computers able to store tremendousamounts of data. Gathered data is generally collected automatically by monitor systemsor sensors. Even some casual daily transactions such as telephone calls or electronicmails are recorded by personal computers. The importance of the recorded data isgenerally not taken into consideration. Every data is thought as a potential source ofvaluable information [1]. However, extracting useful patterns and exploring importantdetails in the data is impossible by just reading it in a textual form. The need forinformation visualization emerges in this step. Information visualization satisfies thisneed by offering the data in various forms with differing interactions. Informationvisualization aims to provide graphical representations and user interfaces forinteractively exploring large sets of items [2]. A visualization can give an overview ofthe data, it can filter the data according to user’s needs, it can summarize data and helpidentify important patterns [3].Exploration of information collections becomes extremely difficult as thevolume of data grows. A page of information can be easy to analyze; however, when theinformation becomes the size of a book or even larger, exploring the information maybecome a challenging task [4]. As more data are gathered, the need for extracting usefulinformation increases. While data mining aims to uncover hidden patterns and usefulinformation from the raw data, involving human factor into this process can also yieldvery promising results. Visual data exploration aims at integrating human factor in thedata analysis process, applying human perception to gather important information fromthe large data sets. [1] In the basis of visual data exploration, data are represented invisual form allowing the user to obtain important features from the data. Therefore, theuser should be able to directly interact with data. The process of visual data explorationfollows three steps, which has been called Information Seeking Mantra inShneiderman’s paper [4]; overview first, zoom and filter, and details on demand.In today’s digital world, one of the most elegantly collected data is networktraffic data. Some typical examples of network traffic data are telephone calls,electronic mails, flight traffic, democratic relations, etc. Networks are generally based1
on simple graphs which are formed by the connecting lines that represent binaryconnections between nodes. In binary connections, the properties of the relationshipsbetween the members are disregarded. Ignoring the important features of therelationships can lead to reduction of potentially valuable information. Traffic density isan appropriate example of a quantitative value that can be assigned to each relationship.Encoding every connection with traffic density value is crucial in analyzing theimportant features of the network. In a geographic network, node positions are in keyimportance. Hence, layout of the network should be stable, so that geographic propertiesare not lost.The proposed visualization is a multi-resolution visualization of geographicnetwork traffic, offering different visualization techniques in different levels of detail.Edges between nodes are encoded with visual parameters to represent traffic density.1.2. Problem DefinitionVisualizing geographic network traffic is a challenging task for several reasons. Ingeographic networks, the positions of the nodes play an important role. Althoughdealing with geographic data on 2D displays seems a trivial process, there are manyproblematic issues. If the number of records is too high, visualization gets too cluttereddue to the limited pixel count of the displays. The cluttered view yields to misleadingresults, thus clear views should be supplied.Supporting both global and local views is another significant challenge. Usersshould be able to comment on global trends while working on the overview mode. Onthe other hand, specific details must be detected when detailed view is enabled.Likewise, users should be able to examine regions with high level of detail. In brief,successful visualizations must allow users to obtain important, insightful patterns froman overview as well as to investigate the details of each node and links [5].To clarify the problem definition, the network traffic should be visualized insuch a way that, geographic properties are not lost. Moreover, supporting both globaland local views is mandatory for data analysis. It becomes easier to detect globalpatterns in the large scale layout, whereas individual traffic information can only beexamined in the detailed view. Therefore, level of detail should be navigable throughthe program by interactive techniques like zooming.2
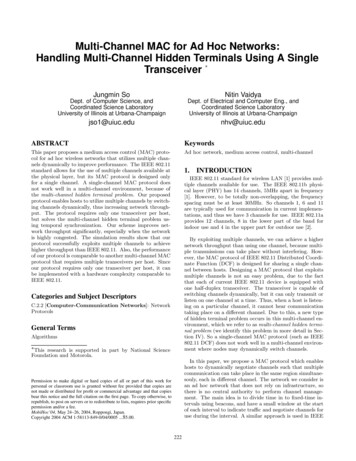
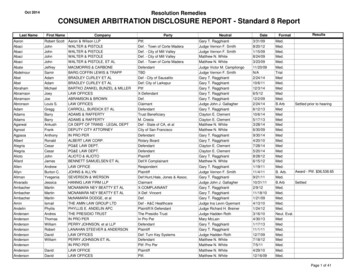
In this thesis, we employed two visualization techniques, node-link diagramsand flow visualization, in the context of geographic network visualization. Weintegrated flow visualization techniques to network visualization problem. Ourvisualization system is based on level of detail framework, which is controlled by thecamera distance. In the detailed view, network traffic is visualized by node-linkdiagrams. In the overview, visualization system benefits from the flow visualizationtechniques to represent high density traffic. Finally, we evaluated the success of ourvisualization system with usability testing.Figure 1.1 Proposed visualization when flow visualization is integrated3
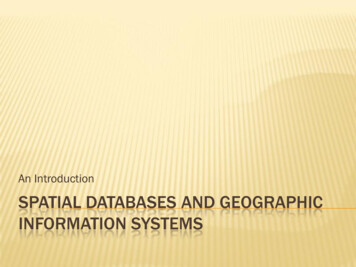
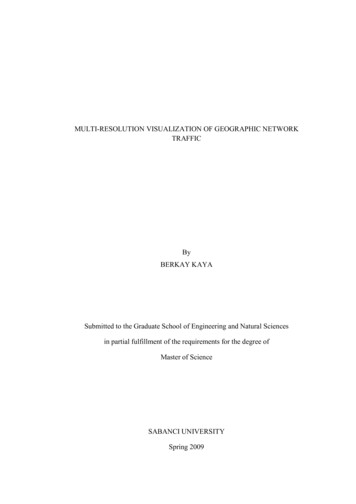
Figure 1.2 Proposed visualization when node-link visualization is enabled1.3. Summary of ContributionsThe main contributions of this research can be classified into two categories: Integration of flow visualization techniques in the geographic network visualizationcontext. Combination of two different visualization techniques, while performing level ofdetail.We extended our research by doing usability tests to discuss the success of the proposedvisualization.4
1.4. Thesis OutlineThis chapter briefly focuses on the importance of information visualization in dataanalysis. The benefits of visual data exploration are discussed in conjunction with thechallenges in geographic network visualization. Moreover, a summary of the proposedvisualization and the main aspects of the system are given. Finally, it concludes with alisting of the summary of contributions.Motivation And Related
The proposed visualization is a multi-resolution visualization of geographic network traffic, offering different visualization techniques in different levels of detail. Edges between nodes are encoded with visual paramet