Transcription
Hierarchical-temporal Data Visualization Usinga Tree-ring Metaphor Roberto TherónDepartamento de Informática y Automática,Universidad de Salamanca, Salamanca, 37008, Spaintheron@usal.esAbstract. This paper describes a novel and efficient visualization technique intended for hierarchical-temporal data using a tree-ring like layout. Temporal hierarchies appear in numerous fields such as genealogy,evolution taxonomies or time lines. In many cases, state-of-the-art static diagrams are produced in these fields. By using several informationvisualization strategies, such as focus context, the tree-ring approachhas the ability to visualize and navigate these, potentially complex, hierarchies trough time. Thus, a deeper insight into the problem at handcan be gained.Key words: tree-ring layout, information visualization, focus context1IntroductionIn the last few years the visualization of hierarchical data has been a subject ofgreat interest in information visualization research. Hierarchies are often represented as trees, i.e., a special kind of graph. Graphs are the fundamentalstructural representation of structured data [1], so the hierarchy visualizationproblem becomes a part of the graph visualization problem.Hierarchies are used in many areas of application, including computer filesystems, taxonomies, genealogy, phylogenesis, evolutionary trees, etc. The information visualization community has explored many different approaches, focusing on navigation and interaction, that help to overcome some of the limitationspresent in graph drawing. For the latter, the book of Battista et al.[2] covers allthe key aspects, while Herman et al. provide a thorough survey of informationvisualization applied to graph visualization and interaction[1].Although the visualization of hierarchies has been extensively studied in theliterature, very few works related to the visualization and exploration of hierarchical data sets that represent a temporal evolution have been done. Furthermore, in many situations visualizations should emphasize temporal relationships This work was supported by the MCyT of Spain under Integrated Action (SpainFrance) HF2004-0277 and by the Junta de Castilla y León under project SA042/02.The author would like to acknowledge Antonio Hernández Serrano for his assistancein the implementation of this work.
and patterns. This paper presents Treevolution, a novel visualization tool thatuses a tree-ring metaphor in combination with focus context techniques, thatcan be useful for hierarchical-temporal data visualization.The rest of this paper is organized as follows: next, a review of works relatedto hierarchical data and time visualization is presented. In Section 2 the treering metaphor is explained. The third section is devoted to a case study: thevisualization of the computer language history using Treevolution. To finalize,the main conclusions and future work are described.1.1Related workMany display layout techniques have been developed for the visualization of hierarchical data sets like Cone tree, Treemap[3], Hyperbolic tree[4], etc. Severalworks have dealt with focus context techniques for visualizing and manipulating large hierarchies. Yee et al. [5] use the well known radial tree layoutmethod[6][2], in which the focused node is placed in center of display, and allother nodes are rendered on appropriate circular level around that selected focused node. Also this approach makes use of different animation techniques forsupporting interactive exploration of the graph. In [7] a software framework forcreating dynamic visualizations of both structured and unstructured data wasdeveloped.An important aspect is how the process of determining the position and sizeof each visual object that is displayed in a presentation can automated. Effectivelayout is one of the most important aspects of creating an information presentation, because that presentation it is intended to be viewed and manipulated bypeople. A survey of automated layout techniques for information presentationscan be found in [8].In [9] focus context techniques were used to compare the structure of largephylogenetic trees. Munzner et al. proposed a new rectilinear focus contexttechnique for navigation that is well suited to the dynamic linking of side-by-sideviews while guaranteeing landmark visibility and constant frame rates.Recently, Morris et al.[10] have dealt with the visualization of temporal hierarchies. In their work, documents from a research front are plotted by time alonga horizontal track in the time line, with related research fronts being plotted innearby tracks according to the hierarchical structure produced during clustering.In [11] tree-ring metaphors are introduced to enhance information contentof focus areas in large time-line visualizations of objects that split or merge.The tree-ring representation shows the relative timing of splits and merges ofeach object. In the tree-ring metaphor for splits and merges, radial distanceindicates time with the birth at the center. At a given radial distance, pieces ofarc represent descendant nodes in existence at that time. A node that neithersplits nor merges is represented by a circle whose radius indicates the lifetime ofthe node.Finally, we would like to point out that Treevolution was developed takinginto account the Computational Information Design (CID) process proposed byBenjamin Fry [12]. CID brings together design, information, and computation
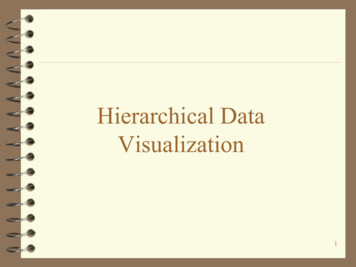
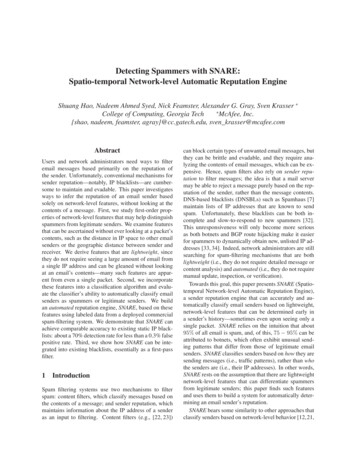
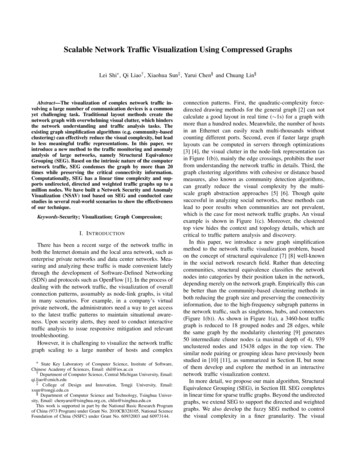
with a focus on how they support one another as parts of a combined methodology for the exploration, analysis, and representation of complex data, andprocessing, his Java-based software development environment aimed to simplifythe construction of graphically-oriented software.2The tree-ring metaphorAs stated above, Treevolution uses a tree-ring metaphor for the temporal hierarchy layout. The following definitions will be useful for the rest of the paper1 :Fig. 1. Cross section of a Pseudotsuga menziesii showing almost perfect tree-rings– Dendrochronology can be defined as The science that uses tree rings datedto their exact year of formation to analyze temporal and spatial patterns ofprocesses in the physical and cultural sciences.– tree ring : A layer of wood cells produced by a tree or shrub in one year,usually consisting of thin-walled cells formed early in the growing season(called earlywood ) and thicker-walled cells produced later in the growing1The source of these elementary definitions, as well as figure 1, is the comprehensivecollection of information related to tree-rings available in Henri D. Grissino-Mayer’sUltimate Tree-Ring Web Pages, http://web.utk.edu/ grissino/
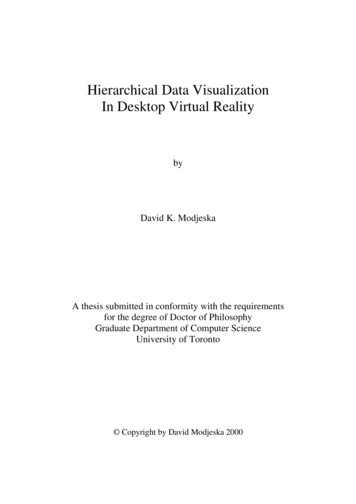
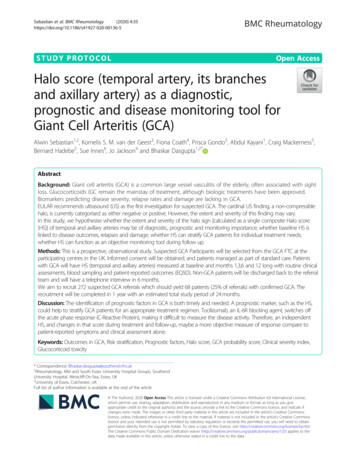
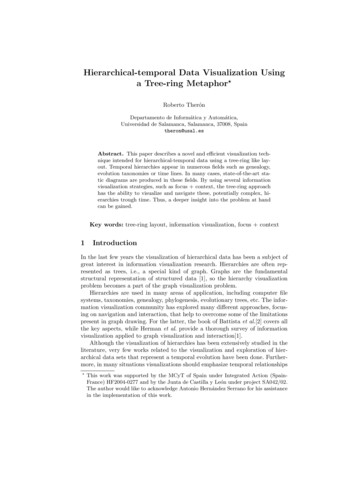
season (called latewood ). The beginning of earlywood formation and theend of the latewood formation form one annual ring, which usually extendsaround the entire circumference of the tree.– tree-ring chronology : A series of measured tree-ring properties, such astree-ring width or maximum latewood density, that has been converted todimensionless indices through the process of standardization. A tree-ringchronology therefore represents departures of growth for any one year compared to average growth. For example, an index of 0.75 (or 75) for a givenyear indicates growth below normal (indicated by 1.00, or 100).Fig. 2. The tree-ring metaphorHence, the idea behind the tree-ring metaphor is to provide a way to visualizeboth timing and structure in a single diagram. In Figure 1, a cross section of atree can be seen. In it, each tree-ring shows the annual growth; the with of thering depends on how productive this year has been for the tree. In order to conveyhierarchical information, while keeping the time information, a modification ofthe radial layout [6] can be used: instead of placing nodes on concentric circlesaccording to their depth in the tree, they are placed according to its temporalinformation.Figure 2 shows a simple hierarchy with temporal information. In the tree-ringlayout, node E is placed in the fourth circle because its time is t 4; in this casethe fact that it is a direct descendant of the root node (A) is not important for
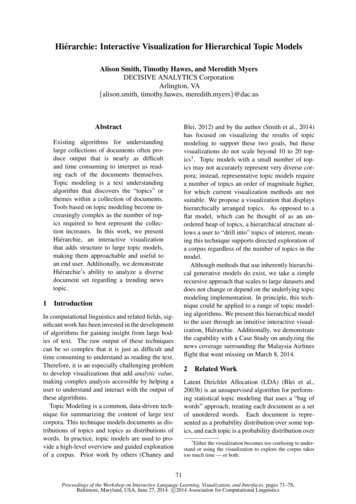
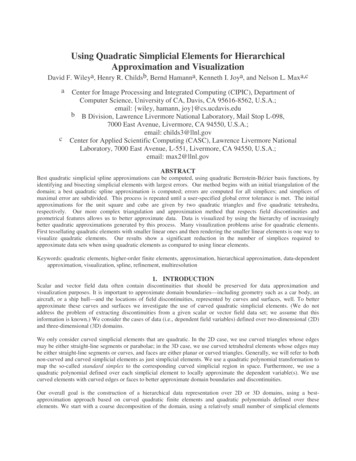
node placement. The hierarchy information is kept in the directed arc (from Ato E), though.Also note that the hierarchy has been drawn occupying a circular sector.The free space could be used, in the case of having a more complex hierarchy, byplacing each subtree or family in an individual sector. This concept can be seenin Figure 3. The picture shows how Treevolution, by using the tree-ring layout,visualizes several subtrees of a complex temporal hierarchy.Fig. 3. Default layout of a temporal hierarchy in TreevolutionIn the following sections we will see how this simple idea can be furtherexploited by using different information visualization techniques.
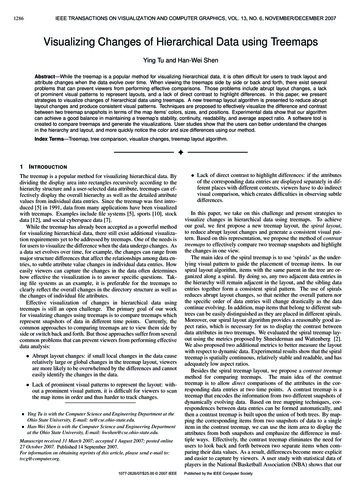
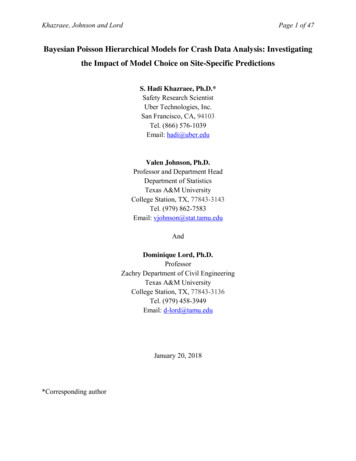
3Case study: browsing the history of computerlanguages with TreevolutionIn order to describe the benefits of the Treevolution technique, a computer languages history diagram2 will be studied.Fig. 4. Partial diagram (1957-1989) of computer languages historyFigure 4 shows the evolution of computer languages from 1957, with theadvent of FORTRAN, to the current releases of popular languages such as Javaor C#. Actually, the picture only shows a small part of the history, from 1957to 1989, because the diagram is intended to be either horizontally scrolled withan Internet browser or to be exhibited on a wall. For our purposes, this piece ofhistory is enough to understand that each family/tree runs from left to right, astimes does. With this diagram it is very difficult to form a mental map of theevolution, since all connections between fathers and sons are mixed.At this point, it is important to understand that the presence of a temporalcomponent changes the types of analysis that may be done [13]. Traditionalapproaches for the representation of hierarchical data are not valid for faithfullypreserve the information and knowledge content of the data, and prevent theviewer from understanding complex hierarchical-temporal relationships.A user analyzing the complexity of the history of computer languages wouldneed to answer questions like the following: How many languages have been developed? How many different families are there? Which one is the most fruitful?Is there a particular time where the evolution was faster? How many ancestors does one particular language have? How many descendants? Which is thelanguage that had the biggest number of descendants in the smallest period oftime?Some of these questions can be answered after a tedious and meticulousanalysis of the Figure 4 diagram. However, it is impossible to have an overview2Diagram produced by Eric Levenez, http://www.levenez.com
of the full history. The analyst would need to start from left to right, take somenotes, and go on scrolling toward the present time. This means that importantquestions cannot be visually answered.With Treevoltion the whole history (1957-2006) can be seen in a single andcompact diagram. Actually, Figure 3 showed the history of computer languagesin Treevolution. The same hierarchy, but this time all nodes are labeled, is shownin figure 5. Note that light red edges depict the ancestors of nodes pertaining toother families.Fig. 5. Computer languages history, from 1957 to 2006, in TreevolutionFurthermore, the Levenez diagram suffers from the well-known problem offocus: as we scroll when we are following a particular time line, all contextualinformation is lost. Some tasks, common in the analysis of any hierarchicaltemporal data set, where the context is needed are:– Have a clear overview of the whole evolution.– Focus on a family or a subfamily while keeping its relationships with otherfamilies.– Compare the evolution of two or more families.– Identify a subfamily within a family.– Focus on a particular period of time across families.
The trade-off between global views and visibility of details is a long-standingproblem in visualizations of large data sets [1]. Traditional distortion techniquescan be used to focus on detail in particular areas while keeping the context. Inaddition to the visualization technique, for an effective data exploration, it is necessary to use some interaction and distortion techniques. Interaction techniquesallow the data analyst to directly interact with the visualizations and dynamically change the visualizations according to the exploration objectives[14]. Thisapproach has been followed in two ways in Treevolution:– Sector distortion. The angle of any sector can be interactively opened inorder to have more space for the layout of a particular subtree (or computerlanguage family in this example). As one sector is opened, the remainingsectors are proportionally closed. This can be seen in Figure 6, where thePostScript sector (upper left quadrant) has been opened by the user in orderto clearly see its hierarchy.– Ring distortion. The width of any ring can be interactively increased inorder to view more clearly that period of time. At this point, the tree-ringmetaphor offers its best, since all rings cover the same amount of time, butthe number of nodes within that period is variable (different growth index,in tree-ring chronology terms). This situation can be seen in Figure 7, whereyears 2002 and 2003 were very productive, with several versions. This way,although all rings represent a year time, the width of the rings has beenincreased in order to clearly view the rapid evolution of Java during thatyears. Note that inner years have their width decreased in order to makeroom for the productive years.Furthermore, Treevolution can automatically weight the width of each familyand the productivity of each year, so each sector and each ring is automaticallydistorted according to those weights. Thus, the resulting tree-ring layout caneasily convey this complex information, that more traditional approaches cannotdeal with (this is the case of the diagram in Figure 4, which is manually drawnby the author without using any automatic tool).Besides, some more interactions [14] have been added in the Treevolutionimplementation. On the right hand size, an alphabetical browser of node labelspermits to find a particular node within a complex hierarchy. Also, it is possibleto filter the label browser with a word provided from the keyboard. This is whatit was done in Figure 7: Oak was typed so the node was selected. As a result, thenode is highlighted, its direct descendant is highlighted in blue, and its ancestorsare highlighted in red. The oak sector (family) and the ring (year) are shadowedand the particular time is shown in the background (1991).Figure 8 shows a similar situation but for the C language (Kernighan andRitchie) in 1977. Note that a subfamily, C (K and R) is highlighted with a darkershadow than the whole family (Fortran). Also note that the Smalltalk family (inthe bottom left quadrant) has a wider sector. This is the way Treevolution canmaintain several foci while maintaining the context.Another important feature of Treevolution is that the whole diagram canbe rotated, in order to provide a way of avoiding the label cluttering that the
Fig. 6. The user is focused on the Postcript family (upper left quadrant)automatic layout can produce. This a very important issue, since the design of anaesthetic label layout is an efficient way to increase the functionality (speeding upsearch tasks) of technical and scientific illustration [15]. The user only needs todrag the small round button that is located outside the circle. Note the differentlocations of this button in figures 5 (default location), 6,7 and 8.Finally, it should be noted that the visual engagement evoked by the naturaltree is also due to its irregularities. These irregularities have not been taken intoaccount for the current implementation of Treevolution. However, the variationsin the ring width for different radios (differential growing) might be useful todisplay subtree features, and the variations in the colors (from heartwood toouter wood) might be useful to bring more clearly to mind the tree-ring outwardgrowing metaphor). This will be subject of further research.4ConclusionsA novel method for the visualization and navigation of hierarchical-temporaldata was presented. The tree-ring metaphor provides an elegant solution to thisparticular problem, while the focus context and interaction techniques permitthe expert to see and understand a big and complex dataset at once. The rotationof the tree-ring is a simple but very efficient way of label uncluttering. As case
Fig. 7. Full details of the evolution of the Java hierarchystudy, Treevolution was successfully applied to the popular history of computerlanguages diagram, showing its potential for exploring hierarchies and helpingthe user to gain a deeper understanding of the evolution and relationships amongthe different elements in the hierarchy.Future extensions will be providing multiple linked views of selected subtrees,fisheye view for rings, node filtering depending on a period of time, and test thetechnique with larger datasets. Also, the optimization of the layout algorithm,so the number of crossing edges can be minimized, will be studied.Another important aspect that will be tested is the user performance (forinstance, how the user judgments are affected by the orientation and order ofthe particular sequence around the circle).Finally, a challenging issue is how to deal with trees whose structure changesover time, rather than just adding more nodes.References1. Herman, Melançon, G., Marshall, M.S.: Graph visualization and navigation in information visualization: A survey. IEEE Transactions on Visualization and Computer Graphics 6 (2000) 24–432. Battista, G.D., Eades, P., Tamassia, R., Tollis, I.G.: Graph Drawing: Algorithmsfor the Visualization of Graphs. Prentince Hall, Upper Saddle River, N. J. (1999)
3. Shneiderman, B.: The eyes have it: A task by data type taxonomy for informationvisualizations. In: IEEE Visual Languages. Number UMCP-CSD CS-TR-3665,College Park, Maryland 20742, U.S.A. (1996) 336–3434. Munzner, T., Burchard, P.: Visualizing the structure of the world wide web in 3dhyperbolic space. In: VRML ’95: Proceedings of the first symposium on Virtualreality modeling language, New York, NY, USA, ACM Press (1995) 33–385. Yee, K.P., Fisher, D., Dhamija, R., Hearst, M.A.: Animated exploration of dynamicgraphs with radial layout. In: INFOVIS. (2001) 43–506. Eades, P.: Drawing free trees. Bulletin of the Institute for Combinatorics and itsApplications 5 (1992) 10–367. Heer, J., Card, S.K., Landay, J.A.: prefuse: a toolkit for interactive informationvisualization. In: Proceedings of SIGCHI Human Factors in Computing Systems,New York, NY, USA, ACM Press (2005) 421–4308. Lok, S., Feiner, S.: A survey of automated layout techniques for information presentations. In: Proceedings of SmartGraphics 2001. (2001)9. Munzner, T., Guimbretière, F., Tasiran, S., Zhang, L., Zhou, Y.: Treejuxtaposer:scalable tree comparison using focus context with guaranteed visibility. ACMTransactions on Graphics 22 (2003) 453–46210. Morris, S.A., Yen, G., Wu, Z., Asnake, B.: Time line visualization of researchfronts. Journal of the American Society for Information Science and Technology54 (2003) 413–42211. Robbins, K.A., Jeffery, C.L., Robbins, S.: Visualization of splitting and mergingprocesses. Journal of Visual Languages and Computing 11 (2000) 593–61412. Fry, B.: Computational Information Design. PhD thesis, MIT (2004)13. National Visualization and Analytics Center: Illuminating the Path: The Researchand Development Agenda for Visual Analytics. IEEE Press (2005)14. Keim, D.A.: Information visualization and visual data mining. IEEE Transactionson Visualization and Computer Graphics 8 (2002) 1–815. Hartmann, K., Götzelmann, T., Ali, K., Strothotte, T.: Metrics for functional andaesthetic label layouts. Lecture Notes in Computer Sceinces,
to hierarchical data and time visualization is presented. In Section 2 the tree-ring metaphor is explained. The third section is devoted to a case study: the visualization of the computer language history using Treevolution. To fina