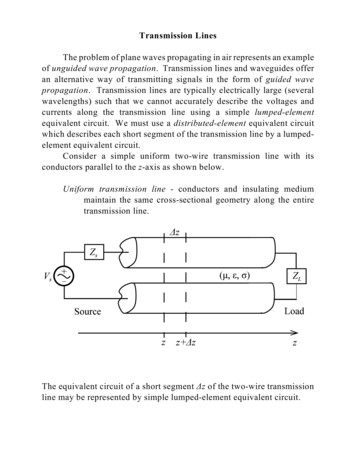
Transcription
JUNE 2012Time Series AnalysisCONTENTA time series is a chronological sequence ofobservations on a particular variable. Usually theobservations are taken at regular intervals (days,months, years), but the sampling could beirregular. A time series analysis consists of twosteps:(1) building a model that represents a timeseries(2) validating the model proposed(3) using the model to predict (forecast)future values and/or impute missing values.If a time series has a regular pattern, then avalue of the series should be a function ofprevious values. The goal of building a timeseries model is the same as the goal for othertypes of predictive models which is to create amodel such that the error between the predictedvalue of the target variable and the actual valueis as small as possible.The primary difference between time seriesmodels and other types of models is that lagvalues of the target variable are used aspredictor variables, whereas traditional modelsuse other variables as predictors, and theconcept of a lag value doesn’t apply because theobservations don’t represent a chronologicalsequence.19 pages0
LIST OF AUTHORSMartin Charlton, NCGAlberto Caimo, NCGContactmartin.charlton@nuim.ie1
TABLE OF CONTENTLIST OF AUTHORS . 1Introduction. 31 Theory and Models . 31.1 Autoregressive Series . 41.2 Moving Average Series . Erreur ! Signet non défini.1.3 Integrated Series . 61.4 Autoregressive Moving Average Series . 71.5 Integrated Autoregressive Moving Average Series . 72 Fitting and Forecasting . 82.1 The Box-Jenkins procedure . 93 A Toy Example . 114 Other Techniques . 134.1 Smoothing .134.2 Nonparametric Time Series Analysis .145 Short Time Series . 143.1 Exceptional Values and Outliers .153.2 Outliers Detection .156 Estimating of Missing Values . 177 Spatial Time Series . 18References . 192
IntroductionFrom a statistical point of view, time series are regarded as recordings ofstochastic process which vary over time. We will concentrate on the casewhere observations are made at discrete equally spaced times.The distinguishing feature of time series is that of temporal dependence: thedistribution of an observation at a certain time point conditional on previousvalue of the series depends on the outcome of those previous observations,i.e., the outcomes are not independent. For the purpose of analyzing a timeseries we will usually model the time series over all the non-negative integers.We assume that the time series values we observe are the realisations ofrandom variables, which are part of a stochastic process.In other words,are random variable whose value can not bepredicted with certainty. Instead, the variable is said to vary according to aprobability distribution which describes which values Y can assume and withwhat probability it assumes those values.Each realisation ofterm :is assumed to be the result of a signaland a noiseThe basic aims of time series analysis are the following :- Description: how can we describe a time series?- Inference: how to make inferences about the patterns in a time series,e.g., are there “cycles” in the data?- Prediction: use the past of a series (or several series) to predict the future.- Control: if we can predict the future from the past, how can we modify thecurrent value(s) to obtain a desirable value in the future?1. Theory and ModelsA key idea in time series is that of stationarity. Roughly speaking, a time seriesis stationary if its behaviour does not change over time. This means, forexample, that the values always tend to vary about the same level and thattheir variability is constant over time. Stationary series have a rich theory andtheir behaviour is well understood and they therefore play a fundamental rolein the study of time series. Obviously, most of the time series that we observeare non-stationary but many of them are related in simple ways to stationarytime series.3
The mean function of a time series is defined to beautocovariance function is defined to beand theThere is a quite long tradition in time series to focus on only the first twomoments of the process rather than on the actual observation distribution. Ifthe process is normally distributed all information is contained in the first twomoments and most of the statistical theory of time series estimators isasymptotic and more often than not only dependent on the first two momentsof the process.Stationarity is a rather intuitive and is an invariant property which means thatstatistical characteristics of the time series do not change over time. Forexample, the yearly rainfall may vary year by year, but the average rainfall intwo equal length time intervals will be roughly the same as would the numberof times the rainfall exceeds a certain threshold. Of course, over long periodsof time this assumption may not be so plausible. For example, the climatechange that we are currently experiencing is causing changes in the overallweather patterns (we will consider nonstationary time series towards the endof this course). However in many situations, and over shorter intervals theassumption of stationarity is quite a plausibe. Indeed often the statisticalanalysis of a time series is done under the assumption that a time series isstationary. There are two definitions of stationarity, weak stationarity whichonly concerns the covariance of a process and strict stationarity which is amuch stronger condition and supposes the distributions are invariant overtime. A time series is said to be weakly stationary if,andfor all and .When time series are stationary we can define the mean of the series to beand the autocovariance function to be.The autocorrelation function, ACF, is defined as follows:1.1Autoregressive Seriesis called an autoregressive series of order ,, if it satisfies4
where is white noise and theare parameter coefficients. The next valueobserved in the series is a slight perturbation of a simple function of the mostrecent observations.353025tFigure 1. An example of this AR(1) process, produced using a random number generator. 11 2 3 4 5 6···j1Figure 2. As we will see later in this report, the correlogram, as a diagram such as the oneabove is called, is an important mechanism to identify the underlying structure of a timeseries. For the AR(1), the autocorrelations decline exponentially.In the case of the -th order the correlation betweenandcan in part bedue to the correlation these observations have with the intervening lags,,.,. To adjust for this correlation the partial autocorrelations, PACF,are calculated.1.2Moving Average Seriesis called a moving average process of order ,, if it satisfies5
whereare parameters coefficients. In practice it is easy to distinguishand AR series by the behaviour of their ACFs: the MA ACF cuts off sharly whilethe AR ACF decays exponentially.It is important to note that a finite AR model is equivalent to an infinite MAmodel and a finite MA model is equivalent to an infinite AR model.1050tFigure 3. An example of this MA(1) process, produced using a random number generator.j1 2 3 4 5 6···Figure 4. For the MA(1), the autocorrelations decline after lag 1.1.3Integrated SeriesAn integrated series is one in which the value ofis simply the sum ofrandom shocks. In general, the order of integration can be thought of as thenumber of differencings a series requires to be made stationary.A random walk process is an example of:6
where the differenced series1.4is just a function of the random termAutoregressive Moving Average Seriesis called a autoregressive moving average process of orderif it satisfies1.5.,,Integrated Autoregressive Moving Average SeriesIfis anseries thanautoregressive moving-average series,is said to be an integratedMany time series exhibit strong seasonal characteristics. We’ll use to denotethe seasonal period. For monthly series,, and for quarterly series.Seasonal patterns can show up in many contexts (e.g. weekly patterns in dailyobservations or daily patterns in hourly data).Seasonal effects can be modelled by including coefficients at lags which aremultiples of the seasonal period.1 2 3 4 5 6 7 8 ···jFigure 5. Differencing, AR or MA parameters may be needed at various lags. For quarterlydata you may need to look at lags of 4.To identify the appropriatemodel for a time series, you begin byidentifying the order(s) of differencing needed to stationarise the series andremove the gross features of seasonality. If the resulting time series shows a7
strong trend (growth or decline), then the process is clearly not stationary, andit should be differenced at least once.The second test that can be used is to examine the estimated autocorrelationof the time series. For a stationary time series, the autocorrelations willtypically decay rapidly to 0. For a nonstationary time series, theautocorrelations will typically decay slowly if at all.2. Fitting and ForecastingSuppose that we have identified a particularmodel which appearsto describe a given time series. We now need to fit the identified model andassess how well the model fits.Fitting can be carried out using maximum likelihood estimation procedureswhich allows to produce both estimates and standard errors for the parametercoefficients.Once a model has been fitted to a set of data it is always important to assesshow well the model fits. This is because the inferences we make dependcrucially on the appropriateness of the fitted model. The usual way ofassessing goodness of fit is through the examination of residuals. A simplediagnostic is to simply plot the residuals and to see whether they appear to bea white noise series.After deciding on an appropriate model, estimated its unknown parametersand established that the model fits well the data, we can turn to the problemof forecasting future values of the series. Once a forecast is obtained forwe can use it to obtain a forecast forand then use these two forcasts togenerate a forecast for, and so on.The process can be continued to obtain forecasts out to any point in the future.Because uncertainty increases as we predict further and further from the datawe have, we can expect the standard errors associated with our predictions toincrease.8
2.1The Box-Jenkins procedureThe Box-Jenkins methodology is a strategy for identifying, estimating andforecasting autoregressive integrated moving average models. Themethodology consists of a three step iterative cycle of: IdentificationEstimationVerificationThe data may require pre-processing to make it stationary. To achievestationarity we may do any of the following: Look at the time seriesRe-scale it (for instance, by a logarithmic or exponential transform)Remove deterministic componentsDifference it until stationary. In practice d 1, 2 should be sufficient.For the moment we will assume that our series is stationary. The initial modelidentification is carried out by estimating the sample autocorrelations and partialautocorrelations and comparing the resulting sample autocorrelograms and partialautocorrelograms with the theoretical ACF and PACF derived already.We can try to fit anmodel. We consider the correlogram and the partialautocorrelations.In particular we know that: Anprocess has negligible ACF after the -th term. Anprocess has negligible PACF after the -th term. Anprocess hasgeometrically for-th order sample ACF and PACF decaying.The method involves a subjective element at the identification stage. This can be anadvantage since it allows non-sample information to be taken into account. Thus arange of models may be excluded for a particular time series. The subjective elementand the tentative nature of the identification process make the methodologydifficult for the non experienced forecaster.In the estimation of an ARMA model it is possible to estimate the likelihood conditionalon the early observations. With modern software there is no need to do this and if youshould use full Maximum Likelihood. The estimation of the likelihood can be achievedwith many different software packages on a PC.The procedure outlined above requires considerable intervention from thestatistician completing the forecast. Various attempts have been made toautomate the forecasts. The simplest of these fits a selection of models to the9
data, decides which is the “best” and then if the “best” is “good enough” usesthat. The most common criterions to select the best model among a set ofcompeting ones are: Relatively small of(or Schwarz criterion) Relatively small of standard error ( Relatively high coefficient of determination).The third stage in the Box-Jenkins algorithm is to check whether the model fitsthe observed data. There are several tools we may use: Overfitting. Add extra parameters to the model and use likelihood ratio test orttest to check that they are not significant. Residuals analysis. Calculate the residuals from the model and plot them. Theautocorrelation functions, ACFs, PACFs, spectral densities, estimates, etc., andconfirm that they are consistent with white noise.The selection of a forecasting method is a difficult task that must be base inpart on knowledge concerning the quantity being forecast. With forecastingprocedures, we are generally trying to recognize a change in the underlyingprocess of a time series while remaining insensitive to variations caused bypurely random effects. The goal of planning is to respond to fundamentalchanges, not to spurious effects.With a method based purely on historical data, it is impossible to filter out allthe noise. The problem is to set parameters that find an acceptable tradeoffbetween the fundamental process and the noise.We need to adopt a formal mathematical criterion to calculate model forecasts.A plausible criterion is based on the mean squared error of prediction MSEP.Suppose that we have a sample of observed data,.,and that we wouldlike to predict. This approach consists in choosing the functionthat minimizes MSEP.The general solution to this minimization problem is to consider the followinfunction :i.e., the conditional expectation of, given the observed data,., . Theestimate produced by this function is called the minimum mean squared error(MMSE) forecast.10
3. A Toy ExampleWe analyze the series F data set in Box, Jenkins, and Reinsel, 1994 (Figure 6).The data do not appear to have a seasonal component or a noticeable trend.Figure 6. Series F. Yields from a Batch Chemical ProcessWe compute the ACF of the data for the first 35 lags to determine the type ofmodel to fit to the data. We list the numeric results and plot the ACF (alongwith 95 % confidence limits) versus the lag number.11
The ACF values alternate in sign and decay quickly after lag 2, indicating thatan AR(2) model should be appropriate for the data.The model fitting results are shown 7Standard Error-------------0.12020.1202δ 51.1286Residual standard deviation 10.9599Test randomness of residuals:Standardized Runs Statistic Z 0.4887, p-value 0.625The historical time series data and some forecasted values (blue line) with90% confidence intervals (red lines) are shown in the figure below.12
4.Other TechniquesThe logic behind time series methods is that past data incorporate enduringpatterns that will carry forward into the future and that can be uncoveredthrough quantitative analysis. Thus the forecasting task becomes, in essence,a careful analysis of the past plus an assumption that the same patterns andrelationships will hold in the future. There are a number of time-series analysisand forecasting methods, differing mainly in the way past observations arerelated to the forecasts.4.1SmoothingThe notion underlying smoothing methods is that there is some specific patternin the values of the variables to be forecast, which is represented in pastobservations, along with random fluctuations or noise.Using smoothing methods, the analyst tries to distinguish the underlyingpattern from the random fluctuations by eliminating the latter. For example,by averaging out short-term fluctuations in a sales data series could reveal thelonger-term patterns or cycles in sales.The moving average is simply the un-weighted mean of the previous Nobservations. The new forecast is a function of the preceding moving-averageforecast.The exponential-smoothing approach is very similar to the moving averagemethod, differing in that the weights given to past observations are notconstant—they decline exponentially so that more recent observations getmore weight than earlier values. Choice of the smoothing factor is left to theanalyst. Most often the analyst selects a value experimentally from a set of twoor three different trial values.13
Adaptive filtering (i.e., removing noise from signal) is another approach fordetermining the most appropriate set of weights, where the weights change toadjust to the changes in the time series being filtered. Notice that all themethods outlined so far are based on the idea that a forecast can be made asa weighted sum of past observations.4.1Nonparametric Time Series AnalysisFor a given time series, nonparametric techniques are used to analyze variousfeatures of interest. Generally, the idea underlying many of these techniquesis that the characteristic of interest is allowed to have a general form which isapproximated increasingly precisely with growing sample size. For example, ifa process is assumed to be composed of periodic components, a general formof spectral density may be assumed which can be approximated withincreasing precision when the sample size gets larger. Similarly, if theautocorrelation structure of a stationary process is of interest the spectraldensity may be estimated as a summary of the second moment properties.There are numerous other nonparametric procedures and techniques thathave been used in time series analysis. For instance, when a parametric timeseries model is specified it may be of interest to estimate the distribution ofthe residuals by nonparametric methods in order to improve the parameterestimators or to assess the statistical properties of the estimators. Moreprecisely, density estimation for the residuals and bootstrap methods based onthe residuals have been used in this context.Another important characteristic of a time series is its trending behaviour.Deterministic trend functions have also been analyzed nonparametrically. Inaddition, there are a number of nonparametric tests for stochastic trends.5Short Time SeriesShort time series may be all there is available when data are acquired by aninfrequent survey due to experimental factors or high costs. This type of datais obviously undersampled, and some important features of the temporalpattern can be obscured by the stochastic noise.Traditional forecasting models like ARIMA have been shown very effective inforecasting time series with stochastic seasonality as well as deterministicseasonality. To perform effective model identification and estimation onstandard ARIMA procedures, analysts need sufficient historical data.14
Under such conditions, however, most standard forecasting models are nolonger applicable.5.1Exceptional Values and OutliersThere are two types of exceptional values: Logical errors (e.g. negative population values) Statistical outlier (e.g. unusually high values)An outlier is an observation that appears to deviate markedly from otherobservations in the sample.Identification of potential outliers is important for the following reasons :1. An outlier may indicate bad data. For example, the data may have beencoded incorrectly or an experiment may not have been run correctly. If itcan be determined that an outlying point is in fact erroneous, then theoutlying value should be deleted from the analysis (or corrected ifpossible).2. In some cases, it may not be possible to determine if an outlying point isbad data. Outliers may be due to random variation or may indicatesomething scientifically interesting. In any event, we typically do notwant to simply delete the outlying observation. However, if the datacontains significant outliers, we may need to consider the use of robuststatistical techniques.There are basically two types of identification methods to deal with them: Logical errors: deterministic techniques (e.g. hierarchical consistency) Statistical outliers: statistical techniques (e.g. outlier detection methods)5.2Outliers DetectionTime series outliers can be defined as data points that do not follow thegeneral (historical) pattern of regular variation seen in the data sequence. Oneparticular reason for the importance of detecting the presence of outliers isthat potentially they have strong influence on the estimates of the parametersof a model that is being fitted to the data. This could lead to mistaken15
conclusions and inaccurate predictions. It is therefore important that theseoutliers are detected and removed or replaced.Possible approaches to outlier detection in short time series: Boxplot Analysis Principal Components Analysis (PCA) Geographically Weighted Principal Components Analysis (GWPCA)The first approach consists in assuming Gaussian errors and consideringoutliers all the time observations falling outside the 95% level interval.PCA is a way of identifying patterns in data, and expressing the data in such away as to highlight their similarities and differences. Since patterns in data canbe hard to find in data of high dimension, where the luxury of graphicalrepresentation is not available, PCA is a powerful tool for analysing data.The other main advantage of PCA is that once you have found these patternsin the data, and you compress the data, ie. by reducing the number ofdimensions, without much loss of information.The PCA based methods allow us to consider more than simply pairs of timeseries simultaneously and use an orthogonal transformation to convert a set ofobservations of possibly correlated variables into a set of values of linearlyuncorrelated variables called principal components. All of the variance in theoriginal m variables is retained during this transformation. The values of thenew variables are known as scores and can be analysed so as to identifyexceptional values. The PCA approach ignores the spatial arrangement of thegeographic unit.With GWPCA we obtain local transformations by applying geographicalweighting and this gives us a set of components for each geographical unit.The scores deriving from these local transformations can be used to identifyexceptional values. GWPCA is also able to indicate a identify spatial outlyingobservations in the data. The GWPCA method would appear to be verydiscriminating in identifying potentially exceptional values in the geographicalunits.16
6. Estimating of Missing Data6.1 Deterministic ApprochesIn general, deterministic models for time series refers to the use of numericalanalysistechniques for modelling time series data.The principle of numerical analysis is to assume the time series data pattern isa realisation of an unknown function. The aim is to identify the mostappropriate function to represent the data in order to estimate the missingvalues. We assume the behaviour of the time series data follows a polynomialfunction or combination of polynomial functions and examine the time intervalthat involved the missing values. Sometimes this is the most difficult part ofthe analysis process. We have to examine all the factors involved and decidethe appropriate length of time interval to be considered.After finding a polynomial that fits the selected set of points and assume thatthe polynomial and the function behave nearly the same over the interval inquestion. Values of the polynomial should be reasonable estimates of thevalues of the unknown function. However, when the data appears to have localirregularities, then we are required to fit sub-regions of the data with differentpolynomials. This includes special polynomials called splines. For most of thetime series data, we do not want to find a polynomial that fits exactly to thedata. Often functions used to fit a set of real values will create discrepancies orthe data set may come from a set of experimental measurements that aresubject to error. A technique called least squares is normally used in suchcases. Based on statistical theory, this method finds a polynomial that is morelikely to approximate the true values.6.3Stochastic ApprochesTime series analysis is a specific type of data analysis in which we realize thatsuccessive observations are usually not independent and that the analysismust take into account the time order of the observations. In the previoussection we have mentioned deterministic models, a time series that can bepredicted exactly to its behaviour. However, most of the time series arerealisations of stochastic models. Future values are only partly determined bythe past values, so that exact predictions are impossible. We must thereforeconsider future values as realisations from a probability distribution which isconditioned by knowledge of past values.If missing values occurred within the time series data then it is impossible tocompute any of these values. For this reason, ARIMA models may not be the17
best choice and they cannot be applied directly to time series which includesthe missing values.To apply Box-Jenkins’ method to time series data with missing values, we haveto consider the following: How often do the missing values occur? Where are the missing values located in the time series? Do we have sufficient data before, after or between the missing values toapply Box-Jenkins’ method to the remaining data?It is possible to indirectly apply Box-Jenkins’ method to time series withmissing values. The accuracy of results is mainly dependent on the type oftime series. Once missing values have been filled with estimates, Box-Jenkins’method canthen be applied.7. Spatial Time SeriesResearch in statistical/econometric models that describe the spatio-temporalevolution of a single variable or multi-variable relationships in space and timehas significantly increased during the last twenty years.The space-time autoregressive integrated moving average (STARIMA) modelclass is one example of this methodological development. Similarly to ARIMAmodel building for univariate time series, STARIMA model building is based imation–diagnosticchecking) and it has been applied to spatial time series data from a widevariety of disciplines.18
References- Box, G.E.P and G.M. Jenkins, Time Series Analysis, Forecasting, andControl, HoldenDay, Oakland, CA, 1970.- Box, G.E.P and G.M. Jenkins and G.D. Reinsel, Time Series Analysis,Forecasting, and Control, Third Edition, Prentice Hall, Englewood Cliffs,NJ, 1993.- Chatfield, C., The Analysis of Time Series: An Introduction, Fifth Edition,Chapman & Hall, Boca Raton, FL, 1996.- Fuller, W.A., Introduction to Statistical Time Series, Second Edition, JohnWiley & Sons, New York, 1996.- Gaynor, P.E. and R.C. Kirkpatrick, Introduction to Time-Series Modelingand Forecasting in Business and Economics, McGraw-Hill, New York,1994.- Shumway, R.H. and D.S. Stoffer, Time SeriesApplications, SpringerVerlag, New York, 2000.AnalysisandIts- West, M. and J. Harrison, Baysian Forecasting and Dynamic Models,Second Edition, Springer-Verlag, New York, 1997.19
6 where are parameters coefficients. In practice it is easy to distinguish and AR series by the behaviour of their ACFs: the MA ACF cuts off sharly while the AR ACF decays exponentially. It is important to note that a finite AR model is equivalent to an infinite MA model and a finite MA model is equivalent to an infinite AR model. Figure 3.