Transcription
Time Series AnalysisLecture Notes for 475.726Ross IhakaStatistics DepartmentUniversity of AucklandApril 14, 2005
ii
Contents1 Introduction1.1 Time Series . . . . . . . . . . . . . . . . . . . .1.2 Stationarity and Non-Stationarity . . . . . . .1.3 Some Examples . . . . . . . . . . . . . . . . . .1.3.1 Annual Auckland Rainfall . . . . . . . .1.3.2 Nile River Flow . . . . . . . . . . . . . .1.3.3 Yield on British Government Securities1.3.4 Ground Displacement in an Earthquake1.3.5 United States Housing Starts . . . . . .1.3.6 Iowa City Bus Ridership . . . . . . . . .11122223332 Vector Space Theory2.1 Vectors In Two Dimensions . . . . . . . .2.1.1 Scalar Multiplication and Addition2.1.2 Norms and Inner Products . . . .2.2 General Vector Spaces . . . . . . . . . . .2.2.1 Vector Spaces and Inner Products2.2.2 Some Examples . . . . . . . . . . .2.3 Hilbert Spaces . . . . . . . . . . . . . . .2.3.1 Subspaces . . . . . . . . . . . . . .2.3.2 Projections . . . . . . . . . . . . .2.4 Hilbert Spaces and Prediction . . . . . . .2.4.1 Linear Prediction . . . . . . . . . .2.4.2 General Prediction . . . . . . . . .777899111213131414153 Time Series Theory3.1 Time Series . . . . . . . . . . . . . . . . .3.2 Hilbert Spaces and Stationary Time Series3.3 The Lag and Differencing Operators . . .3.4 Linear Processes . . . . . . . . . . . . . .3.5 Autoregressive Series . . . . . . . . . . . .3.5.1 The AR(1) Series . . . . . . . . . .3.5.2 The AR(2) Series . . . . . . . . . .3.5.3 Computations . . . . . . . . . . . .3.6 Moving Average Series . . . . . . . . . . .3.6.1 The MA(1) Series . . . . . . . . .3.6.2 Invertibility . . . . . . . . . . . . .3.6.3 Computation . . . . . . . . . . . .17171819202121232629292930iii
ivContents3.7.30313232343436374 Identifying Time Series Models4.1 ACF Estimation . . . . . . . . . . . . . . . . . . . . .4.2 PACF Estimation . . . . . . . . . . . . . . . . . . . . .4.3 System Identification . . . . . . . . . . . . . . . . . . .4.4 Model Generalisation . . . . . . . . . . . . . . . . . . .4.4.1 Non-Zero Means . . . . . . . . . . . . . . . . .4.4.2 Deterministic Trends . . . . . . . . . . . . . . .4.4.3 Models With Non-stationary AR Components .4.4.4 The Effect of Differencing . . . . . . . . . . . .4.5 ARIMA Models . . . . . . . . . . . . . . . . . . . . . .393942434545474748495 Fitting and Forecasting5.1 Model Fitting . . . . . . . . . . . . . . . . . . . . . . . . . .5.1.1 Computations . . . . . . . . . . . . . . . . . . . . . .5.2 Assessing Quality of Fit . . . . . . . . . . . . . . . . . . . .5.3 Residual Correlations . . . . . . . . . . . . . . . . . . . . .5.4 Forecasting . . . . . . . . . . . . . . . . . . . . . . . . . . .5.4.1 Computation . . . . . . . . . . . . . . . . . . . . . .5.5 Seasonal Models . . . . . . . . . . . . . . . . . . . . . . . .5.5.1 Purely Seasonal Models . . . . . . . . . . . . . . . .5.5.2 Models with Short-Term and Seasonal Components5.5.3 A More Complex Example . . . . . . . . . . . . . .51515154585959616163666 Frequency Domain Analysis6.1 Some Background . . . . . . . . . . . . . . . . .6.1.1 Complex Exponentials, Sines and Cosines6.1.2 Properties of Cosinusoids . . . . . . . . .6.1.3 Frequency and Angular Frequency . . . .6.1.4 Invariance and Complex Exponentials . .6.2 Filters and Filtering . . . . . . . . . . . . . . . .6.2.1 Filters . . . . . . . . . . . . . . . . . . . .6.2.2 Transfer Functions . . . . . . . . . . . . .6.2.3 Filtering Sines and Cosines . . . . . . . .6.2.4 Filtering General Series . . . . . . . . . .6.2.5 Computing Transfer Functions . . . . . .6.2.6 Sequential Filtering . . . . . . . . . . . .6.3 Spectral Theory . . . . . . . . . . . . . . . . . . .6.3.1 The Power Spectrum . . . . . . . . . . . .6.3.2 The Cramér Representation . . . . . . . .6.3.3 Using The Cramér Representation . . . .6.3.4 Power Spectrum Examples . . . . . . . sive Moving Average Series3.7.1 The ARMA(1,1) Series . . . .3.7.2 The ARMA(p,q) Model . . . .3.7.3 Computation . . . . . . . . . .3.7.4 Common Factors . . . . . . . .The Partial Autocorrelation Function3.8.1 Computing the PACF . . . . .3.8.2 Computation . . . . . . . . . .
Contents6.46.56.6vStatistical Inference . . . . . . . . . . . . . . . .6.4.1 Some Distribution Theory . . . . . . . . .6.4.2 The Periodogram and its Distribution . .6.4.3 An Example – Sunspot Numbers . . . . .6.4.4 Estimating The Power Spectrum . . . . .6.4.5 Tapering and Prewhitening . . . . . . . .6.4.6 Cross Spectral Analysis . . . . . . . . . .Computation . . . . . . . . . . . . . . . . . . . .6.5.1 A Simple Spectral Analysis Package for R6.5.2 Power Spectrum Estimation . . . . . . . .6.5.3 Cross-Spectral Analysis . . . . . . . . . .Examples . . . . . . . . . . . . . . . . . . . . . . 88. 88. 90. 91. 92. 95. 96. 99. 99. 99. 100. 100
viContents
Chapter 1Introduction1.1Time SeriesTime series arise as recordings of processes which vary over time. A recordingcan either be a continuous trace or a set of discrete observations. We willconcentrate on the case where observations are made at discrete equally spacedtimes. By appropriate choice of origin and scale we can take the observationtimes to be 1, 2, . . . T and we can denote the observations by Y1 , Y2 , . . . , YT .There are a number of things which are of interest in time series analysis.The most important of these are:Smoothing: The observed Yt are assumed to be the result of “noise” valuesεt additively contaminating a smooth signal ηt .Yt ηt εtWe may wish to recover the values of the underlying ηt .Modelling: We may wish to develop a simple mathematical model whichexplains the observed pattern of Y1 , Y2 , . . . , YT . This model may dependon unknown parameters and these will need to be estimated.Forecasting: On the basis of observations Y1 , Y2 , . . . , YT , we may wish topredict what the value of YT L will be (L 1), and possibly to give anindication of what the uncetainty is in the prediction.Control: We may wish to intervene with the process which is producing theYt values in such a way that the future values are altered to produce afavourable outcome.1.2Stationarity and Non-StationarityA key idea in time series is that of stationarity. Roughly speaking, a timeseries is stationary if its behaviour does not change over time. This means, forexample, that the values always tend to vary about the same level and thattheir variability is constant over time. Stationary series have a rich theory and1
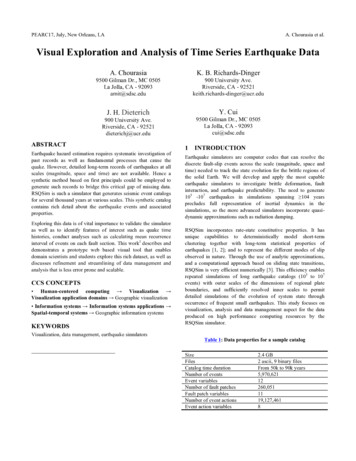
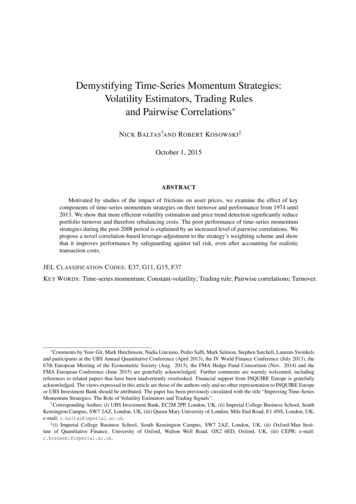
2Chapter 1. Introductiontheir behaviour is well understood. This means that they play a fundamentalrole in the study of time series.Obviously, not all time series that we encouter are stationary. Indeed, nonstationary series tend to be the rule rather than the exception. However, manytime series are related in simple ways to series which are stationary. Two important examples of this are:Trend models : The series we observe is the sum of a determinstic trendseries and a stationary noise series. A simple example is the linear trendmodel:Yt β0 β1 t εt .Another common trend model assumes that the series is the sum of aperiodic “seasonal” effect and stationary noise. There are many othervariations.Integrated models : The time series we observe satisfiesYt 1 Yt εt 1where εt is a stationary series. A particularly important model of this kindis the random walk. In that case, the εt values are independent “shocks”which perturb the current state Yt by an amount εt 1 to produce a newstate Yt 1 .1.31.3.1Some ExamplesAnnual Auckland RainfallFigure 1.1 shows the annual amount of rainfall in Auckland for the years from1949 to 2000. The general pattern of rainfall looks similar throughout the record,so this series could be regarded as being stationary. (There is a hint that rainfallamounts are declining over time, but this type of effect can occur over shortishtime spans for stationary series.)1.3.2Nile River FlowFigure 1.2 shows the flow volume of the Nile at Aswan from 1871 to 1970. Theseare yearly values. The general pattern of this data does not change over timeso it can be regarded as stationary (at least over this time period).1.3.3Yield on British Government SecuritiesFigure 1.3 shows the percentage yield on British Government securities, monthlyover a 21 year period. There is a steady long-term increase in the yields. Overthe period of observation a trend-plus-stationary series model looks like it mightbe appropriate. An integrated stationary series is another possibility.
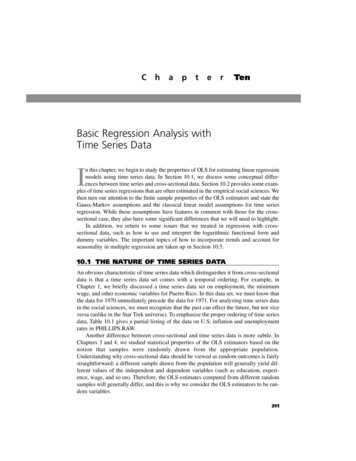
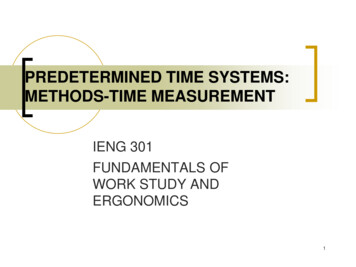
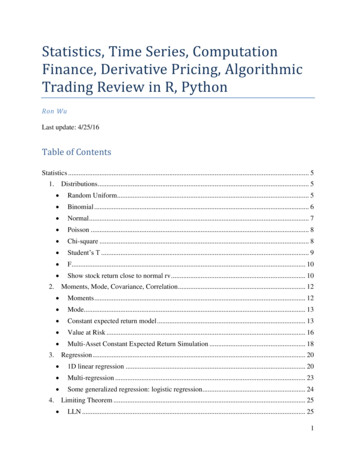
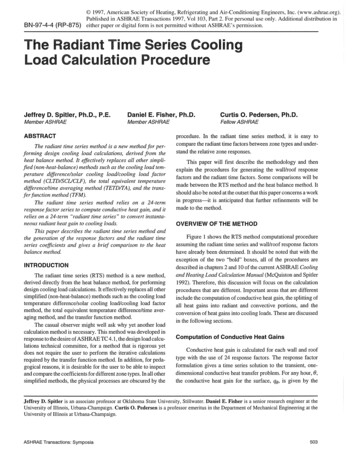
1.3. Some Examples1.3.43Ground Displacement in an EarthquakeFigure 1.4 shows one component of the horizontal ground motion resulting froman earthquake. The initial motion (a little after 4 seconds) corresponds to thearrival of the p-wave and the large spike just before six seconds corresponds tothe arrival of the s-wave. Later features correspond to the arrival of surfacewaves. This is an example of a transient signal and cannot have techniquesappropriate for stationary series applied to it.1.3.5United States Housing StartsFigure 1.5 shows the monthly number of housing starts in the Unites States (inthousands). Housing starts are a leading economic indicator. This means thatan increase in the number of housing starts indicates that economic growth islikely to follow and a decline in housing starts indicates that a recession may beon the way.1.3.6Iowa City Bus RidershipFigure 1.6 shows the monthly average weekday bus ridership for Iowa City overthe period from September 1971 to December 1982. There is clearly a strongseasonal effect suprimposed on top of a general upward trend.
4Chapter 1. Introduction200Annual Rainfall igure 1.1: Annual Auckland rainfall (in cm) from 1949 to 2000 (fromPaul 01960YearFigure 1.2: Flow volume of the Nile at Aswan from 1871 to 1970 (fromDurbin and Koopman).
1.3. Some Examples5Percent8642050100150200250MonthFigure 1.3: Monthly percentage yield on British Government securitiesover a 21 year period (from Chatfield).500400Displacement3002001000 100024681012SecondsFigure 1.4: Horizontal ground displacement during a small Nevadaearthquake (from Bill Peppin).
6Chapter 1. IntroductionHousing Starts (000s)2001501005019661968197019721974TimeFigure 1.5: Housing starts in the United States (000s) (from S-Plus).Average Weekly TimeFigure 1.6: Average weekday bus ridership, Iowa City (monthly ave)Sep 1971 - Dec 1982.
Chapter 2Vector Space Theory2.1Vectors In Two DimensionsThe theory which underlies time series analysis is quite technical in nature.In spite of this, a good deal of intuition can be developed by approaching thesubject geometrically. The geometric approach is based on the ideas of vectorsand vector spaces.2.1.1Scalar Multiplication and AdditionA good deal can be learnt about the theory of vectors by considering the twodimensional case. You can think of two dimensional vectors as being littlearrows which have a length and a direction. Individual vectors can be stretched(altering their length but not their direction) and pairs of vectors can be addedby placing them head to tail.To get more precise, we’ll suppose that a vector v extends for a distance xin the horizontal direction and a distance y in the vertical direction. This givesus a representation of the vector as a pair of numbers and we can write it asv (x, y).Doubling the length of the vector doubles the x and y values. In a similarway we can scale the length of the vector by any value, and this results in asimilar scaling of the x and y values. This gives us a natural way of definingmultiplication of a vector by a number.cv (cx, cy)A negative value for c produces a reversal of direction as well as change of lengthof magnitude c .Adding two vectors amounts to placing them head to tail and taking the sumto be the arrow which extends from the base of the first to the head of the second.This corresponds to adding the x and y values corresponding to the vectors. Fortwo vectors v 1 (x1 , y1 ) and v 2 (x2 , y2 ) the result is (x1 x2 , y1 y2 ). Thiscorresponds to a natural definition of addition for vectors.v 1 v 2 (x1 x2 , y1 y2 )7
82.1.2Chapter 2. Vector Space TheoryNorms and Inner ProductsWhile coordinates give a complete description of vectors, it is often more usefulto describe them in terms of the lengths of individual vectors and the anglesbetween pairs of vectors. If we denote the length of a vector by kuk, then byPythagoras’ theorem we knowpkuk x2 y 2 .Vector length has a number of simple properties:Positivity: For every vector u, we must have kuk 0, with equality if andonly if u 0.Linearity: For every scalar c and vector u we have kcuk c kuk.The Triangle Inequality: If u and v are vectors, then ku vk 6 kuk kvk.The first and second of these properties are obvious, and the third is simplya statement that the shortest distance between two points is a straight line.The technical mathematical name for the length of a vector is the norm
time series are related in simple ways to series which are stationary. Two im-portant examples of this are: Trend models : The series we observe is the sum of a determinstic trend series and a stationary noise series. A simple example is the linear trend model: Y t β 0 β 1t ε t. Another common trend model assumes that the series is the sum of a periodic “seasonal” effect and .