Transcription
ISSS608 Visual Analytics and ApplicationsCryptocurrency Price Analysis and Time SeriesForecastingGroup 7Chen PengGuo Yichao26 April 2020
1. OverviewThere are approximately 5,392 cryptocurrencies being traded with a total marketcapitalization of 201bn (as of April 22, 2020). Considerable growing rate is estimated inthe following years. With the help of cryptography and a collective booking system calledblockchain, cryptocurrencies build a distributed, safe and decentralized payment system,which does not need banks, intermediates, an organization or a central technicalinfrastructure to work.However, mainly due to lack of regulatory support, Cryptocurrencies are highly volatile,which makes it a risky investment. Therefore, in this project, a Shiny web application iscreated with the cryptocurrency analysis in mind. It integrates two types of analysis: TimeSeries Analysis and Correlation Analysis within one application. This application is madeto be informative and allows potential investors of cryptocurrency to interact with thedata embedded within the application, view the visualization and generate results basedon the selected filters before they make decision on cryptocurrency investment.In this project, historical price data of top 10 cryptocurrencies from 2018 to 2019 areextracted from https://coinmarketcap.com/ . Bitcoin (BTC) - is a consensus network that enables a new payment system and acompletely digital currency, born on October 31st, 2008. Powered by its users, it is a peerto peer payment network that requires no central authority to operate.Ethereum (ETH) - is a smart contract platform that enables developers to builddecentralized applications (dapps) conceptualized by Vitalik Buterin in 2013. ETH is thenative currency for the Ethereum platform and also works as the transaction fees tominers on the Ethereum network.XRP - is an independent digital asset that is native to the XRP Ledger. With governanceand fast transaction confirmations, XRP is said to be the most efficient settlement optionfor financial institutions and liquidity providers seeking global reach, accessibility, and fastsettlement finality for interbank flows.Tether (USDT) - is a cryptocurrency with a value meant to mirror the value of the U.S.dollar. The idea was to create a stable cryptocurrency that can be used like digital dollars.Coins that serve this purpose of being a stable dollar substitute are called “stable coins.”Litecoin - is a peer-to-peer cryptocurrency created by Charlie Lee. It was created basedon the Bitcoin protocol but differs in terms of the hashing algorithm used.Binance Coin (BNB) - is the cryptocurrency of the Binance platform. As of 2019, manybusinesses accept BNB as a form of payment.EOS - EOS.IO is a blockchain protocol powered by the native cryptocurrency EOS. Thesmart contract platform claims to eliminate transaction fees and also conduct millions oftransactions per second.Tezos (XTZ) - Developed by ex-Morgan Stanley analyst Arthur Breitman. Tezos (XTZ) is amulti-purpose platform that supports dApps and smart contracts, and is powered by XTZ.Stellar (XLM) – is the intermediary currency on the Stellar network.
Cardano (ADA) - is a decentralized platform that will allow complex programmabletransfers of value in a secure and scalable fashion.There are also two major cryptocurrencies: Bitcoin Cash and Bitcoin SV, with marketcapitalization of 4,459,706,172 and 3,633,013,064 (as of April 26, 2020). This researchdecides to use the historical price data from 2018 to 2019 for time series analysis andforecasting. However, a hard fork chain split of Bitcoin Cash occurred between two rivalfactions called Bitcoin Cash and Bitcoin SV on 15 November 2018. Hence, Bitcoin Cash andBitcoin SV are not under consideration in this project scope in order to keep theconsistency of the length of the data among multiple cryptocurrency.2. Motivation and ObjectivesDespite some of the limitations that cryptocurrencies presently face – such as computercrash or hacker interfering. What will be harder to overcome are governance andregulation. The more popular the cryptocurrencies become, the more regulation andgovernment monitor they might attract. What’s more, their relative complexitycompared to conventional currencies will likely deter most people. However, there is nodoubt that cryptocurrencies have shown their great potential on both investment andthe possibility of becoming part of the mainstream financial system. On the other hand,cryptocurrency also influences the balance between regulation and free market, whichrequire us to find out the possibility of making use of cryptocurrency and innovating theeconomic system. Therefore, Analysis on cryptocurrency is beneficial not only oneconomic but also academic.We aim to achieve the following objectives in our project:1. An overview of different cryptocurrency in time series, including open/close price,high/low price shown in a candlestick diagram and distribution of each cryptocurrencycapital.2. Correlation analyze among all cryptocurrency. Correlation analysis between Bitcoin andothers cryptocurrency, which will help us reveal the similar price pattern ofcryptocurrency.3. Time Series analyze to forecast the future close price. In this project, we will use thisdata as a starting point for a detailed analysis into what is driving price action, and whatcan be done to predict future movement.
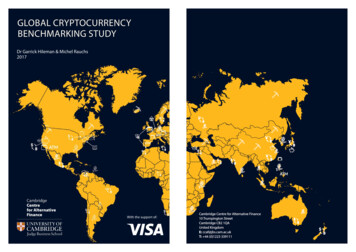
3. Review and critic on past worksThe image above shows a screenshot of the cryptocurrency and graph of Bitcoin onCoinMarketCap.Firstly the graph only shows the close price of the currency each day. Audience don’t knowthe open price, high price and low price. Therefore, candlestick chart is a good choice forvisualization.The cryptocurrency information in this website doesn’t contain further analysis, such ascorrelation analysis and time series analysis. In this application, we will do the correlationanalysis and time series analysis.4. Design framework & Demonstration4.1 Design Principles·User Centric: Create user guide to guide and educate on how to use the application.·Interactivity: Use functions to give audiences the application in an interactive way.
4.2 Cryptocurrency Market OverviewThe textbox tells us an overview of cryptocurrency: what is cryptocurrency and what iscryptocurrency market nowadays.This table shows the top 200 crypto currency in the world according to their marketcapital. We can not only get the market capital from this table, but also other usefulinformation, such as trading volume and close price.
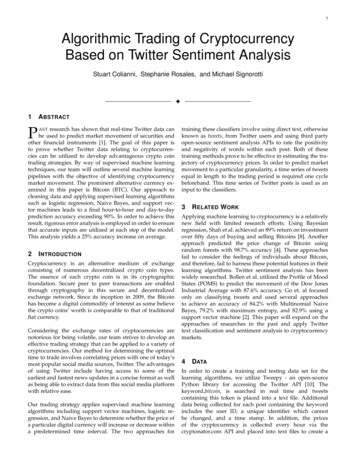
Tree map are basically rectangles placed adjacent to each other. The levels in thehierarchy of the tree map are visualized as rectangles containing other rectangles. Eachset of large rectangles on the higher level in the hierarchy represents the Industry whichstocks belong to. And each individual rectangle on lower level shows the top 100 cryptocurrency in the market. The size of each rectangle is directly proportional the MarketCapitalization of each crypto currency in the market. The color in each rectanglesrepresents the trading volume. The blue shows the higher stock price whereas the yellowshows lower. For example, as you can see from the tree map, Bitcoin has the largestcapital among the others. In this receipt, we implement tree map using the “treemap”package. If user move the cursor to the whole industry, the diagram will pop up a windowshowing the market capital and volume.4.3 Candlestick Chart
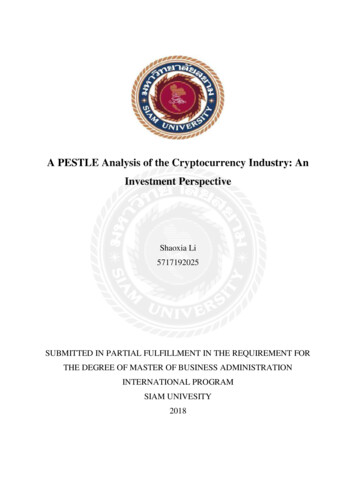
This Candlestick chart shows the historical data from 2018 to 2019 of one of the tenpopular cryptocurrencies. Data contain open price, close price, highest price and lowestprice of each day during this period. This chart provides an overview of the trend andhistorical price details in some certain periods. In order to explore the historical data ofdifferent cryptocurrencies, there is a selection panel to select certain cryptocurrency.This chart is interactive that tools are available on the upper right corner of the chart. Wecan select a certain period and zoom it in order to explore the detailed information.
A check box is available below the currency selection panel to display the detailedinformation as a data table.4.4 Correlation AnalysisIn this section, we use another dataset which is derived from the main dataset that itscolumn [1] is Date, while column [2:11] are different cryptocurrencies. The numeric dataare close price from 2018 to 2019.
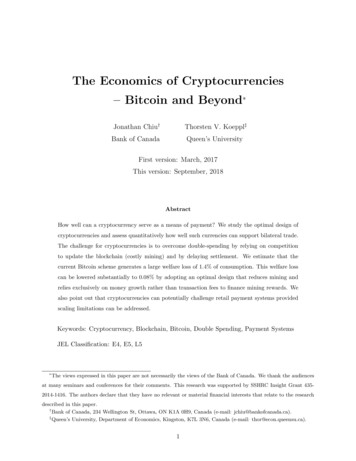
This correlation matrix is calculated using Pearson Correlation Formula:And p-value is also calculated using Pearson formula with 95% confidence level and 5%significance level. No significant coefficient will be shown as a cross on the chart.Rectangles on the chart represent the results of hierarchical clustering in order tohighlight the correlated cryptocurrencies as groups.To explore the details between two cryptocurrencies, a scatter plot is available that wecan choose the pair through changing the selection box on the left. Detailed data table isalso provided.4.5 Time Series AnalysisOn the technical indicator selection panel, users can choose from the followingcryptocurrency for further time series forecasting.
1) ARIMA ModelModel explanation box will briefly introduce the model in this analysis. Model 1 is ARIMAmodel, in statistics and econometrics, and in particular in time series analysis, anautoregressive integrated moving average (ARIMA) model is a generalization of anautoregressive moving average (ARMA) model. Both of these models are fitted to timeseries data either to better understand the data or to predict future points in the series(forecasting). ARIMA models are applied in some cases where data show evidence of nonstationarity, where an initial differencing step (corresponding to the 'integrated' part ofthe model) can be applied one or more times to eliminate the non-stationarity.In forecasting, The ARIMA model can be viewed as a "cascade" of two models. The first isnon-stationary:while the second is wide-sense stationary:Therefore, forecasts can be made for the process Yt, using a generalization of the methodof autoregressive forecasting.
This plot not only shows the historical data for the currency that user selected. But alsothe predict price for the future by using ARIMA model. In addition, it also gives audience95% confidence line and 80% confidence line for further analyze.2) Neural Network ModelModel explanation box will briefly introduce the model in this analysis. Model 2 is NeuralNetwork model, it is a simplified model of the way the human brain processes information.It works by simulating a large number of interconnected processing units that resembleabstract versions of neurons.The network learns by examining individual records, generating a prediction for eachrecord, and making adjustments to the weights whenever it makes an incorrect prediction.This process is repeated many times, and the network continues to improve itspredictions until one or more of the stopping criteria have been met.
Formula:Initially, all weights are random, and the answers that come out of the net are probablynonsensical. The network learns through training. Examples for which the output isknown are repeatedly presented to the network, and the answers it gives are comparedto the known outcomes. Information from this comparison is passed back through thenetwork, gradually changing the weights. As training progresses, the network becomesincreasingly accurate in replicating the known outcomes. Once trained, the network canbe applied to future cases where the outcome is unknown.This plot not only shows the historical data for the currency that user selected. But alsothe predict price for the future by using Neural Network Model. This plot is an interactiveplot that allow user to get the detail information when move the cursor to the line chart.3) Exponential Smoothing ModelModel explanation box will briefly introduce the model in this analysis. Model 3 is theExponential Smoothing Model, it is a family of forecasting methods which computes aweighted average of past observations as the forecast. The weights are decayingexponentially as the observations get older. As a result, the more recent the observation,the higher its weight in the forecast. The family of exponential smoothing methodsmodels three aspects of time series: the trend level, trend slope, and a seasonalcomponent. These three aspects give rise to three types of exponential smoothing: single
exponential smoothing, double exponential smoothing, and triple exponential smoothing(also known as the Holt-Winters method).Formula:This plot not only shows the historical data for the currency that user selected. But alsothe predict price for the future by using Neural Network Model. This plot is an interactiveplot that allow user to get the detail information when move the cursor to the line chart.This plot not only shows the historical data for the currency that user selected. But alsothe predict price for the future by using ARIMA model. In addition, it also gives audience95% confidence line and 80% confidence line for further analyze.5. Discussion5.1 Insight1) Market capital and Volume among crypto currency
As we can see from the tree map above, Bitcoin has the largest market capital, whileTether’s trading volume rank the first position. Besides Bitcoin and Tether, Ethereum, XRP,Bitcoin SV, Litecoin, Binance Coin, EOS, Tezos and Cardano are the top 10 in the cryptocurrency market.2) Candlestick chart of cryptocurrency historical dataBitcoinBinance-coinFrom the two candlestick charts of Bitcoin and Binance-coin from 2018 to 2019, we cansee that they both show the pattern of undulation, while other 8 cryptocurrency show anobvious decline trend. Cryptocurrency price dropped down because of the highlyleveraged nature of the cryptocurrency market and the unwillingness of buyers to step in
amid extreme volatility and uncertainty. However, Industry executives remain positiveafter the big drop.4) Correlation AnalysisFrom the correlation matrix we can find out that the cryptocurrencies have been dividedinto three clusters. EOS, Tezos, Litecoin, Cardano, Xrp, Ethereum and Stellar showrelatively strong positive correlations. Along with the conclusion in former section, thissituation might be because the whole industry has been influenced by same reason.Bitcoin and Binance-coin might be more sensitive facing industrial impact so that theyshow the pattern of undulation. This may draw a conclusion that cryptocurrency marketand price might be strongly influence by common facts such as industrial changes,technology and regulation.5) Time series forecasting
When we focus on the model 2, we can find that the model gives us the result that theprice of Bitcoin will increase in the near future. Furthermore, due to the volatility of thebitcoin, it is difficult to make an accuracy prediction by using a simple predict model.5.2 Lesson LearntTime Series Data: For the creation of Time Series Analysis, it was important that time IDswere present and in the right format so that the further visualization and analysis can bedeployed, hence “lubridate” and “XTS” package had to be used to overcome theformatting of the time IDs.Data preparation is very significant that a tiny data format error might lead to plottingfailure.6. Future Work1) Real Time InteractivityCurrently, our application only visualize historical cryptocurrency market price data.Moving forwards, we will link our application to the cryptocurrency website to get realtime interactivity. The number of cryptocurrencies is increasing rapidly, while this projectmainly focus on top 10 cryptocurrencies. Enlarging the dataset and adding newcryptocurrency can be done in the future work.2) Time Series ForecastingPerform model test result for a large number of data with different forecasting models tochoose the best model.
7. PackageList of R Packages/Libraries Used shiny, shinydashboard, lubridate, plotly, TTR, vcd, tseries,forecast, treemap, highcharter, tidyverse, corrplot.8. ReferenceData Source: https://coinmarketcap.com/Barone, A. (2019) The Future Of Cryptocurrency in 2019 and Beyond. /forex/091013/futurecryptocurrency.aspBagshaw, R. (2020) Top 10 cryptocurrencies by market capitalisation. ncies-by-market-capitalisation/Derbentsev, V., Datsenko, N., Stepanenko, O., & Bezkorovainyi, V. (2019). Forecastingcryptocurrency prices time series using machine learning approach. SHS Web ofConferences, 65. https://doi.org/10.1051/shsconf/20196502001Ehlers, S., & Gauer, K. (2019). Beyond Bitcoin: A Statistical Comparison of LeadingCryptocurrencies and Fiat Currencies and Their Impact on Portfolio 1.072Radovanov, B., Marcikic, A., & Gvozdenović, N. (2018). A Time Series Analysis of FourMajorCryptocurrencies. FACTAUNIVERSITATISEconomicsandOrganization, 15(3), 271–278.Sajter, D. (2019). TIME-SERIES ANALYSIS OF THE MOST COMMON CRYPTOCURRENCIES*. EkonomskaMisaoiPraksa, t.com/docview/2249689505/Young, J. (2020) Crypto Traders Explain What Caused the Bitcoin Price Plunge to the 3KRange. Cointelegraph. ainwhat-caused-the-bitcoin-price-plunge-to-3-000
the open price, high price and low price. Therefore, candlestick chart is a good choice for visualization. The cryptocurrency information in this website doesn't contain further analysis, such as correlation analysis and time series analysis. In this application, we will do the correlation analysis and time series analysis. 4.