Transcription
Introduction toTime Series andForecasting,Second EditionPeter J. BrockwellRichard A. DavisSpringer
The Bartlett Press, Inc.brockwel8 · i · 20021:59 p.m.Springer Texts in StatisticsAdvisors:George CasellaSpringerNew YorkBerlinHeidelbergBarcelonaHong KongLondonMilanParisSingaporeTokyoStephen FienbergIngram OlkinPage i
This page intentionally left blank
The Bartlett Press, Inc.brockwel8 · i · 2002Peter J. Brockwell1:59 p.m.Richard A. DavisIntroductionto Time Seriesand ForecastingSecond EditionWith 126 IllustrationsIncludes CD-ROM13Page iii
The Bartlett Press, Inc.brockwelPeter J. BrockwellDepartment of StatisticsColorado State UniversityFort Collins, CO 80523USApjbrock@stat.colostate.edu8 · i · 20021:59 p.m.Page ivRichard A. DavisDepartment of StatisticsColorado State UniversityFort Collins, CO 80523USArdavis@stat.colostate.eduEditorial BoardGeorge CasellaDepartment of StatisticsGriffin-Floyd HallUniversity of FloridaP.O. Box 118545Gainesville, FL 32611-8545USAStephen FienbergDepartment of StatisticsCarnegie Mellon UniversityPittsburgh, PA 15213-3890USAIngram OlkinDepartment of StatisticsStanford UniversityStanford, CA 94305USALibrary of Congress Cataloging-in-Publication DataBrockwell, Peter J.Introduction to time series and forecasting / Peter J. Brockwell and Richard A. Davis.—2nd ed.p. cm. — (Springer texts in statistics)Includes bibliographical references and index.ISBN 0-387-95351-5 (alk. paper)1. Time-series analysis. I. Davis, Richard A. II. Title. III. Series.QA280.B757 2002519.5 5—dc212001049262Printed on acid-free paper. 2002, 1996 Springer-Verlag New York, Inc.All rights reserved. This work may not be translated or copied in whole or in part without the written permission ofthe publishers (Springer-Verlag New York, Inc., 175 Fifth Avenue, New York, NY 10010, USA), except for briefexcerpts in connection with reviews or scholarly analysis. Use in connection with any form of information storageand retrieval, electronic adaptation, computer software, or by similar or dissimilar methodology now known orhereafter developed is forbidden.The use of general descriptive names, trade names, trademarks, etc., in this publication, even if the former arenot especially identified, is not to be taken as a sign that such names, as understood by the Trade Marks andMerchandise Marks Act, may accordingly be used freely by anyone.Production managed by MaryAnn Brickner; manufacturing supervised by Joe Quatela.Typeset by The Bartlett Press, Inc., Marietta, GA.Printed and bound by R.R. Donnelley and Sons, Harrisonburg, VA.Printed in the United States of America.987654ISBN 0-387-95351-532 1SPIN 10850334Springer-Verlag New York Berlin HeidelbergA member of BertelsmannSpringer Science Business Media GmbHDisclaimer:This eBook does not include the ancillary media that waspackaged with the original printed version of the book.
The Bartlett Press, Inc.brockwel8 · i · 20021:59 p.m.Page vTo Pam and Patti
This page intentionally left blank
The Bartlett Press, Inc.brockwel8 · i · 20021:59 p.m.Page viiPrefaceThis book is aimed at the reader who wishes to gain a working knowledge of timeseries and forecasting methods as applied in economics, engineering and the naturaland social sciences. Unlike our earlier book, Time Series: Theory and Methods, referred to in the text as TSTM, this one requires only a knowledge of basic calculus,matrix algebra and elementary statistics at the level (for example) of Mendenhall,Wackerly and Scheaffer (1990). It is intended for upper-level undergraduate studentsand beginning graduate students.The emphasis is on methods and the analysis of data sets. The student versionof the time series package ITSM2000, enabling the reader to reproduce most of thecalculations in the text (and to analyze further data sets of the reader’s own choosing),is included on the CD-ROM which accompanies the book. The data sets used in thebook are also included. The package requires an IBM-compatible PC operating underWindows 95, NT version 4.0, or a later version of either of these operating systems.The program ITSM can be run directly from the CD-ROM or installed on a hard diskas described at the beginning of Appendix D, where a detailed introduction to thepackage is provided.Very little prior familiarity with computing is required in order to use the computerpackage. Detailed instructions for its use are found in the on-line help files whichare accessed, when the program ITSM is running, by selecting the menu optionHelp Contents and selecting the topic of interest. Under the heading Data youwill find information concerning the data sets stored on the CD-ROM. The book canalso be used in conjunction with other computer packages for handling time series.Chapter 14 of the book by Venables and Ripley (1994) describes how to performmany of the calculations using S-plus.There are numerous problems at the end of each chapter, many of which involveuse of the programs to study the data sets provided.To make the underlying theory accessible to a wider audience, we have statedsome of the key mathematical results without proof, but have attempted to ensurethat the logical structure of the development is otherwise complete. (References toproofs are provided for the interested reader.)
The Bartlett Press, Inc.viiibrockwel8 · i · 20021:59 p.m.Page viiiPrefaceSince the upgrade to ITSM2000 occurred after the first edition of this bookappeared, we have taken the opportunity, in this edition, to coordinate the text withthe new software, to make a number of corrections pointed out by readers of the firstedition and to expand on several of the topics treated only briefly in the first edition.Appendix D, the software tutorial, has been rewritten in order to be compatiblewith the new version of the software.Some of the other extensive changes occur in (i) Section 6.6, which highlightsthe role of the innovations algorithm in generalized least squares and maximumlikelihood estimation of regression models with time series errors, (ii) Section 6.4,where the treatment of forecast functions for ARIMA processes has been expandedand (iii) Section 10.3, which now includes GARCH modeling and simulation, topicsof considerable importance in the analysis of financial time series. The new materialhas been incorporated into the accompanying software, to which we have also addedthe option Autofit. This streamlines the modeling of time series data by fittingmaximum likelihood ARMA(p, q) models for a specified range of (p, q) values andautomatically selecting the model with smallest AICC value.There is sufficient material here for a full-year introduction to univariate and multivariate time series and forecasting. Chapters 1 through 6 have been used for severalyears in introductory one-semester courses in univariate time series at Colorado StateUniversity and Royal Melbourne Institute of Technology. The chapter on spectralanalysis can be excluded without loss of continuity by readers who are so inclined.We are greatly indebted to the readers of the first edition and especially to MatthewCalder, coauthor of the new computer package, and Anthony Brockwell for theirmany valuable comments and suggestions. We also wish to thank Colorado StateUniversity, the National Science Foundation, Springer-Verlag and our families fortheir continuing support during the preparation of this second edition.Fort Collins, ColoradoAugust 2001Peter J. BrockwellRichard A. Davis
The Bartlett Press, Inc.brockwel8 · i · 20021:59 p.m.Page ixContentsPreface1. Introduction1.1. Examples of Time Series1.2. Objectives of Time Series Analysis1.3. Some Simple Time Series Models1.3.1. Some Zero-Mean Models1.3.2. Models with Trend and Seasonality1.3.3. A General Approach to Time Series Modeling1.4. Stationary Models and the Autocorrelation Function1.4.1. The Sample Autocorrelation Function1.4.2. A Model for the Lake Huron Data1.5. Estimation and Elimination of Trend and Seasonal Components1.5.1. Estimation and Elimination of Trend in the Absence ofSeasonality1.5.2. Estimation and Elimination of Both Trend andSeasonality1.6. Testing the Estimated Noise SequenceProblems2. Stationary Processes2.1.2.2.2.3.2.4.Basic PropertiesLinear ProcessesIntroduction to ARMA ProcessesProperties of the Sample Mean and Autocorrelation Function2.4.1. Estimation of µ2.4.2. Estimation of γ (·) and ρ(·)2.5. Forecasting Stationary Time Series2.5.1. The Durbin–Levinson Algorithm2.5.2. The Innovations Algorithm2.5.3. Prediction of a Stationary Process in Terms of InfinitelyMany Past 97175
The Bartlett Press, Inc.xbrockwel8 · i · 20021:59 p.m.Page xContents2.6. The Wold DecompositionProblems3. ARMA Models3.1. ARMA(p, q ) Processes3.2. The ACF and PACF of an ARMA(p, q ) Process3.2.1. Calculation of the ACVF3.2.2. The Autocorrelation Function3.2.3. The Partial Autocorrelation Function3.2.4. Examples3.3. Forecasting ARMA ProcessesProblems4. Spectral Analysis4.1. Spectral Densities4.2. The Periodogram4.3. Time-Invariant Linear Filters4.4. The Spectral Density of an ARMA ProcessProblems5. Modeling and Forecasting with ARMA Processes5.1. Preliminary Estimation5.1.1. Yule–Walker Estimation5.1.2. Burg’s Algorithm5.1.3. The Innovations Algorithm5.1.4. The Hannan–Rissanen Algorithm5.2. Maximum Likelihood Estimation5.3. Diagnostic Checking 5.3.1. The Graph of R̂t , t 1, . . . , n5.3.2. The Sample ACF of the Residuals5.3.3. Tests for Randomness of the Residuals5.4. Forecasting5.5. Order Selection5.5.1. The FPE Criterion5.5.2. The AICC 01711746. Nonstationary and Seasonal Time Series Models1796.1. ARIMA Models for Nonstationary Time Series6.2. Identification Techniques180187
The Bartlett Press, Inc.brockwel8 · i · 20021:59 p.m.Page xiContentsxi6.3. Unit Roots in Time Series Models6.3.1. Unit Roots in Autoregressions6.3.2. Unit Roots in Moving Averages6.4. Forecasting ARIMA Models6.4.1. The Forecast Function6.5. Seasonal ARIMA Models6.5.1. Forecasting SARIMA Processes6.6. Regression with ARMA Errors6.6.1. OLS and GLS Estimation6.6.2. ML EstimationProblems7. Multivariate Time Series7.1. Examples7.2. Second-Order Properties of Multivariate Time Series7.3. Estimation of the Mean and Covariance Function7.3.1. Estimation of µ7.3.2. Estimation of (h)7.3.3. Testing for Independence of Two Stationary Time Series7.3.4. Bartlett’s Formula7.4. Multivariate ARMA Processes7.4.1. The Covariance Matrix Function of a Causal ARMAProcess7.5. Best Linear Predictors of Second-Order Random Vectors7.6. Modeling and Forecasting with Multivariate AR Processes7.6.1. Estimation for Autoregressive Processes Using Whittle’sAlgorithm7.6.2. Forecasting Multivariate Autoregressive Processes7.7. CointegrationProblems8. State-Space Models8.1.8.2.8.3.8.4.8.5.8.6.8.7.8.8.State-Space RepresentationsThe Basic Structural ModelState-Space Representation of ARIMA ModelsThe Kalman RecursionsEstimation For State-Space ModelsState-Space Models with Missing ObservationsThe EM AlgorithmGeneralized State-Space Models8.8.1. Parameter-Driven 71277283289292292
The Bartlett Press, Inc.xiibrockwel8 · i · 20021:59 p.m.Page xiiContents8.8.2. Observation-Driven ModelsProblems9. Forecasting Techniques9.1. The ARAR Algorithm9.1.1. Memory Shortening9.1.2. Fitting a Subset Autoregression9.1.3. Forecasting9.1.4. Application of the ARAR Algorithm9.2. The Holt–Winters Algorithm9.2.1. The Algorithm9.2.2. Holt–Winters and ARIMA Forecasting9.3. The Holt–Winters Seasonal Algorithm9.3.1. The Algorithm9.3.2. Holt–Winters Seasonal and ARIMA Forecasting9.4. Choosing a Forecasting AlgorithmProblems10. Further Topics10.1. Transfer Function Models10.1.1. Prediction Based on a Transfer Function Model10.2. Intervention Analysis10.3. Nonlinear Models10.3.1. Deviations from Linearity10.3.2. Chaotic Deterministic Sequences10.3.3. Distinguishing Between White Noise and iid Sequences10.3.4. Three Useful Classes of Nonlinear Models10.3.5. Modeling Volatility10.4. Continuous-Time Models10.5. Long-Memory ModelsProblemsA. Random Variables and Probability DistributionsA.1. Distribution Functions and ExpectationA.2. Random VectorsA.3. The Multivariate Normal 7361365369369374377381
The Bartlett Press, Inc.brockwel8 · i · 20021:59 p.m.Page xiiiContentsB. Statistical ComplementsB.1. Least Squares EstimationB.1.1. The Gauss-Markov TheoremB.1.2. Generalized Least SquaresB.2. Maximum Likelihood EstimationB.2.1. Properties of Maximum Likelihood EstimatorsB.3. Confidence IntervalsB.3.1. Large-Sample Confidence RegionsB.4. Hypothesis TestingB.4.1. Error ProbabilitiesB.4.2. Large-Sample Tests Based on Confidence Regionsxiii383383385386386387388388389390390C. Mean Square Convergence393C.1. The Cauchy Criterion393D. An ITSM TutorialD.1. Getting StartedD.1.1. Running ITSMD.2. Preparing Your Data for ModelingD.2.1. Entering DataD.2.2. InformationD.2.3. Filing DataD.2.4. Plotting DataD.2.5. Transforming DataD.3. Finding a Model for Your DataD.3.1. AutofitD.3.2. The Sample ACF and PACFD.3.3. Entering a ModelD.3.4. Preliminary EstimationD.3.5. The AICC StatisticD.3.6. Changing Your ModelD.3.7. Maximum Likelihood EstimationD.3.8. Optimization ResultsD.4. Testing Your ModelD.4.1. Plotting the ResidualsD.4.2. ACF/PACF of the ResidualsD.4.3. Testing for Randomness of the ResidualsD.5. PredictionD.5.1. Forecast CriteriaD.5.2. Forecast 08408409410411412412414415415415
The Bartlett Press, Inc.xivbrockwel8 · i · 20021:59 p.m.Page xivContentsD.6. Model PropertiesD.6.1. ARMA ModelsD.6.2. Model ACF, PACFD.6.3. Model RepresentationsD.6.4. Generating Realizations of a Random SeriesD.6.5. Spectral PropertiesD.7. Multivariate Time Series416417418419420421421References423Index429
The Bartlett Press, Inc.1brockwel8 · i · 20021:59 p.m.Page 1Introduction1.11.21.31.41.51.6Examples of Time SeriesObjectives of Time Series AnalysisSome Simple Time Series ModelsStationary Models and the Autocorrelation FunctionEstimation and Elimination of Trend and Seasonal ComponentsTesting the Estimated Noise SequenceIn this chapter we introduce some basic ideas of time series analysis and stochasticprocesses. Of particular importance are the concepts of stationarity and the autocovariance and sample autocovariance functions. Some standard techniques are describedfor the estimation and removal of trend and seasonality (of known period) from anobserved time series. These are illustrated with reference to the data sets in Section1.1. The calculations in all the examples can be carried out using the time series package ITSM, the student version of which is supplied on the enclosed CD. The data setsare contained in files with names ending in .TSM. For example, the Australian redwine sales are filed as WINE.TSM. Most of the topics covered in this chapter willbe developed more fully in later sections of the book. The reader who is not alreadyfamiliar with random variables and random vectors should first read Appendix A,where a concise account of the required background is given.1.1Examples of Time SeriesA time series is a set of observations xt , each one being recorded at a specific time t .A discrete-time time series (the type to which this book is primarily devoted) is onein which the set T0 of times at which observations are made is a discrete set, as is the
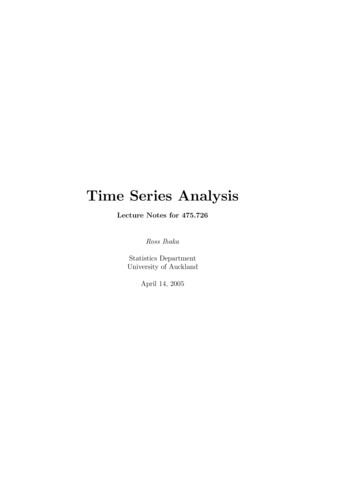
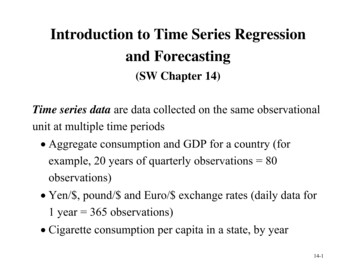
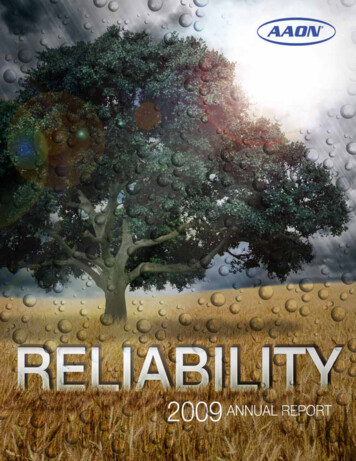
The Bartlett Press, Inc.8 · i · 20021:59 p.m.Page 2IntroductionFigure 1-1The Australian red winesales, Jan. ‘80 – Oct. ‘91.0.51.01.52.02.53.0Chapter ase, for example, when observations are made at fixed time intervals. Continuoustime time series are obtained when observations are recorded continuously over sometime interval, e.g., when T0 [0, 1].Example 1.1.1Australian red wine sales; WINE.TSMFigure 1.1 shows the monthly sales (in kiloliters) of red wine by Australian winemakers from January 1980 through October 1991. In this case the set T0 consists of the142 times {(Jan. 1980), (Feb. 1980), . . . ,(Oct. 1991)}. Given a set of n observationsmade at uniformly spaced time intervals, it is often convenient to rescale the timeaxis in such a way that T0 becomes the set of integers {1, 2, . . . , n}. In the presentexample this amounts to measuring time in months with (Jan. 1980) as month 1. ThenT0 is the set {1, 2, . . . , 142}. It appears from the graph that the sales have an upwardtrend and a seasonal pattern with a peak in July and a trough in January. To plot thedata using ITSM, run the program by double-clicking on the ITSM icon and thenselect the option File Project Open Univariate, click OK, and select the fileWINE.TSM. The graph of the data will then appear on your screen.Example 1.1.2All-star baseball games, 1933–1995Figure 1.2 shows the results of the all-star games by plotting xt , where 1if the National League won in year t,xt 1 if the American League won in year t.
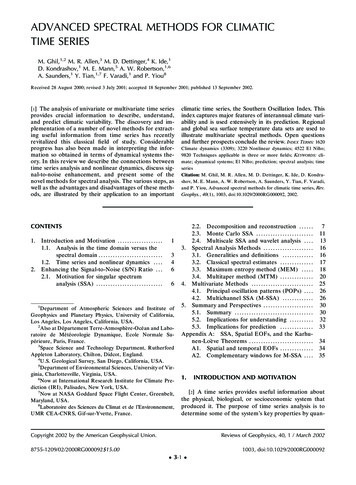
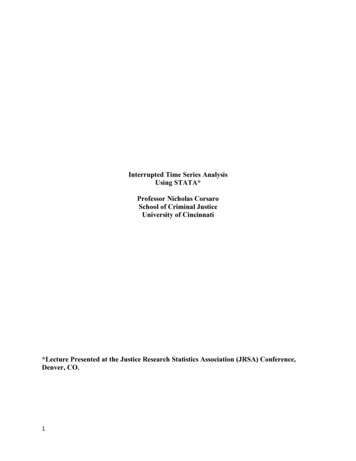
The Bartlett Press, Inc.8 · i · 20021:59 p.m.Page 3Examples of Time Series3-10121.1brockwel-2Figure 1-2Results of theall-star baseballgames, 1933–1995.194019501960197019801990This is a series with only two possible values, 1. It also has some missing values,since no game was played in 1945, and two games were scheduled for each of theyears 1959–1962.Example 1.1.3Accidental deaths, U.S.A., 1973–1978; DEATHS.TSMLike the red wine sales, the monthly accidental death figures show a strong seasonalpattern, with the maximum for each year occurring in July and the minimum for eachyear occurring in February. The presence of a trend in Figure 1.3 is much less apparentthan in the wine sales. In Section 1.5 we shall consider the problem of representingthe data as the sum of a trend, a seasonal component, and a residual term.Example 1.1.4A signal detection problem; SIGNAL.TSMFigure 1.4 shows simulated values of the series tXt cos Nt , t 1, 2, . . . , 200,10where {Nt } is a sequence of independent normal random variables, with mean 0and variance 0.25. Such a series is often referred to as signal plus noise, the signalbeing the smooth function, St cos( 10t ) in this case. Given only the data Xt , howcan we determine the unknown signal component? There are many approaches tothis general problem under varying assumptions about the signal and the noise. Onesimple approach is to smooth the data by expressing Xt as a sum of sine waves ofvarious frequencies (see Section 4.2) and eliminating the high-frequency components.If we do this to the values of {Xt } shown in Figure 1.4 and retain only the lowest
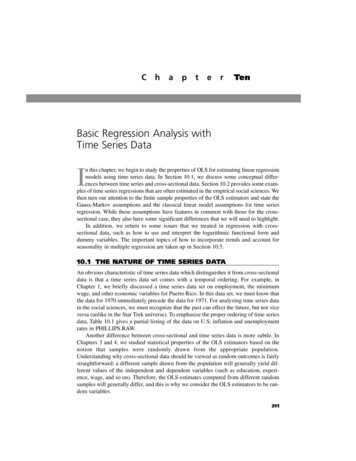
The Bartlett Press, Inc.1:59 p.m.Page 4Introduction978(thousands)1011Chapter 18 · i · 2002Figure 1-3The monthly accidentaldeaths data, re 1-4The series {Xt } ofExample 1.1.4.-24brockwel05101520
The Bartlett Press, Inc.8 · i · 20021:59 p.m.Page 5Examples of Time gure 1-50Population of theU.S.A. at ten-yearintervals, 04.53.54.0(thousands)5.56.01800Figure 1-6Strikes in theU.S.A., 1951–1980.1950196019701980
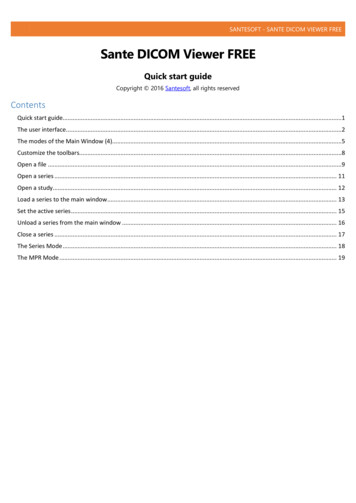
The Bartlett Press, Inc.6Chapter 1brockwel8 · i · 20021:59 p.m.Page 6Introduction3.5% of the frequency components, we obtain the estimate of the signal also shownin Figure 1.4. The waveform of the signal is quite close to that of the true signal inthis case, although its amplitude is somewhat smaller.Example 1.1.5Population of the U.S.A., 1790–1990; USPOP.TSMThe population of the U.S.A., measured at ten-year intervals, is shown in Figure 1.5.The graph suggests the possibility of fitting a quadratic or exponential trend to thedata. We shall explore this further in Section 1.3.Example 1.1.6Number of strikes per year in the U.S.A., 1951–1980; STRIKES.TSMThe annual numbers of strikes in the U.S.A. for the years 1951–1980 are shown inFigure 1.6. They appear to fluctuate erratically about a slowly changing level.1.2Objectives of Time Series AnalysisThe examples considered in Section 1.1 are an extremely small sample from themultitude of time series encountered in the fields of engineering, science, sociology,and economics. Our purpose in this book is to study techniques for drawing inferencesfrom such series. Before we can do this, however, it is necessary to set up a hypotheticalprobability model to represent the data. After an appropriate family of models hasbeen chosen, it is then possible to estimate parameters, check for goodness of fit tothe data, and possibly to use the fitted model to enhance our understanding of themechanism generating the series. Once a satisfactory model has been developed, itmay be used in a variety of ways depending on the particular field of application.The model may be used simply to provide a compact description of the data. Wemay, for example, be able to represent the accidental deaths data of Example 1.1.3 asthe sum of a specified trend, and seasonal and random terms. For the interpretationof economic statistics such as unemployment figures, it is important to recognize thepresence of seasonal components and to remove them so as not to confuse them withlong-term trends. This process is known as seasonal adjustment. Other applicationsof time series models include separation (or filtering) of noise from signals as inExample 1.1.4, prediction of future values of a series such as the red wine sales inExample 1.1.1 or the population data in Example 1.1.5, testing hypotheses such asglobal warming using recorded temperature data, predicting one series from observations of another, e.g., predicting future sales using advertising expenditure data,and controlling future values of a series by adjusting parameters. Time series modelsare also useful in simulation studies. For example, the performance of a reservoirdepends heavily on the random daily inputs of water to the system. If these are modeled as a time series, then we can use the fitted model to simulate a large numberof independent sequences of daily inputs. Knowing the size and mode of operation
The Bartlett Press, Inc.1.3brockwel8 · i · 20021:59 p.m.Page 7Some Simple Time Series Models7of the reservoir, we can determine the fraction of the simulated input sequences thatcause the reservoir to run out of water in a given time period. This fraction will thenbe an estimate of the probability of emptiness of the reservoir at some time in thegiven period.1.3Some Simple Time Series ModelsAn important part of the analysis of a time series is the selection of a suitable probability model (or class of models) for the data. To allow for the possibly unpredictablenature of future observations it is natural to suppose that each observation xt is arealized value of a certain random variable Xt .Definition 1.3.1A time series model for the observed data {xt } is a specification of the jointdistributions (or possibly only the means and covariances) of a sequence of randomvariables {Xt } of which {xt } is postulated to be a realization.Remark. We shall frequently use the term time series to mean both the data andthe process of which it is a realization.A complete probabilistic time series model for the sequence of random variables {X1 , X2 , . . .} would specify all of the joint distributions of the random vectors(X1 , . . . , Xn ) , n 1, 2, . . ., or equivalently all of the probabilitiesP [X1 x1 , . . . , Xn xn ], x1 , . . . , xn ,n 1, 2 , . . . .Such a specification is rarely used in time series analysis (unless the data are generatedby some well-understood simple mechanism), since in general it will contain far toomany parameters to be estimated from the available data. Instead we specify only thefirst- and second-order moments of the joint distributions, i.e., the expected valuesEXt and the expected products E(Xt h Xt ), t 1, 2, . . ., h 0, 1, 2, . . ., focusingon properties of the sequence {Xt } that depend only on these. Such properties of {Xt }are referred to as second-order properties. In the particular case where all the jointdistributions are multivariate normal, the second-order properties of {Xt } completelydetermine the joint distributions and hence give a complete probabilistic characterization of the sequence. In general we shall lose a certain amount of information bylooking at time series “through second-order spectacles”; however, as we shall seein Chapter 2, the theory of minimum mean squared error linear prediction dependsonly on the second-order properties, thus providing further justification for the useof the second-order characterization of time series models.Figure 1.7 shows one of many possible realizations of {St , t 1, . . . , 200}, where{St } is a sequence of random variables specified in Example 1.3.3 below. In mostpractical problems involving time series we see only one realization. For example,
The Bartlett Press, Inc.8Chapter 1brockwel8 · i · 20021:59 p.m.Page 8Introductionthere is only one available realization of Fort Collins’s annual rainfall for the years1900–1996, but we imagine it to be one of the many sequences that might haveoccurred. In the following examples we introduce some simple time series models.One of our goals will be to expand this repertoire so as to have at our disposal a broadrange of models with which to try to match the observed behavior of given data sets.1.3.1Example 1.3.1Some Zero-Mean Modelsiid noisePerhaps the simplest model for a time series is one in which there is no trend orseasonal component and in which the observations are simply independent and identically distributed (iid) random variables with zero mean. We refer to such a sequenceof random variables X1 , X2 , . . . as iid noise. By definition we can write, for anypositive integer n and real numbers x1 , . . . , xn ,P [X1 x1 , . . . , Xn xn ] P [X1 x1 ] · · · P [Xn xn ] F (x1 ) · · · F (xn ),where F (·) is the cumulative distribution function (see Section A.1) of each ofthe identically distributed random variables X1 , X2 , . . . . In this model there is nodependence between observations. In particular, for all h 1 and all x, x1 , . . . , xn ,P [Xn h x X1 x1 , . . . , Xn xn ] P [Xn h x ],showing that knowledge of X1 , . . . , Xn is of no value for predicting the behaviorof Xn h . Given the values of X1 , . . . , Xn , the function f that minimizes the meansquared error E (Xn h f (X1 , . . . , Xn ))2 is in fact identically zero (see Problem1.2). Although this means that iid noise is a rather uninteresting process for forecasters, it plays an important role as a building block for more complicated time seriesmodels.Example 1.3.2A binary processAs an example of iid noise, consider the sequence of iid random variables {Xt , t 1, 2, . . . , } withP [Xt 1] p,P [Xt 1] 1 p,where p 21 . The time series obtained by tossing a penny repeatedly and scoring 1 for each head and 1 for each tail is usually modeled as a realization of thisprocess. A priori we might well consider the same process as a model for the all-starbaseball games in Example 1.1.2. However, even a cursory inspection of the resultsfrom 1963–1982, which show the National League winning 19 of 20 games, castsserious doubt on the hypothesis P [Xt 1] 21 .
The Bartlett Press, Inc.1.3Example 1.3.3brockwel8 · i · 20021:59 p.m.Page 9Some Simple Time Series Models9Random walkThe random walk {St , t 0, 1, 2, . . .} (starting at zero) is obtained by cumulativelysumming (or “integrating”) iid random variables. Thus a random walk with zero meanis obtained by defining S0 0 andSt X1 X 2 · · · X t ,for t 1, 2, . . . ,where {Xt } is iid noise. If {Xt } is the binary process of Example 1.3.2, then {St , t 0, 1, 2, . . . , } is called a simple symmetric random walk. This walk can be viewedas the location of a pedestrian who starts at position zero at time zero and at eachinteger time tosses a fair coin, stepping one unit to the right each time a head appearsand one unit to the left for each tail. A realization of length 200 of a simple symmetricrandom walk is shown in Figure 1.7. Notice that the outcomes of the coin tosses canbe recovered from {St , t 0, 1, . . .} by differencing. Thus the result of the t th tosscan be found from St St 1 Xt .1.3.2Models with Trend and SeasonalityIn several of the time series examples of Section 1.1 there is a clear trend in the data.An increasing trend is apparent in both the Australian red wine sales (Figure 1.1)and the population of the U.S.A. (Figure 1.5). In both cases a zero-mean model forthe data is clearly inappropriate. The graph of the population data, which contains noapparent periodic component, suggests trying a model of the form-2Figure 1-7One realization of asimple random walk{St , t 0, 1, 2, . . . , 200}024681012Xt mt Y t ,050100150200
This page is one line long.The Bartlett Press, Inc.10Chapter 1brockwel8 · i · 20021:59 p.m.Page 10Introductionwhere mt is a slowly changing function known as the trend component and Yt haszero mean. A useful technique for estimating mt is the method of least squares (someother methods are considered in Section 1.5).In the least squares procedure we attempt to fit a parametric family of functions,e.g.,mt a0 a 1 t a 2 t 2 ,(1.3.1){x1 , . . . , xn } by choosing the parameters, in this illustration a0 , a1 , and a2 , toto the data minimize nt 1 (xt mt )2 . This method of curve fitting is called least squares regression and can be carried out using the program ITSM and selecting the Regressionoption.Example 1.3.4Population of the U.S.A., 1790–1990To fit a function of the form (1.3.1) to the population data shown in Figure 1.5 werelabel the time axis so that t 1 corresponds to 1790 and t
1.1. Examples of Time Series 1 1.2. Objectives of Time Series Analysis 6 1.3. Some Simple Time Series Models 7 1.3.1. Some Zero-Mean Models 8 1.3.2. Models with Trend and Seasonality 9 1.3.3. A General Approach to Time Series Modeling 14 1.4. Stationary Models and the Autocorrelation Functio