Transcription
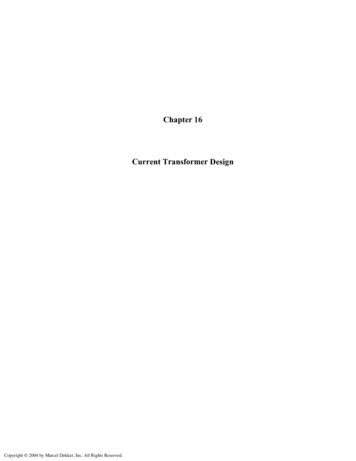
Current Transformer Errors and Transformer Inrush as Measured byMagnetic, Optical and Other Unconventional CTsbyJohn Horak, Basler Electric CompanyJames Hrabliuk, NxtPhaseClassical magnetic current transformers are prone to error during a variety of conditions.The first part of this paper will identify some of those conditions and will provide a meansof analyzing the resulting CT performance level. One situation of particular interest istransformer inrush current. Transformer inrush may be among the worst types of currentfor a magnetic CT to reproduce, because it has a combination of effects that put CT performance most at risk. Inrush may be high in magnitude, may contain a heavy DC offset witha long time constant, and it may have a unipolar half-wave nature. The paper will reviewthe errors in secondary current that will be seen for these various primary current conditions, will provide means of determining when CTs are at risk of saturation and will show,using numerical analysis results, what the output of a saturated CT is like.A viable alternative to magnetic CTs is the use of optical CTs that eliminate the errors commonly associated with magnetic CTs. These errors can be highly objectionable in someapplications. The second part of this paper will review the various types of current sensorsavailable on the market, including conventional, hybrid, and optical sensors. Focusing on"pure" optical sensors, the techniques used to sense current optically will also be examined, as manufacturers can use fundamentally different methods. Optical CT signals areinterfaced with commercially available relays using low level analog signals and, in thenear future, digital signals. These signal levels, as outlined in IEEE and IEC standards, willbe examined. Finally, the future of optical sensors with respect to relaying will be examined.Magnetic CT Performance Analysis TechniquesSteady State Circuit AnalysisThe first approach to determine if a CT is under risk of CT saturation is to calculate whetherthe AC voltage that will be impressed on its secondary during a fault will exceed the voltage that the CT can support. This is typically done using RMS values of AC current with noDC offset.Equivalent Electric CircuitMost engineers have worked with CT equivalent circuits, with various modifications. Thederivation and analysis is available in many references [e.g.,1]. One fairly complete versionis shown in Figure 1.1
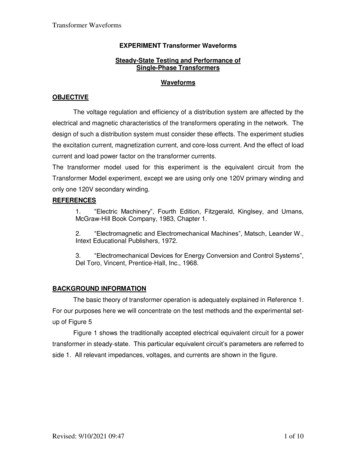
Figure 1: Simplified CT Equivalent CircuitNote that Xm in the figure is labeled as negligible or 100-10,000 ohms (higher impedancefor higher ratio CTs). The impedance of the excitation branch varies tremendously fromone CT design to the next, the tap ratio used, and the Vexc seen by the CT. However, it isthe negligible impedance during CT saturation that will most affect relay settings. This lowimpedance occurs when all the steel is magnetized at the steel’s maximum, yet the primary current flow is oriented toward deeper magnetization. It is not until the primary current wave form decreases and eventually reverses direction that the flux level begins toreduce and saturation is removed.CT, Line, and Relay ImpedancesIn Figure 1 the CT primary impedances and secondary reactance are shown but are commonly negligible. This reasonably accurate representation is used herein. However, onlywhen a CT has “fully distributed” windings can the CT secondary reactance be consideredas negligible without research. Not all CTs have fully distributed windings, but relayingclass bushing CTs typically have fully distributed windings when the full ratio is used. Thepartial tap windings may or may not be fully distributed in old CTs.Secondary line impedances are typically highly resistive compared to their reactance forthe wire size used in CT circuits. In modern low impedance solid state relays, the burdenof the relay on the CT circuit is typically negligible.CT Secondary Voltage RatingThe impedance of the magnetizing branch is non-linear. Its approximate fundamentalimpedance varies with applied voltage to the CT secondary, but will typically be in theseveral hundred to several thousand ohms range until the saturation voltage level isreached. Note in the CT excitation curve in Figure 2 that at the indicated ANSI knee pointthe magnetizing impedance is 5000Ω ( 200V/0.04A). The ANSI knee point correspondsapproximately to the highest magnetizing impedance of the CT. Above the knee point,small Vexc increases cause large Iexc increases, which corresponds to a low Xm .2
Figure 2: Typical CT Excitation Voltage Versus Excitation Current CurveThe steady state symmetrical AC voltage that the CT is rated to drive varies according toone’s approach. Four common approaches are: The IEEE C57.13 “knee point” for ungapped core CTs, constructed using theintersection of the excitation curve and a 45o line as shown in Figure 2.(Gapped core CTs use 30o but are not common in relay circuits.) The “saturation voltage” using the intersection of straight lines drawn from thetwo sections of the curve as shown in Figure 2. The IEC knee point defined as the voltage where a 10% increase in Vexc willcause a 50% increase in Iexc. The “C” rating of the CT (IEEE C57.13). The C rating calls for less than 10%relay current error at 20 times rated current (5*20, or 100A) into 1, 2, 4, or 8Ω0.5pf burdens. A simplified method, that ignores phasor math, for determiningthe C rating for a 5A CT from the curves:1) Find Vexc where Iexc 10. Note Vexc is an internal voltage, not the CTterminal voltage.2) Now calculate the CT terminal voltage with this Vexc and 100A secondary(100A is measured secondary, but we can see we lost 10A to the excitationbranch, so we have an error of 10/(100 10) 0.091, or less than 10%error).Vct,terminal Vexc -100(Rct).3) Round Vct,terminal down to the nearest 100, 200, 400, or 800V, correspondingto C100, C200, C400, and C800 (C10, C20, and C50 CTs are also sold, but3
their design pf burden may be 0.9).As an example, from the above curves, with a 0.9Ω secondary:Vct,terminal 400 - 100(0.9) 310V, which yields C200 rating.The sample CT in Figure 2 has an ANSI knee point of about 200V, a saturation voltage ofabout 275V, and is class C200.Steady State AC SaturationThe next step is to apply anticipated faults to the system and determine if the voltage thatwill be impressed upon the CT will be greater than the CT rating:VCT , Rated K I sec,rms Z secEq. 1whereVCT , Rated Knee Point, Saturation Voltage, or C Rating, depending on the user' s decisionK User' s Safety Margin FactorThe equation must be evaluated for all likely CT secondary current distributions for phaseand ground faults, verifying that the CT will not see excessive secondary voltage during thefault. Some common situations where problems arise: Impedance is too high due to long lead lengths.Poor quality (i.e., low burden rating) CTs are used due to cost constraints orspace limitations.Small loads are placed on powerful buses, and CT ratios are selected basedon load current rather than fault duty.Low ratio zero sequence CTs are placed on systems having high ground faultduty.Unusual burdens, such as differential relay stabilizing resistors, are placed inthe CT circuit.Transient Analysis of Inrush and Fault CurrentThe effect of DC offset, unipolar half wave current, and residual flux in the CT can almostalways cause at least a small amount of transient CT saturation in a CT that is otherwisetotally acceptable for steady state AC fault current. All these components will be found intransformer inrush current.Simple Approach – Integration of Ideal CT Secondary VoltageThe analysis of CT flux levels under the presence of a mix of symmetrical AC and othernon-symmetrical current wave forms, especially if any modeling of CT saturation is to beincluded, is a rather involved process. A simplified test of whether a CT is at risk of enteringsaturation under the presence of DC offset or unipolar current waves is to integrate secondary voltage as if the CT were ideal.4
To provide voltage in a circuit requires a changing flux level in a coil:V dλdtEq. 2By integrating the voltage at the terminals over time we can determine the core flux level:tλ(t ) V dt λoEq. 30whereλo residual flux level at time 0This equation provides a measure of the rating of a CT. At rated secondary voltage and nostanding offset from 0, the flux that the CT can produce is simply the integration ofλ λ peak 2 Vrms ,rated sin(ωt ) dtEq. 42Vrms ,ratedωIf the integration of secondary voltage rises above this level, then the CT begins to saturate.Simplified Analysis of DC Offset EffectsFaults develop an AC current with an exponentially decaying DC offset that is expressedby the following equation developed in many engineering texts (e.g. [2] chapter 3): 2 Vrms, priI pri (t ) R jXpri pri tR p / L p sin (ω t α ) sin (α ) e ()Eq. 5whereR p / L p R pri /( X pri / ω )ω 2π fα a function of system X/R and where in the cycle the faultis initiated. Randomly takes any angle.By assuming that the CT secondary burden is a pure resistance, assuming an infinitelypermeable core, and assuming the worst case DC offset by setting α - π/2 ( π/2would be just as bad), the voltage impressed on the CT secondary will have the form of: R π tR / L Vsec (t ) 2 I rms , pri CT burden sin(ω t ) e p p 2 CT Ratio 5Eq. 6
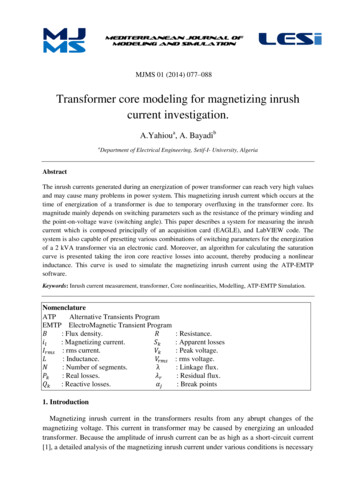
Inserting Eq. 6 into Eq. 2 yields: R 1π L tR / Lλ (t ) 2 I rms , pri CT burden cos(ωt ) p 1 e p p2 Rp CT Ratio ω() λ oEq. 7Examination of Eq. 7 shows that, the higher either fault current or burden, the higher thevoltage and the higher the flux level. Figure 3 is a graph of the results of the above analysis, showing the flux buildup that will occur in a CT during an event, assuming a pureresistive secondary circuit and an infinitely permeable core.Figure 3: CT Flux Levels with DC Current Effects, Infinitely Permeable CoreFigure 3 does not show any residual flux at the start of the process. All practical magneticcores hold some level of flux after current is removed, and during normal operation a CTmay reproduce an AC waveform with core flux levels that are constantly offset from a zeroflux level. The offset tends to be worst immediately after a major reduction in current levelsand tends to decrease with time. High speed reclosing sees larger flux offsets as a result,which tends to cause worse transient CT saturation. In a sample test reported in [1], theresidual flux level found in a variety of CTs varied over the range of 0-80% of design fluxlevel. About half of the CTs had residual flux levels above 40% of rated. Residual flux maybe oriented in either direction. Hence, the flux indicated in Figure 3 may be shifted up ordown depending on the level of residual flux.Core flux levels, of course, do not reach the levels shown in Figure 3. The core reaches alevel of flux density and flux levels do not appreciably increase after that point. Thereafter,the CT output drops toward zero in an exponentially decaying fashion until primary currentflows in the negative direction to desaturate the CT. As the DC offset decays, the CT outputgradually improves until the secondary current represents the input waveform.6
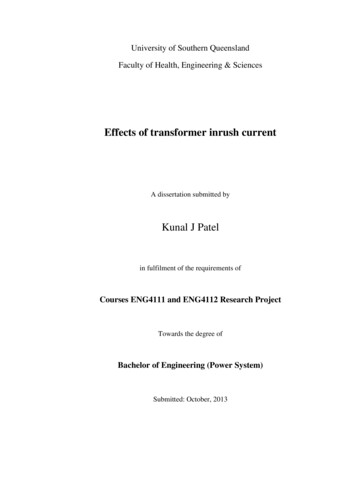
Figure 4: Simplified Saturation Effects AnalysisIt would be possible to provide “time to saturate” and “time to desaturate” equations, butthis is not done herein, because exact times are not the point of this exercise and likely afairly inexact analysis due to unknown circuit impedances, CT magnetic approximations,and pre-event flux levels. (Equations may be found in [1] and [3].) The point here is:1)2)lookSaturation may occur very quickly, as fast as the first half wave of the primarycurrent wave, andGiven a saturated CT, as the primary current DC offsetdecays, the outputwaveform returns to a normal AC waveform. Note that, as shown in Figure 4,after 0.1 seconds (about two system time constants; T.C. L/R XL/(ωR), orabout 0.053 seconds for X/R 10), the output wave form has begun tocloser to the normal AC wave form.Peak Flux Assuming No SaturationBy substituting into Equation 8 for some time well into the future when the exponential DCoffset term has essentially been completely integrated, and choosing a point in time wherethe cosine term comes to 1, we can state the peak flux if there is no CT saturation: 1 L λmax k p λo ω R p Eq. 8Comparing the max flux level with and without the L/R term, noting x 2π fL ωL, anddropping the initial flux term λo , we can see a ratio of maximum flux with and without theDC offset:Xλmax , dc ac 1 L, pRpλmax , ac7Eq. 9
Whereλmax , dc ac the peak flux level that would arise from a secondary voltage withboth an ac and dc component, and no residual flux effectsλmax , ac the peak flux level that would arise from a secondary voltage withonly an ac component, and no residual flux effectsRecall that this XL/R value refers to the fault impedance of the primary circuit, typically onthe order of 3-15. This means that to avoid saturation due to DC offset, the CT must have avoltage rating that is 4-16 times the voltage rating required for the steady state AC analysis,ignoring the effects of residual flex levels.DC Offset Analysis ConclusionsFrom the discussion above, we can conclude that, to avoid all hints of saturation from theeffects of DC offset (but ignoring residual flux effects), we need to revise equation 1 to say: X VCT , Rated K 1 L , p I sec , rms Z sec R p Eq. 10where K is some margin/safety factor to account for uncertainties, such as the effects ofresidual flux and circuit modeling error.Simplified Analysis of Unipolar Half Wave CurrentsTransformer inrush currents are frequently characterized by a half wave current that hasthe appearance of the output of a half wave voltage rectifier. From the above analysis of DCoffset effects on flux build-up, it becomes clear that any time the integration of secondaryvoltage exceeds the design rated volt-second rating of the CT, the CT is at risk of enteringsaturation. The negative half of a current wave is needed to balance the positive voltagewaves and, if the waves are not balanced, the integration of secondary voltage will buildand the CT will enter saturation. The number of unipolar pulses that the CT can reproducebefore entering risk of saturation is a straightforward matter. Simply add the area under thevoltage profile curves of an ideal CT until the integration reaches the voltage rating definedby eq. 4. Depending on secondary voltages and the CT rating, the CT is at risk of goinginto saturation even during the second pulse of the half wave rectified current.8
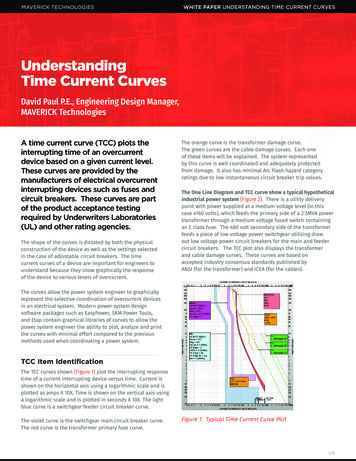
Figure 5: Point where CT saturation is reachedDetailed Numerical Analysis of Saturated ConditionsThe classical model is mainly for the purpose of modeling steady state AC performanceduring normal unsaturated conditions and minor excursions into the saturated domain. It isnot well suited for modeling conditions that tend toward moderate to heavy CT saturation.Also, the above analysis of the integration of CT secondary voltage gives an indication ofwhen a CT is at risk of entering saturation, but it does not lend itself to a good descriptionof what the CT output will actually look like when saturation does occur. Once a CT issuspected to be operating at moderate or heavy saturation levels, or when the effects ofminor contributors to inaccuracy, such as hysteresis, are of interest, a numerical analysisof the CT currents, voltages, and magnetic circuits is required. See the appendix for onemethod of numerical analysis of CTs.CT Driven into Saturation by Excessive Burden or Primary CurrentIf a CT is driven by too much primary current or excessive secondary burden, the CT willbegin to have an output similar to Figure 6. This figure represents the possible case wherea 5MVA, 13.8kV transformer was installed on a 10,000A bus. A 600:5 CT was used, tappedcloser to the system load of 200A, so the C200 CT became a C65. This might be fine fortypical load currents, but when a major fault occurs (that would have in theory driven 250Ainto the relay), the CT fails, and it is hard to predict how a relay will respond to such adistorted wave. Even if the CT had not failed, it is not immediately clear how the digitalrelay will respond to currents of such magnitude. The analog to digital circuits and frontend op amps likely saturate, and a distorted current wave is seen by the relay.9
Figure 6: 600:5 tapped at 200:5; C200 effectively a C65; 1.2 j.2 Ω burden totalCT Driven into Saturation by Heavy DC Offset in Inrush or FaultNow take the previous example, and assume that the CT was tapped at 600:5, so the CTcould reproduce the primary current relatively well, but a large DC offset was present in thewave and the steel of the CT had some level of offset. This will cause a transient saturation.The distorted waveform occurs. Again, it becomes hard to predict what will occur in therelay. Overcurrent relay response will slow, but differential relays may tend towardmisoperation.Figure 7: Same CT, tapped at 600:5, but with heavy DC offsetCT Driven Into Saturation by Unipolar Transformer InrushInrush current driven that is half-wave-like in nature will eventually drive a CT into saturation. As noted in the earlier graphs, it will cause a cumulative buildup of flux and, if extended long enough, will cause a CT to fail to reproduce current and, hence, cause another unexplained operation of the transformer differential relay.10
Current Sensing Using Optical CTsWithin the past ten years optical sensors have seen greater acceptance, to the point thatdesigners have a viable alternative to conventional instrument transformers. This shifttoward optical technology is being driven by improved safety, accuracy, broader dynamicrange, wider bandwidth, reduced size, and the use of environmentally friendly materials.For protection applications specifically, optical current sensors can represent the trueprimary current flowing on the line, eliminating the problems of CT saturation. This signalrepresentation can also represent "pure DC" or "DC components" flowing on the line.Optical sensor manufacturers use fundamentally different techniques to measure currentand, in many cases, the physical constructions are very different. Even the term “opticalsensor” can be confusing, as sensors using non-optical methods of measuring current(but using an optical method of transmitting the signal) fall under the new IEEE and IECstandards. In contrast, various manufacturers' conventional instrument transformers aregenerally built using the same fundamental technology: iron core with a copper windingtransformer. It can be confusing for users trying to evaluate the benefits of optical sensors;one must understand not only the differences from conventional devices, but also thevarious approaches to optical sensing.The current sensor “family tree” shown in Figure 8 clarifies the various types of currentsensors available. These sensors can be divided into two broad classes, conventionalsensing and optical sensing. “Optical” can have several different meanings; this family treerefers to optical sensing as “pure” optical sensors that use optical materials and fundamentally different techniques to measure current.Some current sensing methods use conventional iron core or novel current sensing techniques, and then convert the conventional analog signal into an optical signal that is thentransmitted to remote electronics. These types of sensors are referred to as “hybrid” optical sensors.Focusing on “pure” optical sensors (measure and transmit the signal optically) there areseveral distinct methods of measuring the current. These techniques vary in both thephysical construction of the sensor and the overall measurement technique, which may bepatented by the specific manufacturer. Understanding those differences is critical to opticalsensor selection.11
Figure 8: An overview of major categories of current sensing approaches on the marketTypes of Optical Current SensorsWithin the “pure” optical sensor category, sensors can be broadly categorized as using“bulk optics” or “pure fiber optics”. “Pure” fiber sensors use fiber wrapped around a current-carrying conductor and are able to use any number of fiber turns surrounding theconductor. Depending on the measurement technique and, hence, the physical propertiesof the components, the sensor can be manufactured in a wide variety of physical shapesand sizes. This flexibility can allow CTs of very large physical size to be manufactured (forexample, for bushing CTs). Bulk sensors, on the other hand, use a block of glass machined to direct light around the conductor, limiting its ability to adapt to various shapesand sizes.Polarimetric vs. Interferometric SensingLooking even closer at fiber optic devices, they may be further classified as “polarimetric”and “interferometric” sensors. Polarimetric and interferometric sensing are fundamentallydifferent in their sensitivity to stray effects such as temperature and vibration.Polarimetric current sensors derive measurements from a shift in the “polarization of light”caused by the magnetic field surrounding a current-carrying conductor. Linearly polarizedlight enters the sensor, where its polarization is shifted by an amount proportional to themagnetic field (and proportional to the amount of current flowing through the line). Strayeffects shift the polarization of the light and make it difficult to determine the actual currentin the conductor. Mitigation of these stray effects becomes critical to the success of thesensor’s accuracy and stability. Elimination of these effects is accomplished through delicate packaging of the optics and compensation techniques. These mitigation proceduresare limited in their effectiveness and, in turn, limit the performance of the polarimetricsensor.12
An interferometric sensor derives the measurement of current from the “interference ofwaves” caused by a phase shift between two lightwaves. This interference is the result oftwo circularly polarized light signals whose speeds of propagation are altered “differentially” in proportion to the magnetic field induced by the current in the conductor. Externaltemperature and vibration, which are “common mode” effects, equally affect the lightsignals; therefore, the sensor is relatively immune to these stray effects.Figure 9: Polarimetric CTs measure the magnitude of a shift in the polarization of lightcaused by the current in a conductor.Figure 10: Interferometric CTs measure the difference between polarization shift of twosignals caused by the current in a conductor.An Interferometric DesignOne specific current sensor utilizes the Faraday1 effect in a unique manner; the magneticfield produced by the current flowing through a conductor changes the velocity of thecircularly polarized light waves in the sensing fiber. By measuring the change in lightvelocity (using an interferometric scheme) and processing the information, an extremelyaccurate measurement of current is produced.1The Faraday, or magneto-optic effect, consists of the rotation of the polarization plane of an optical wave,traveling in a magneto-optic material, under the influence of a magnetic field parallel to the direction of propagation of the optical wave.13
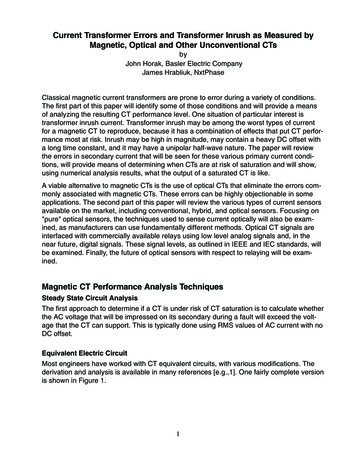
This approach to current sensing has been adapted from a completely different industry.Used for years in navigation systems, the design is based on the Honeywell fiber-opticgyroscope system. In the 1990s, a team of spin-off researchers at Honeywell investigatedthe measurement of electrical current using fiber-optic gyroscope technology developedearlier for civil and military navigation applications. This early development led to the use ofthis technology for application in current sensing and in measurement devices for powersystem monitoring. The method is detailed below.Figure 11: Fiber optic current sensing technology. Circularly polarized light travels in bothdirections around the fiber loop with speed of propagation differentially influenced by theFaraday effect. The signal is normalized and bifurcated with a modulator and closed loopelectronics to yield a highly accurate current measurement impervious to temperature andvibration effects.1. A light source sends light through a waveguide to a linear polarizer, then to apolarization splitter (creating two linearly polarized light waves), and finally to anoptical phase modulator.2. This light is then sent from the control room to the sensor head by an optical fiber.3. The light passes through a quarter waveplate, creating right and left hand circularlypolarized light from the two linearly polarized light waves.4. The two light waves traverse the fiber sensing loop around the conductor, reflectoff a mirror at the end of the fiber loop, and return along the same path.5. While encircling the conductor, the magnetic field induced by the current flowing inthe conductor creates a differential optical phase shift between the two light wavesdue to the Faraday effect.6. The two optical waves travel back through the optical circuit and are finally routed tothe optical detector where the electronics de-modulate the lightwaves to determinethe phase shift.7. The phase shift between the two light waves is proportional to current, and ananalog or digital signal representing the current is provided by the electronics to theend user.14
Optical CT InstallationFigure 12: Installation of optical voltage and current sensors at a gas-turbinegenerating station.Interfacing Optical CTs with RelaysThose who specify conventional current transformers use IEC and IEEE standards to assistin the writing of a specification. With the addition of optical current (and voltage) sensors,new standards were required to address these new devices. The IEC has been a leaderwith respect to development of these standards, with the IEEE following closely behind.The new optical standards are very similar with respect to "high voltage" and accuracy;although, in some instances, the sensors are tested to more stringent standards. Thesemore stringent tests include accuracy over temperature and additional EMC tests for theelectronics. Additionally, the optical sensors (and their associated electronics) must comply with existing standards previously associated with electronic relays or meters.When specifying optical sensors, the new standards should be used to specify the performance of the sensor, since various new signal outputs are available. High voltage and highcurrent requirements are the same for optical sensors as for conventional equipment.These tests have evolved over many years, and the standards are not intended to modifythem; they are tested and proven. The standards for conventional and optical sensors aresummarized below into two groups: conventional standards that have been in print formany years, and optical standards that are relatively new and unfamiliar to most people.Signals representing current from optical sensors are typically available in three formats:digital, low energy analog (LEA), and high energy analog (HEA) for metering applicationsonly. The fundamental signal is the digital signal. It is this digital signal that has the greatest value, as it does not require the additional complexity of digital to analog conversionnor does it require amplification of a low energy analog signal. However, given that digitalsignal inputs to meters and relays are in early stages of development, high and low levelanalog signals are available in the interim until digital inputs to secondary devices aremore commonly available.15
Digital SignalSignal processing inside the current and voltage electronics is inherently digital in natureand is accessible in a format consistent with IEC standard 60044-7 and draft standard60044-8. These standards define the digital data format from the sensor electronics (contains the relevant signal information associated with several current and voltage sensors).In addition, IEC 61850-9-1 and 61850-9-2 also recognize the data structure outlined in the60044-7 and 60044-8 standards, but also permit an Ethernet physical layer with the sameoverall data structure.Low Energy Analog (LEA) SignalA low energy analog (LEA) signal from each sensor is available in several formats, eachtailored to its specific sensor and end use. The table below summarizes output signals andapplicable standards (in some cases, draft standards):Low Energy Signal Levels AvailableCurrent SensorMetering Output 4VRMS (meets IEC 60044-8)Voltage Sensor4VRMS (meets IEC 60044-7)2VRMS (ANSI/IEEE PC37.92)Protection Output 200 mVRMS (meets IEC 60044-8and ANSI/IEEE PC37.92)4VRMS (meets IEC 60044-7and ANSI/IEEE PC37.92)These signal amplitudes were chosen based on widely acceptable output levels fromdigital to analog converters with a maximum output voltage of approximately 11.3 Vpeak.IEC and IEEE standards allow for an over range factor of two for metering on the voltageand current outputs and 40 for the protection current output. (This permits measurement ofa fully offset waveform with a magnitude of 20 times rated current as outlined in the standards, while maintaining the maximum peak signal level below 11.3V.)High Energy Analog (HEA) SignalThe high energy analog signal is available in a format that typically would be used formetering applications. Amplifying a current signal to be used for protection applications ispossible but is impractical, because the required over range for fault currents would require a very large and expensive amplifier. Low energy signals are more suitable for relaying applications. For similar reasons a 1A signal (but not a 5A signal) is available for metering applications. The table below summarizes the available high energy analog signals:High Energy Signal L
transformer inrush current. Simple Approach – Integration of Ideal CT Secondary Voltage The analysis of CT flux levels under the presence of a mix of symmetrical AC and other non-symmetrical current wave forms, especially if any modeling of CT sa