Transcription
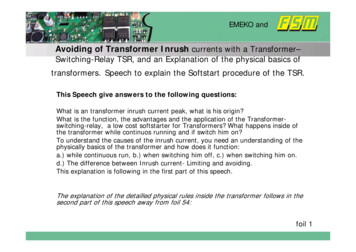
Transformer WaveformsEXPERIMENT Transformer WaveformsSteady-State Testing and Performance ofSingle-Phase TransformersWaveformsOBJECTIVEThe voltage regulation and efficiency of a distribution system are affected by theelectrical and magnetic characteristics of the transformers operating in the network. Thedesign of such a distribution system must consider these effects. The experiment studiesthe excitation current, magnetization current, and core-loss current. And the effect of loadcurrent and load power factor on the transformer currents.The transformer model used for this experiment is the equivalent circuit from theTransformer Model experiment, except we are using only one 120V primary winding andonly one 120V secondary winding.REFERENCES1.“Electric Machinery”, Fourth Edition, Fitzgerald, Kinglsey, and Umans,McGraw-Hill Book Company, 1983, Chapter 1.2.“Electromagnetic and Electromechanical Machines”, Matsch, Leander W.,Intext Educational Publishers, 1972.3.“Electromechanical Devices for Energy Conversion and Control Systems”,Del Toro, Vincent, Prentice-Hall, Inc., 1968.BACKGROUND INFORMATIONThe basic theory of transformer operation is adequately explained in Reference 1.For our purposes here we will concentrate on the test methods and the experimental setup of Figure 5Figure 1 shows the traditionally accepted electrical equivalent circuit for a powertransformer in steady-state. This particular equivalent circuit’s parameters are referred toside 1. All relevant impedances, voltages, and currents are shown in the figure.Revised: 9/10/2021 09:471 of 10
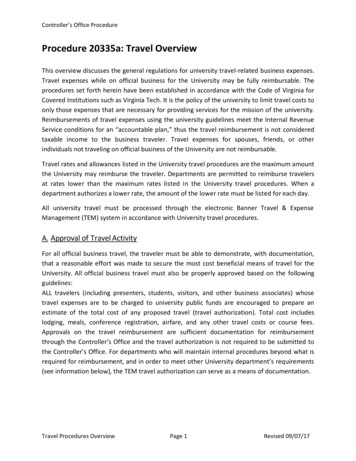
Transformer WaveformsFigure 1: Steady-state equivalent circuit for power transformer.It is important to note that for a typical power transformer the ratio of the parallelcombination of the common leg impedances to the total impedance of either winding willexceed 200. Algebraically, this can be described asR // XR jXc1m 200 1(2.1)Figure 2: Winding configuration of laboratory transformers.Revised: 9/10/2021 09:472 of 10
Transformer WaveformsWe will now focus our attention on designing a system for observing thewaveshapes and interactions of the various currents and fluxes in the transformer. Figure2 shows the configuration of the transformers used in the laboratory. Using Figure 1 asan equivalent circuit for the transformer shown in Figure 2, we can designate side 1(primary) as any of the windings labeled with “H” terminals and side 2 (secondary) as anyof the windings labeled with “X” or “Y” terminals. An important point is that the inducedvoltages E1 and E2’ are exactly in phase. Figure 3 shows the phasor diagram of thevoltages and currents of the transformer. Note that current IC is in phase with E1 and thatcurrent Im is phase-shifted by 90 . From transformer theory, we recall that current ICrepresents power losses in the transformer core, and that current Imrepresents thecurrent required to produce the magnetic flux.Figure 3: Phasor diagram of voltages and currents of transformer.The input current I2’ can be directly displayed on an oscilloscope by measuring thevoltage across a 1 resistor placed in series with the current. Note that the measurementis a voltage signal that is dependent upon the current. Referring to Figure 5, resistor R1is used to measure the current I1. Similarly, resistor R3 in Figure 5 is used to measurecurrent I2’. It is not so easy to measure the currents IC and Im , but we can derive a voltagesignal that is in phase with IC. The no-load voltage across terminals Y1 and Y2 isRevised: 9/10/2021 09:473 of 10
Transformer WaveformsVY 1 Y 2 NYd dt(2.9)which corresponds to E2’ from Figures 1 and 4. Thus, we have a voltage signal that is inphase with IC. The resistor R2 in Figure 7 provides an adjustable signal that is in phasewith IC, yet the resistor is large enough to prevent excessive loading of the circuit. Therequirement for an adjustable signal becomes clear as the experiment is performed.We now have access to signals representing three currents. It is seen from Figure 1 thatI1 IC Im I2’(2.10)and, clearlyIm I1 - IC - I2’(2.11)Thus, we have signals for the three terms on the right side of Eq. 2.11, which means weshould be able to measure the unknown by some differential means. Figure 4 shows avoltage source equivalent for the system of Figure 5 and clearly indicates a synthesis ofEq. 2.11.Therefore, the voltage signal that remains after the sources interact isrepresentative of Im.Figure 4: Voltage source equivalent of Eq. 2.11.Revised: 9/10/2021 09:474 of 10
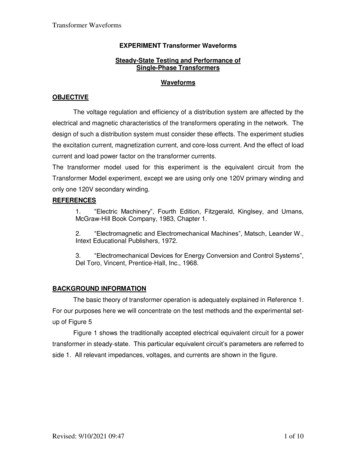
Transformer WaveformsNOTE: The voltage signals used above are adequate for waveshape analysis andphase relationships. They are not accurate for magnitude comparisons and should not beused for this purpose.SUGGESTED PROCEDUREThe transformers used for this experiment are rated 120V-120V, 0.6kVA. Thereare three of them on each set of wall shelves we need 2 transformers. One is used forisolation; the other is the transformer under test. The set of windings connected to thesource side of the transformer are the primary windings, and those connected to the loadare the secondary windings. To achieve a 600 volt-ampere rating, these two sets of 120Vmain primary and secondary windings must be in parallel. We will use only one set of120V primary windings so it will a 300 volt-ampere rating. The other two “Y” windings areinformation (instrumentation) windings and are not designed to support a load.Figure 1 defines the currents that are referred to throughout the experiment.1.i i ,iFigure 5 shows the connections that are used to view 1 ,cm, and m. The firsttransformer is identical to the transformer being tested and is used to help prevent groundloops between the source and the instrumentation.Channel 1 displays current, Channel 2 displays Flux or Voltage (Part 3). Set the flukecurrent meters manual range to amps not mA with the up and down arrow key.The oscilloscope is connected so that many different signals can be displayed. Theundesired signals are eliminated by pressing the ground button next to their scopeconnection. Referring to Figure 5, pressing the ground button on the upper (positive) inputof (channel 1) causes thediff amp causes theimi1signal is displayed. Releasing both ground buttons of thesignal to be displayed on scope (channel 1). Obviously, pressingthe bottom (Negative) ground button causes the sum of the -i2and -icsignals to bedisplayed.For initial tests, the load is left disconnected and R3 is set to zero. Slowly increase thevoltage from the Single-Phase AC Source until 120 V AC is registered on the voltmeterRevised: 9/10/2021 09:475 of 10
Transformer Waveforms(V1). The signals across R1 (1Ω) and R2 are proportional toFigure 1, it is seen thatim i1 ic i2 . Adjust R2display. Perhaps the easiest way to minimizeici and ito eliminate the i1is to display mcc, respectively. Fromcomponent from the(channel 2) versusimon (channel 1) the scope and adjust R2 until the hysteresis goes away.When R2 is properly adjusted,channel 2 are used,icimis observed when both differential amplifier inputs forwhen only the upper input is used, and the totali1when only thelower input is used.Grounding push buttons of Diff AmpSignal displayedBoth inputs ungroundedImPositive (upper) input groundedI1Negative (lower) input grounded-Ic - I2Differential amplifier Channel 1 of the scopeAt the transformer’s rated voltage, record scope waveformstime ( 4 waveforms), the hysteresis loop(curve ( mversuscancellation oficim mversus)( XY plot) . Note thatimNOTE: The signal being observed ashas the same waveform as2.cm, and mversusi , ) (1 XY plot) and the AC saturation1is very symmetrical when correcti i ,i , 1is obtained. Now, vary the primary voltage from zero to 120 V anddescribe in the report the changes in each 1 ,the waveform ofi, i ,imici. Also, theccmmand saturation., is voltage from the 6V winding, but this signal msignal is an integrated voltage signal having.Add a secondary resistive load by connecting the circuit of Figure 6 to thetransformer load connection of Figure 5 and set input voltage to 120 V AC and maintain itconstant. Adjust R3 to remove the load current from the oscilloscope display. R2 mayRevised: 9/10/2021 09:476 of 10
Transformer Waveformsalso need to be readjusted slightly. Observe the AC saturation curve (versusim mchannel 2channel 1) as the load current is varied between 0, 1.0, 1.5, 2.0 and 2.5 AMPS.Describe in the report the change in the peak-to-peak magnitude of flux as the loadresistance is changed.For different primary voltages 120VRMS, 90VRMS, and 60VRMS, record the changes in thewaveforms and curves ofi,i ,i1cm, mand saturation as the load is varied. From thisinformation, comment on the transformer’s performance at different voltages.3.Bypass the integrator by reconnecting the oscilloscope leads directly to terminalsY3 and Y4. Turn the calibration knob of the corresponding differential amplifier counterclockwise until the differential amplifier is not saturated. This will prevent the amplifierfrom running over the maximum allowed range. Observe the relative magnitudes andphase angles of the terminal voltage (channel 2) andi1(channel 1) as the loadresistance is varied. Magnitudes can be obtained directly from the meters on the panel.Maintain the source voltage at 120VL-N . To obtain phase angle between signalsdisplayed, use the cursors of the scope with to find the delay time, measure betweenthe peaks and calculate the phase angle. Determine the period of the voltage waveformbecause this signal is harmonic free. Phase VT to I1 (Time delay / period) * 360⁰Without added CapacitorLoadVoltage V1Current I1Phase VT to I1PFCos(Ө)current ect the large capacitor found on the shelf in parallel with the load resistor. Againobserve the relative magnitudes and phase angles at the transformer input. The labpresently does not contain the proper inductor to try an RL load type.Revised: 9/10/2021 09:477 of 10
Transformer WaveformsWith added CapacitorLoadVoltage V1Current I1Phase V1 to I1PFCos(Ө)current RT: things to keep in mind as you do the experiment.1. The report must a individual student’s work (not a group’s). The report must be handwritten.2. Describe the waveforms observed during Part 2 of the experiment. Pay particularattention to frequency, phase, and any distortion. Explain the causes of any frequencydifferences, phase changes, and distortion. Changes as the primary voltage is varied.3. Note and explain any waveforms variations caused by different loads part 2. Explainthe behavior of the core flux for various loads. Changes as the primary voltage isvaried.In order to reduce the core-loss current, what would you change in the design of thetransformer? Do not change voltage or power rating of the device.4. Explain the relationship of input voltage, current and primary side power factor as theload power factor changes, in terms of the energy relationships.Identify andcomment on power factor in relationship to load current, core losses and magnetizingcurrent.Revised: 9/10/2021 09:478 of 10
Transformer WaveformsRevised: 9/10/2021 09:479 of 10
Transformer WaveformsFigure 5Figure 6Revised: 9/10/2021 09:4710 of 10
voltages and currents of the transformer. Note that current I C is in phase with E 1 and that current I m is phase-shifted by 90 . From transformer theory, we recall that current I C represents power losses in the transformer core, and that current I m represents the