Transcription
Computerized Stock Trading SystemAn Interactive Qualifying Project ReportSubmitted to the Faculty ofWorcester Polytechnic InstituteSubmitted By:Hairan LiChenchen ZhangSubmitted to:Project Advisor: Michael J. RadzickiOctober 1st, 2012
Table of ContentsTable of Tables . 4Table of Figures. 51.Introduction and Statement of the Problem . 72.Background Research and Literature Overview . 92.1 Charlie Wright . 92.2 Encyclopedia of Trading Strategies. 102.2.1 Data Time Frame . 102.2.1 Entry Strategy . 102.2.2 Exit Strategy . 112.3 Karl Pearson’s Correlation Coefficient . 112.3.1 Statistical hypothesis test . 112.3.2 Significance level . 112.3.3 SPSS & Excel . 122.4 Van Tharp, Expectancy and Expectunity . 122.4.1 Van Tharp. 122.4.2 Expectancy and Expectunity . 122.5 Sector Rotation Model . 132.5.1 Sector Rotation . 132.5.2 Economic Cycles. 132.5.3 Sector Rotation Model . 132.6 Tradestation. 133. Portfolio Analyses for Limited Investors . 143.1 An Overview . 143.2 Correlation Analysis . 143.2.1 Correlation Analysis for Current Portfolio . 153.2.2 Correlations in Bull and Bear Markets . 183.3 Expectancy of Limited Investors . 223.4 Sector Rotation Analysis . 243.4.1 Market Sector Rotation . 243.4.2 Limited Investors’ Portfolio . 262
3.4.3 Diversification by Sectors . 273.4.4 Calendar Strategy for ETF . 293.5 Comparing Different Exit Strategies with Tradestation . 303.5.1 Entry Strategy . 313.5.2 Exit Strategy . 323.5.3 Comparison of different exit strategy . 434. Conclusions . 445. References . 466. Appendixes. 473
Table of TablesTable 1 Example Correlation . 15Table 2 Correlations Coefficient for Porter Stansberry Stocks in Bull Market . 19Table 3 Correlations Coefficient for Porter Stansberry Stocks in Bear Market . 21Table 4 Correlation of Limited Investors' Portfolio . 474
Table of FiguresFigure 1: OGMCX vs. CHK Price Movement Chart Comparison . 17Figure 2: CHK vs. WMT Price Movement Chart Comparison . 18Figure 3: Raw Data for Expectancy Calculation . 23Figure 4: Expectancy Calculation . 24Figure 5: Market Sector Rotation Chart. 25Figure 6: Sector Rotation Model Chart . 26Figure 7: Limited Investor’s Approximate Sector Rotation Chart . 27Figure 8: Limited Investor's Money-weighted Portfolio Distribution . 28Figure 9: Limited Investor's Symbol-weighted Portfolio Distribution . 29Figure 10: Limited Investor's Net Value in Sectors . 30Figure 11: AKAM TradeStation Profit Optimization for Exit at N Bar . 34Figure 12: AKAM Profit Optimization for Exit at N Bar Summary . 35Figure 13: AKAM Profit Optimization for Trailing Stop . 36Figure 14: AKAM Profit Optimization for Trailing Stop Summary . 37Figure 15: AKAM Profit Optimization for Profit Target . 38Figure 16: AKAM Profit Optimization for Profit Target Summary . 38Figure 17: AKAM Profit Optimization for Moving Average Crossover . 39Figure 18: AKAM Profit Optimization for Moving Average Crossover Summary . 40Figure 19: AKAM Profit Optimization for RSI Movement . 41Figure 20: AKAM Profit Optimization for RSI Movement Summary . 42Figure 21: Comaprision Report of Our Strategy's Performance and Limited Investor'sPerformance . 435
AbstractThe purpose of this project is to improve the portfolio distribution and tradingperformance of the Limited Investor’s Investment Club by investigating various tradingstrategies and introducing portfolio analysis techniques based on past trading records. The stockselection of the Club was determined mainly on the suggestions provided by Porter Stansberry’smonthly newsletter. In addition, Club members’ recommendations of fast growing stocks werealso considered. After seven weeks of meeting with two members of the Club, Fred Hudson andChristopher Shustak, we found that the Club had poor return on their investments due to the lackof scientific and technology-based approaches. We then evaluated the correlation coefficientamong the stocks in the Club’s portfolio. Correlations of stocks from different sources such asPorter Stansberry and Breakfast Club Meeting were also evaluated in conjunction withcorrelations of the stocks in bull and bear markets in order to diversify the portfolio and decreasethe risk of investments. By applying a Sector Rotation Model we identified the portfolio’s capitalmovement among different industries and sectors as well as the Club’s capital distributionamong sectors. After all the research and analysis, we built our own trading strategies onTradestation. By back-testing selected stocks and profit-optimization, we compared the tradingperformances of each selected stock relative to the Club’s original strategy of “buy and hold”. Atthe end of this project we came up with a list of strategies that could be applied to LimitedInvestors Investment Club to improve their trading performance.6
1. Introduction and Statement of the ProblemThe foundation of the Limited Investor’s Investment Club can be traced back to the 1950’s inWorcester, where it was initiated as a group of young professionals sharing an interest in savingand investing their earnings and discussing preparations and plans for retirement. According toMr. Frederick Hutson, who is the Lab Manager of the Physics Department for WPI and also amember of the Limited Investor’s Club, one of the main purposes of Club is to offer anopportunity for individuals from different backgrounds to communicate, discuss and learnvarious trading and investment strategies through monthly breakfast meetings.The current investing strategies accepted by the Club members for major decisions are derivedfrom Porter Stansberry’s monthly Newsletter1 and the Dogs of the Dows trading strategy. As awell-known value investor, Porter Stansberry founded Stansberry & Associates InvestmentResearch in 1999, which releases monthly investing advice in forms of different newsletters eachtargeted at distinct investor groups. The newsletter subscribed by Limited Investor’s Club dealsmainly with “safe value investment poised to give subscribers years of exceptional returns”.2 TheDogs of the Dow is a classic investment strategy, in which the investor annually selects the tenDow Jones Industrial Average stocks whose dividend is the highest fraction of their price.Besides these two outside resources, sparks of innovative thoughts and ideas flash during themonthly breakfast meeting when members share their brilliant opinions and present what theylearned from publications or media recently. Trade, as a result of the discussion, eventuallyoccurs after the Club takes all the thoughts and opinions into consideration.According to the general introduction by Mr. Hutson, members of Limited Investors use theirown savings to contribute to the group fund, which covers usual trading cost, monthly dining andactivity fees. The driving principal of the Club is to generate more capital for life after retirementthrough wise investing, and trading decisions are made seriously and cautiously. In this project,we had a weekly meeting with two members of the Club, Fred Hutson and Christopher Shustak,along with our advisor, Professor Michael Radzicki. Thanks to the generous and selfless1The Investment Advisory Newsletter covers various types of investment opportunities with the goal of providing spectacularreturns for tors.asp7
contribution of the two members, we were able to take advantage of the yearlong historical dataand trading minutes from Fidelity, which included but not limited to details about deposits,withdrawals and trades. Based on the comprehensive analysis conducted by our group, althoughthe general performance of the Club’s portfolio did not reach their expectation, it is certain thatopportunities for further improvement exist.The purpose of this project is to make suggestions to the Club by showing improvementachieved by minor changes and tweaks to their trading strategy that requires a modest amount ofwork and effort, which they could accomplish during the monthly breakfast meetings. Throughan extensive analysis of their current portfolio, advice regarding several aspects is offered. First,we used statistical tools to calculate the correlation coefficient of the Club’s portfolio in differentsectors, markets and timeframes. Second, we investigated the change in their portfolio fromquarter to quarter and correlated the trend of change with the sector rotation model. Finally, wedeveloped a corresponding exit strategy for the stocks in distinctive sectors by comparing thestrategy performance report generated by Tradestation, a powerful platform favored by manyprofessional traders.8
2. Background Research and Literature Overview2.1 Charlie WrightCharlie Wright is a very experienced and successful trader. His involvement in the field offinancial services has allowed him to gain a great deal of practical experience in observing howmarkets move and the potential benefits of using a systematic approach. He was one of the firstpeople who started to trade using Tradestation. His book, “Trading as a Business”, captures theessence of strategic trading with the use of Tradestation. In his book, he showed how strategytrading produces better trading performance than non-strategy trading. Automated trading willprevent or decrease the possibility of emotions or anxieties impacting trading decisions. A tradershould have his or her own trading system based on his or her own rules that the profit or loss ispsychologically acceptable for oneself.Charlie categorized three types of traders in the market: discretionary traders, technical tradersand strategy traders.Based on the current trading behavior and pattern of the Limited Investor Club, they mostresemble the technical trader described in Charlie Wright’s book. A technical trader usestechnical indicators, hotlines, newsletters and perhaps some personally defined objective rules toenter and exit the market3 by applying the objective rule of highest dividends and lowest price tothe stocks recommended by monthly Porter Stansberry’s Investor Advisory. The LimitedInvestor Club fits the definition of a technical trader by showing their understanding ofimportance of objective criteria such as indicator confirmation before making a trade. Rules havebeen developed, but how strict members are about these criteria often depending on theconfidence they gained from the monthly performance report from Fidelity. Fortunately, theyrealize the urge for a more strategic and scientific approach for trading as they start to sense theimmense value in historical strategy performance data and the essence of back testing on pastdata.3Wright, C. Trading as a Business9
“A strategy trader trades a strategy—a method of trading that uses objective entry and exitcriteria that have been validated by historical testing on quantifiable data.”4 The main purpose ofthis project is to help the Limited Investor to transit from technical trader to strategy trader.Strategy traders are restricted by a set of rules known as the strategy. As a strategy trader, youwill not deviate from your strategy’s rules at all, unless you have decided to use a differentstrategy altogether. The current trading pattern of the Limited Investor Club, although it includessome aspects of usage of indicators and newsletters, are largely based on emotion and intuitionrather than specified and explicit rules. Deviation occurs when the Club member’s emotion andintuition overwhelm the designated strategy and rule. Thus, the Club needs an automated andreliable trading system.2.2 Encyclopedia of Trading Strategies2.2.1 Data Time FrameData may be used in its natural time frame or may need to be processed into a different timeframe. There are three general types of data we can collect: intra-day, daily or weekly. Choosingthe time frame that is appropriate for the Club is almost as important as the type of market actionand strategy the Club will want to trade. However, according to the decision making pattern ofLimited Investors, one suitable time frame could be based on a daily chart.2.2.1 Entry StrategyWhat constitutes a good Entry?By applying a good entry, the investor could initiate a trade at a point of low potential risk andhigh potential reward. A point of low risk is usually a point from which there is little adverseexcursion5 before the market begins to move in the trade’s favor. Entries that yield small adverseexcursions on successful trades are desirable because they permit fairly tight stops to be set,45Wright, C. Trading as a Businessloss suffered by a single trade while it is open10
thereby minimizing risk. A good entry should also have a high probability of being followedquickly by favorable movement in the market.2.2.2 Exit StrategyThere are two goals that a good exit strategy attempts to achieve. The first and most importantgoal is to strictly control losses. The exit strategy must dictate how and when to get out of a tradethat has gone wrong so that significant erosion of trading capital can be prevented. This goal isoften referred to as money management and is frequently implemented using stop-loss orders(money management stops). The second goal of a good exit strategy is to ride a profitable tradeto full maturity. The exit strategy should determine not only when to get out with a loss, but alsowhen and where to get out with a profit.2.3 Karl Pearson6’s Correlation CoefficientThe Karl Person’s correlation coefficient was conducted multiple times in our project, it playedan important role in analyze the relations between stocks. In statistics, the Karl Pearson’scorrelation coefficient is a common measure of the correlation between variables.2.3.1 Statistical hypothesis testA statistical hypothesis test is a method of making decisions using data from a controlledexperiment or an observational study (not controlled). In statistics, a result is called statisticallysignificant if it is unlikely to have occurred by chance alone. A pre-determined parameter calledsignificance level is therefore introduced to test the result.2.3.2 Significance level6Karl Pearson was an influential English mathematician who has been credited with establishing the discipline ofmathematical statistics. -- http://en.wikipedia.org/wiki/Karl Pearson11
The amount of evidence required to accept that an event is unlikely to have arisen by chance isknown as the significance level or critical p-value. In traditional Fisherian statistical hypothesistesting, the p-value is the probability of observing data at least as extreme as that observed, giventhat the null hypothesis is true. If the obtained p-value is small then it can be said either the nullhypothesis is false or an unusual event has occurred.2.3.3 SPSS & ExcelSPSS is a computer program used for survey authoring, deployment, data mining, text analytics,statistical analysis, collaboration and deployment. Most of the correlation analysis in the projectis accomplished by using SPSS and Excel.2.4 Van Tharp, Expectancy and Expectunity2.4.1 Van TharpVan Tharp is a famous trader who has developed a series of trading strategies. In his bestsellingbook, “Trade Your Way to Financial Freedom”,7 he first mentioned the theory of Expectancyand Expectunity.2.4.2 Expectancy and ExpectunityExpectancy is defined as the average profit or loss per dollar risked per trade. It is a measurementof profit made during a certain period of time over multiple trades, also known as the essence ofsuccessful trading. Expectancy can be mathematically calculated as:Expectunity is defined as the total profit or loss per dollar risked over all trades. It is calculatedas:7Publication Date: December 1, 1998 ISBN-13: 978-007064762612
Expectunity Expectancy * Number of trades.2.5 Sector Rotation Model82.5.1 Sector RotationSector rotation is an investment strategy involving the movement of money from one industrysector to another in an attempt to beat the market.2.5.2 Economic CyclesAccording to Sector Rotation Theory, Economy Cycles are always divided into four stagesknown as full recession, early recovery, late recovery and early recession. Each of the four stageshas different market characteristics and industry movements.2.5.3 Sector Rotation ModelThe Sector Rotation Model was created to help investors increase profit by following thebooming sectors of the market. A trader must conduct review and inspection on the market at aregular time in order to apply the Sector Rotation Model into strategies.2.6 TradestationAs one of the mainstream professional electronic trading platforms for financial market traders,Tradestation is used mainly by retail and relatively small investment operations. This powerfultool provides extensive functionality for receiving real-time data, displaying charts and enteringinvestment positions. Besides plenty of pre-defined indicators and strategies, users can evencreate their own indicators, strategies and functions using the built-in EasyLanguageprogramming rs/2011/04/the-sector-rotation-model.html13
2.7.1 Easy LanguageThe integration of Easy Language into Tradestation enables the users to create customizedindicators and algorithmic trading strategies for the different types of market. Because of thelanguage’s relative simplicity, individual investors can form their own strategies withoutspecialized computer training. 93. Portfolio Analyses for Limited Investors3.1 An OverviewWith the historical monthly reports and current portfolio distribution provided by LimitedInvestors, we applied several of the techniques that were introduced in previous sections to theirportfolio. First, we conducted a correlation analysis and looked up the correlation coefficientamong different equities. Certain positively or negatively correlated stocks were identified andsubsequently investigated. Secondly, we exploited the powerful section rotation model onwww.stockcharts.com10 to compare the portfolio’s cash flow from one sector to another. Finally,outcomes generated by using different exit strategies on the historical data of the stocks werecompared to the Club’s performance over the same period of time.3.2 Correlation AnalysisIn statistics, the Pearson product-moment correlation coefficient is a measure of the correlation,or linear dependence between two variables X and Y, giving a value between 1 and 1. It iswidely used in the sciences as a measure of the strength of linear dependence between twovariables. In terms of stock trading, variables X and Y could be a pair of stocks in a specific9EasyLanguage is a proprietary programming language that was developed by TradeStation built into its tradingplatform.10One of the most relied-upon websites for technical traders and chartists14
portfolio. The Pearson correlation of 1 means a perfect positive linear relationship whereas 1means a perfect decreasing linear relationship. Some value between 1 and 1 in all other casesindicate the degree of linear dependence between the variables. A coefficient of zero means thatthere is no linear relationship between two stocks.In our project, we used SPSS to perform correlation analysis for the current portfolio in terms ofdifferent markets and stock types. One huge advantage of SPSS is its ability to deal with hugechunks of data. In our current portfolio there are a total of 43 different equities and about 10 foreach type. However, when we tried to analyze the stocks in terms of clusters, MS Excel providedus with a more accurate and intuitive way to recognize the pattern of how different correlatedstocks are distributed in each cluster.3.2.1 Correlation Analysis for Current PortfolioFirst, we downloaded the weekly historical prices for all the stocks in the current portfolio fromYahoo! Finance. We can do the same using Tradestation, but Yahoo was a better choice becauseit was much more convenient and the data was generated in a neat manner for furthermanipulation. For the sake of simplicity, we chose close price for the correlation analysis. Afterthe data was downloaded in a CSV file, we then imported the file into Excel, and used the builtin CORREL function to calculate the correlation coefficient between different pairs of stocks.Table 1 below illustrates part of the results:Table 1 Example CorrelationPearson . (2-tailed)N44Pearson Correlation.961** 1.692**.639**-.349*.731**Sig. (2-tailed).000.000.000.020.000N4444444444Pearson Correlation.673** .692**1.741**-.366*.667**4415
MONEXCDSLVATVITGPCHKEOGSig. (2-tailed).000.000.000.015.000N444444444444Pearson Correlation.603** .639**.741**1-.415**.494**Sig. ***Pearson Correlation-.357-.349-.366Sig. (2-tailed).017.020.015.005N444444444444Pearson Correlation.728** .731**.667**.494**.1271Sig. (2-tailed).000.000.000.001.410N444444444444Pearson Correlation-.593** -.591**-.626**-.272.051-.746**Sig. rson Correlation.460** .503**.565**.534**.247.746**Sig. rson Correlation.185.243.348*.621**-.461**-.101Sig. rson Correlation-.726** -.694**-.796**-.497**.403**-.708**Sig. rson Correlation.028.031.526**.496**-.431**-.097Sig. .415.410
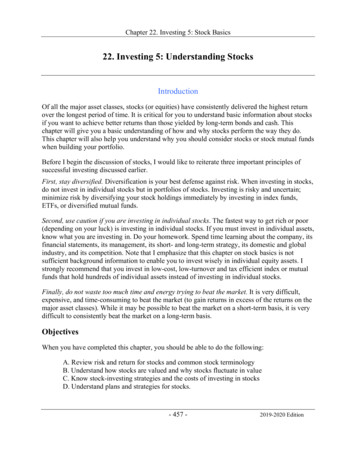
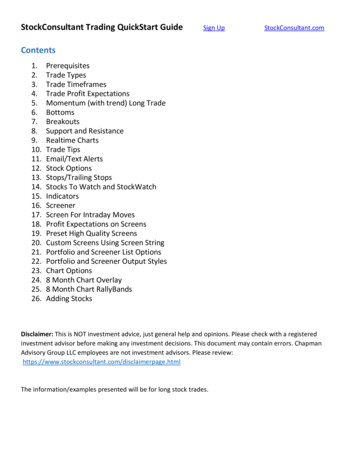
Although these figures may appear interesting at first, we could not draw any objectiveconclusions without a test of significance. The correlation coefficient represents the strength ofthe relationship between two variables in the sample. However, it is the test of significance thattells if the probability of the population correlation is zero.Figure 1 below shows two pairs of stocks in the current portfolio that have had a strongcorrelation, either positive or negative, in the past year. Oppenheimer Gold & Special Minerals(OGMCX) and Chesapeake Energy (CHK) had a strong positive correlation, 0.92, whileChesapeake Energy (CHK) and Walmart(WMT) had a very negative correlation, -0.796.Figure 1 OGMCX V.S CHK price movement chart comparisonAs we may see in Figure 1, the price of OGMCX and CHK move up and down in a very similarpattern.17
Figure 2 CHK V.S WMT price movement chart comparisonFurther, the prices of CHK and WMT went in the opposite direction since the beginning of 2011,which corresponds to a strong negative correlation. As the price of CHK went up in the firstseason, WMT did exactly the opposite. Figure 2 above demonstrate visually the price movementof CHK and WMT.3.2.2 Correlations in Bull and Bear MarketsThe previous analysis was conducted in a one-year time frame. However, in order to trulyconfirm the related behavior among different equities, we investigated how the market changesthe correlation between stocks. Our conclusion could be strengthened if new evidence is found inBull Market or Bear Market. In order to do this, we use the Tradestation to identity the recentBull and Bear Market patterns to settle the time frame for later analysis.One traditional technique used in identifying the market trend is to observe the cross point of thetwo simple moving averages (SMA). The most commonly used combination of simple movingaverages is 50-day and 200-day. A typical transition to bull market happens after the 50-day18
moving average crosses and stays above the 200 day moving average. The intersection iscommonly known as “Golden Cross”. On the other hand, if the 50-day moving average crossesand stays below the 200-day moving average, a “Death cross” appears, and a Bear Marketemerges subsequently.Finally we ran the correlation analysis of the current portfolio in a Bull Market from June 2009to May 2011 and then again in a Bear Market from December 2007 to June 2009.3.2.2.1 Porter Stansberry Correlation in Bull MarketAfter importing the CSV downloaded from Yahoo Finance, we used SPSS to calculate thecorrelation coefficients and the corresponding P-value. Part of the output is showed in Table 2:Table 2 Correlations Coefficient for Porter Stansberry Stocks in Bull MarketHSYHSYCOPWMTMONEXCDPearson Correlation 1.731**.153-.913**-.864**.827**Si
trading produces better trading performance than non-strategy trading. Automated trading will prevent or decrease the possibility of emotions or anxieties impacting trading decisions. A trader should have his or her own trading system based on his or her own rules that the