Transcription
Quantitative Data Analysis withSPSS Release 8 for WindowsThis latest edition of Quantitative Data Analysis with SPSS for Windows hasbeen completely revised in order to accommodate the needs of users of SPSSRelease 8 for Windows, which has been designed to operate in a Windows 95environment.Like its predecessor, it provides a non-technical approach to quantitative dataanalysis and a thorough introduction to the widely used SPSS for Windows.Questions are posed at the end of each chapter, enabling the student to acquirea wide range of analysis techniques and become familiar with theirimplementation.Techniques covered include: univariate analysis (frequency tables, measuresof central tendency and dispersion, histograms, etc.); bivariate analysis(contingency tables, correlation, simple regression, analysis of variance, nonparametric tests); and multivariate analysis (multiple regression, path analysis,multivariate analysis of variance and covariance, factor analysis). In addition,the book covers issues such as sampling, statistical significance,conceptualizing and measurement, and the selection of appropriate tests. Thedatasets used in the book are available via the Internet tles/quant.htmlAlan Bryman and Duncan Cramer both teach at Loughborough Universityand have written several books on statistical analysis with both SPSS andMinitab.
Quantitative Data Analysiswith SPSS Release 8 forWindowsA guide for social scientistsAlan Bryman and Duncan CramerLondon and New York
For Sue, Sarah and StellaFirst published 1999by Routledge11 New Fetter Lane, London, EC4P 4EESimultaneously published in the USA and Canadaby Routledge29 West 35th Street, New York, NY 10001Routledge is an imprint of the Taylor & Francis GroupThis edition published in the Taylor & Francis e-Library, 2003. 1999 Alan Bryman and Duncan CramerAll rights reserved. No part of this book may be reprinted orreproduced or utilised in any form or by any electronic,mechanical, or other means, now known or hereafterinvented, including photocopying and recording, or in anyinformation storage or retrieval system, without permission inwriting from the publishers.British Library Cataloguing in Publication DataA catalogue record for this book is available from the British LibraryLibrary of Congress Cataloging in Publication DataBryman, Alan.Quantitative data analysis with SPSS release 8 for Windows:a guide for social scientists/Alan Bryman & Duncan Cramer.Includes bibliographical references and index.1. SPSS for Windows. 2. Social sciences—Statisticalmethods—Computer programs. I. Cramer, Duncan, 1948–.II. Title.HA32.B795 1999519.5’078’55369–dc2198–44332ISBN 0-203-45962-8 Master e-book ISBNISBN 0-203-76786-1 (Adobe eReader Format)ISBN 0-415-20696-0 (hbk)ISBN 0-415-20697-9 (pbk)
ContentsList of figuresList of boxesList of tablesPrefaceviviiixixv1 Data analysis and the research process12 Analyzing data with computers: first steps with SPSS 8for Windows163 Analyzing data with computers: further steps with SPSS8 for Windows424 Concepts and their measurement555 Summarizing data716 Sampling and statistical significance997 Bivariate analysis: exploring differences between scoreson two variables1158 Bivariate analysis: exploring relationships betweentwo variables1649 Multivariate analysis: exploring differences among threeor more variables20410 Multivariate analysis: exploring relationships amongthree or more variables23411 Aggregating variables: exploratory factor analysis271Answers to exercisesBibliographyIndexAppendix: SPSS Release 9.0286295298304v
.65.75.85.95.105.116.16.26.37.18.18.28.38.48.5The research processA spurious relationshipAn experimentThree types of experimental designA relationship between two variablesIs the relationship spurious?Two possible causal interpretations of a relationshipDeciding the nature of a variableConcepts, dimensions and measurementsBar chart of data on faculty membershipHistogram for income dataPie chart for ethnicgpThe inter-quartile rangeStem and leaf display for NeedsBoxplotBoxplot for NeedsTwo normal distributionsThe normal distribution and the meanProperties of the normal distributionPositively and negatively skewed distributionsThe distribution of similar theoretical outcomes of tossinga coin twiceThe distribution of similar theoretical outcomes of tossinga coin six timesOne-tailed and two-tailed 0.05 levels of significanceA comparison of the distribution of the standard error of thedifferences in means for related and unrelated samplesScatter diagram: political liberalism by incomeScatter diagram: income by ageA perfect relationshipNo relationship (or virtually no relationship)Three curvilinear 496106108112155177178179179179
wo positive relationshipsTwo negative relationshipsThe strength and direction of correlation coefficientsTypes of relationshipA line of best fitRegression: a negative relationshipRegression: a negative interceptRegression: a perfect relationshipThe accuracy of the line of best fitScatter diagrams for two identical levels of correlationHeteroscedasticityAn example of an interaction between two variablesExamples of other interactionsExamples of no interactionsSchematic representation of a significant one-way effectIs the relationship between work variety and job satisfactionspurious?Is the relationship between work variety and job satisfactionaffected by an intervening variable?Is the relationship between work variety and job satisfactionmoderated by gender?Work variety and participation at workThe effects of controlling for a test variablePath diagram for satisPath diagram for satis with path coefficientsPath diagram for absenceCommon and unique varianceScree test of 206207208237239243245248264266267275277
15.2Opening display for SPSS23Data option drop-down menu23Define Variable dialog box24Define Missing Values subdialog box27Define Variable Type subdialog box27Define Labels subdialog box29Define Column Format subdialog box30Template dialog box30Formatting a disk31Save Data As dialog box31Open File dialog box33File drop-down menu33Define Fixed Variables dialog box34Browse subdialog box34Descriptives dialog box35Descriptives: Options subdialog box36Help Topics dialog box38Help information box38Select Cases dialog box43Select Cases: If subdialog box43Recode into Different Variables dialog box46Recode into Different Variables: Old and New Valuessubdialog box47Summarize Cases dialog box48Recode into Same Variables dialog box49Recode into Same Variables: Old and New Values subdialog box 49Compute Variable dialog box51Reliability Analysis dialog box66Reliability Analysis: Statistics subdialog box67Recoding income into incomegp76Recode into Different Variables: Old and New Valuessubdialog box76viii
encies dialog boxBar Charts dialog boxDefine Simple Bar: Summaries for Groups of Casessubdialog boxPie Charts dialog boxDefine Pie: Summaries for Groups of Cases subdialog boxExplore dialog boxFrequencies: Statistics subdialog boxBinomial Test dialog boxChi-Square Test dialog boxCrosstabs dialog boxCrosstabs: Cell Display subdialog boxCrosstabs: Statistics subdialog boxTwo-Related-Samples Tests dialog boxTests for Several Related Samples dialog boxOne-Sample Kolmogorov-Smirnov Test dialog boxTwo-Independent-Samples Tests dialog boxTwo Independent Samples: Define Groups subdialog boxTests for Several Independent Samples dialog boxSeveral Independent Samples: Define Range subdialog boxOne-Sample T Test dialog boxIndependent-Samples T Test dialog boxDefine Groups subdialog boxOne-Way ANOVA dialog boxOne-Way ANOVA: Options subdialog boxOne-Way ANOVA: Contrasts subdialog boxOne-Way ANOVA: Post Hoc Multiple Comparisonssubdialog boxPaired-Samples T Test dialog boxGLM—Repeated Measures Define Factor[s] dialog boxGLM—Repeated Measures subdialog boxGLM—Repeated Measures: Options subdialog boxCrosstabs dialog boxCrosstabs: Statistics subdialog boxCrosstabs: Cell Display subdialog boxScatterplot dialog boxSimple Scatterplot subdialog boxBivariate Correlations dialog boxMeans dialog boxMeans: Options subdialog boxLinear Regression dialog boxGLM—General Factorial dialog boxGLM—General Factorial: Options subdialog boxGLM—General Factorial: Model subdialog 184185190191200214215218
.211.311.411.5GLM—Multivariate dialog boxGLM—Multivariate: Options subdialog boxGLM—Repeated Measures Define Factor[s] dialog boxGLM—Repeated Measures subdialog boxGLM—Repeated Measures: Options subdialog boxFull GLM—Repeated Measures Define Factor[s] dialog boxGLM—Repeated Measures subdialog box (combineddesign analysis)Partial Correlations dialog boxPartial Correlations: Options subdialog boxLinear Regression dialog boxLinear Regression: Statistics subdialog boxFactor Analysis dialog boxFactor Analysis: Descriptives subdialog boxFactor Analysis: Extraction subdialog boxFactor Analysis: Rotation subdialog boxFactor Analysis: Options subdialog 4
55.65.75.86.16.26.36.47.17.27.37.47.57.6Data on television violence and aggression9The Job-Survey data18The SPSS names and column locations of the Job-Survey variables 21Default Descriptives output36Descriptives Mean output36Mean age of men in the Job Survey44Case Summaries output showing receded values of rsatis2and rsatis448Case Summaries output showing values of satis1, rsatis2,satis3, rsatis4 and satis51Types of variable60Reliability Analysis output for satis66The faculty membership of fifty-six students72Frequency table for faculty membership73Frequency table for income74Frequency table for incomegp77Results of a test of mathematical ability84Explore output for income87Percentage of special needs reports in local authorities89Probable mathematics marks95Devising a stratified random sample102Four possible outcomes of tossing a coin twice105Theoretical outcomes of tossing a coin six times and theprobabilities of similar outcomes107Type I and Type II errors112Tests of differences118Binomial test comparing proportion of men and women121Binomial test comparing proportion of whites and non-whites121One-sample chi-square test comparing number of people inethnic groups123Chi-square test with insufficient cases124Chi-square test produced by Crosstabs127xi
lesThe Panel-Study dataMcNemar testCochran Q testOne-sample Kolmogorov-Smirnov testTwo-sample Kolmogorov-Smirnov testMedian testMann-Whitney testKruskal-Wallis testSign testWilcoxon matched-pairs signed-ranks testFriedman testOne-sample t testUnrelated t testt test comparing quality of work in men and womenA one-way analysis of variance tableDescriptive group statistics with one-way analysis of varianceStatistics provided by a one-way contrastStatistics provided by a one-way Scheffé testOutput for Levene’s test for homogeneity of variancesRelated t test comparing satisfaction across first two monthsRepeated-measures means and standard deviations forjob satisfactionRepeated-measures multivariate testsRepeated-measures univariate tests of significance fortransformed variablesRepeated-measures averaged test of significanceData on job satisfaction and absenteeismFour possible combinationsThe relationship between job satisfaction and absenteeismTwo types of relationshipContingency table: skill by genderRated skill by genderData on age, income and political liberalismMatrix of Pearson product moment correlation coefficientsMatrix of Spearman’s rho correlation coefficientsMeans output for satis by skillThe impact of outliersRegression analysis: satis by routineThe Depression-Project dataMeans of post-test depression (patpost) in the three treatmentsfor men and womenHomogeneity tests outputTests of significance for main and interaction effects of afactorial 86187192198201212215216216
910.1010E.110E.211.111.211.311.411.5Tests of significance for effects on pre-test depressionAnalysis of covariance tables showing test of homogeneityof slope of regression line within cellsAnalysis of covariance tableAdjusted means of post-test depression in the three treatmentsMeans and standard deviations of patpost and infpost forthe three treatmentsBox’s M testLevene’s testBartlett’s test of sphericityMultivariate tests of significance for the treatment effectUnivariate tests of significance for the two dependentmeasuresTest of significance for interaction between time andtreatmentMeans and standard deviations of patient-rated pre-test (patpre)and post-test (patpost) depression in the three treatmentsRelationship between the covariate age and the two transformedvariablesMultivariate tests for the interaction between time, treatmentand genderUnivariate tests for the interaction effect between time,treatment and genderTransformed variablesRelationship between work variety and job satisfactionA spurious relationshipA non-spurious relationshipAn intervening variableA moderated relationshipTwo independent variablesIncome, age and support for the market economyPartial correlation coefficientsComparison of unstandardized and standardized regressioncoefficients with satis as the dependent variableSPSS multiple regression outputThe relationship between approval of equal pay legislationand genderThe relationship between approval of equal pay legislationand gender holding age constantCorrelation and significance-level matrices for itemsCommunalities of principal componentsCommunalities of principal axesInitial principal components and their varianceItem loadings on first two principal 3275275276278
xiv11.611.711.811.9TablesItem loadings on first two principal axesItem loadings on orthogonally rotated factorsItem loadings on obliquely rotated factorsCorrelations between oblique factors278279281281
PrefaceIn this book, we introduce readers to the main techniques of statistical analysisemployed by psychologists and sociologists. However, we do not see the bookas a standard introduction to statistics. We see the book as distinctivelydifferent because we are not concerned to introduce the often complexformulae that underlie the statistical methods covered. Students often findthese formulae and the calculations that are associated with them extremelydaunting, especially when their background in mathematics is weak. Moreover,in these days of powerful computers and packages of statistical programs, itseems gratuitous to put students through the anxiety of confronting complexcalculations when machines can perform the bulk of the work. Indeed, mostpractitioners employ statistical packages that are run on computers to performtheir calculations, so there seems little purpose in treating formulae and theirapplication as a rite de passage for social scientists. Moreover, few studentswould come to understand fully the rationale for the formulae that they wouldneed to learn. Indeed, we prefer the term ‘quantitative data analysis’ to‘statistics’ because of the adverse image that the latter term has in the minds ofmany prospective readers.In view of the widespread availability of statistical packages and computers,we feel that the two areas that students need to get to grips with are how todecide which statistical procedures are suitable for which purpose, and how tointerpret the ensuing results. We try to emphasize these two elements in thisbook.In addition, the student needs to get to know how to operate the computerand, in particular, how to use computer software needed to perform thestatistical procedures described in this book. To this end, we introduce studentsto what is probably the most widely used suite of programs for statisticalanalysis in the social sciences—the Statistical Package for the Social Sciences(SPSS). This package was first developed in the 1960s and was the first majorattempt to provide software for the social scientist. It has since undergonenumerous revisions and refinements. The first two editions of this book(Bryman and Cramer 1990, 1994) dealt with versions of SPSS that werexv
xviPrefacedesigned for mainframe computers or for the Microsoft operating system MSDOS. A few years ago, a version of SPSS was developed to operate within thewidely used Microsoft Windows environment. This too has undergone a numberof revisions. The previous edition of this book (Bryman and Cramer 1997) wasconcerned with Release 6 for Windows which was designed for MicrosoftWindows 3.11. After the introduction of Windows 95, a new release of SPSS(Release 7) was designed to run on this operating system. The latest version forWindows 95 is Release 8 (SPSS 1998). The present book describes the use ofRelease 8, which we shall refer to for short as SPSS unless otherwise indicated.Users of Releases 7 and 7.5 will find the version that we describe in this bookmore useful and familiar to them than that described in Bryman and Cramer(1997), which was Release 6.In order to distinguish methods of quantitative data analysis from SPSScommands, the latter are always in bold. We also present some data thatstudents can work on and the names of the variables are also in bold (e.g.income). The data sets can be copied from the Routledge website on the Internetat the following ks/titles/quant.html.There are exercises at the end of each chapter and the answers are provided forall exercises at the end of the book. We hope that students and instructors alikefind these useful; they can easily be adapted to provide further exercises.The case for combining methods of quantitative data analysis used by bothpsychologists and sociologists in part derives from our belief that therequirements of students of the two subjects often overlap substantially. Nonethe less, instructors can omit particular techniques as they wish.We wish to thank David Stonestreet, formerly of Routledge, for his supportof the earlier editions of this book and our current editor Vivien Ward for hersupport of the present book. We also wish to thank Louis Cohen, Max Huntand Tony Westaway for reading the manuscript for the first edition of thisbook and for making useful suggestions for improvement. We accept that theycannot be held liable for any errors in that or the present edition. Such errorsare entirely of our own making, though we will undoubtedly blame each otherfor them.Alan Bryman and Duncan CramerLoughborough University
Chapter 1Data analysis and theresearch processThis book largely covers the field that is generally referred to as ‘statistics’, butas our Preface has sought to establish, we have departed in a number of respectsfrom the way in which this subject is conventionally taught to under- andpostgraduates. In particular, our preferences are for integrating data analysiswith computing skills and for not burdening the student with formulae. Thesepredilections constitute a departure from many, if not most, treatments of thissubject. We prefer the term ‘quantitative data analysis’ because the emphasis ison the understanding and analysis of data rather than on the precise nature of thestatistical techniques themselves.Why should social science students have to study quantitative data analysis,especially at a time when qualitative research is coming increasingly to the fore(Bryman 1988a)? After all, everyone has heard of the ways in which statisticalmaterials can be distorted, as indicated by Disraeli’s often-quoted dictum:‘There are lies, damn lies and statistics’. Why should serious researchers andstudents be prepared to get involved in such a potentially unworthy activity? Ifwe take the first issue—why should social science students study quantitativedata analysis—it is necessary to remember that an extremely large proportion ofthe empirical research undertaken by social scientists is designed to generate ordraws upon quantitative data. In order to be able to appreciate the kinds ofanalyses that are conducted in relation to such data and possibly to analyze theirown data (especially since many students are required to carry out projects), anacquaintance with the appropriate methods of analysis is highly desirable forsocial science students. Further, although qualitative research has quite properlybecome a prominent strategy in sociology and some other areas of the socialsciences, it is by no means as pervasive as quantitative research, and in any casemany writers recognize that there is much to be gained from a fusion of the tworesearch traditions (Bryman 1988a).On the question of the ability of statisticians to distort the analyses that theycarry out, the prospects for which are substantially enhanced in many people’seyes by books with such disconcerting titles as How to Lie with Statistics (Huff1973), it should be recognized that an understanding of the techniques to becovered in our book will greatly enhance the ability to see through the1
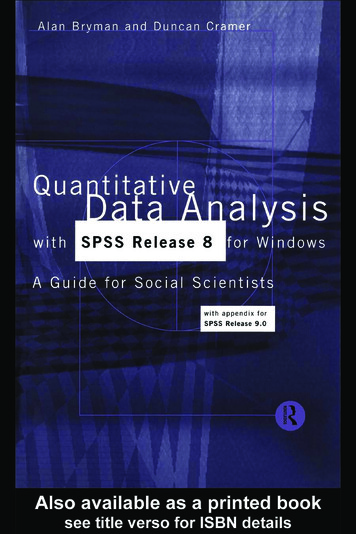
2Data analysis and the research processmisrepresentations about which many people are concerned. Indeed, theinculcation of a sceptical appreciation of quantitative data analysis is beneficialin the light of the pervasive use of statistical data in everyday life. We aredeluged with such data in the form of the results of opinion polls, marketresearch findings, attitude surveys, health and crime statistics, and so on. Anawareness of quantitative data analysis greatly enhances the ability to recognizefaulty conclusions or potentially biased manipulations of the information. Thereis even a fair chance that a substantial proportion of the readers of this book willget jobs in which at some point they will have to think about the question of howto analyze and present statistical material. Moreover, quantitative data analysisdoes not comprise a mechanical application of predetermined techniques bystatisticians and others; it is a subject with its own controversies and debates,just like the social sciences themselves. Some of these areas of controversy willbe brought to the reader’s attention where appropriate.QUANTITATIVE DATA ANALYSIS AND THERESEARCH PROCESSIn this section, the way in which quantitative data analysis fits into the researchprocess—specifically the process of quantitative research—will be explored. Aswe will see, the area covered by this book does not solely address the questionof how to deal with quantitative data, since it is also concerned with otheraspects of the research process that impinge on data analysis.Figure 1.1 provides an illustration of the chief steps in the process ofquantitative research. Although there are grounds for doubting whether researchalways conforms to a neat linear sequence (Bryman 1988a, 1988b), thecomponents depicted in Figure 1.1 provide a useful model. The following stagesare delineated by the model.TheoryThe starting point for the process is a theoretical domain. Theories in the socialsciences can vary between abstract general approaches (such as functionalism)and fairly low-level theories to explain specific phenomena (such as votingbehaviour, delinquency, aggressiveness). By and large, the theories that aremost likely to receive direct empirical attention are those which are at a fairlylow level of generality. Merton (1967) referred to these as theories of the middlerange, to denote theories that stood between general, abstract theories andempirical findings. Thus, Hirschi (1969), for example, formulated a ‘controltheory’ of juvenile delinquency which proposes that delinquent acts are morelikely to occur when the child’s bonds to society are breached. This theory inlarge part derived from other theories and also from research findings relating tojuvenile delinquency.
Data analysis and the research process3Figure 1.1 The research processHypothesisOnce a theory has been formulated, it is likely that researchers will want to testit. Does the theory hold water when faced with empirical evidence? However, itis rarely possible to test a theory as such. Instead, we are more likely to find thata hypothesis, which relates to a limited facet of the theory, will be deduced fromthe theory and submitted to a searching enquiry. For example, Hirschi, drawingupon his control theory, stipulates that children who are tied to conventionalsociety (in the sense of adhering to conventional values and participating oraspiring to participate in conventional values) will be less likely to commitdelinquent acts than those not so tied. Hypotheses very often take the form ofrelationships between two or more entities—in this case commitment toconventional society and juvenile delinquency. These ‘entities’ are usuallyreferred to as ‘concepts’; that is, categories in which are stored our ideas andobservations about common elements in the world. The nature of concepts isdiscussed in greater detail in Chapter 4. Although hypotheses have theadvantage that they force researchers to think systematically about what theywant to study and to structure their research plans accordingly, they exhibit a
4Data analysis and the research processpotential disadvantage in that they may divert a researcher’s attention too faraway from other interesting facets of the data he or she has amassed.Operationalization of conceptsIn order to assess the validity of a hypothesis it is necessary to develop measuresof the constituent concepts. This process is often referred to asoperationalization, following expositions of the measurement process inphysics (Bridgman 1927). In effect, what is happening here is the translation ofthe concepts into variables; that is, attributes on which relevant objects(individuals, firms, nations, or whatever) differ. Hirschi operationalized the ideaof commitment to conventional society in a number of ways. One route wasthrough a question on a questionnaire asking the children to whom it was to beadministered whether they liked school. Delinquency was measured in one oftwo ways, of which one was to ask about the number of delinquent acts to whichchildren admitted (i.e. self-reported delinquent acts). In much experimentalresearch in psychology, the measurement of concepts is achieved through theobservation of people, rather than through the administration of questionnaires.For example, if the researcher is interested in aggression, a laboratory situationmay be set up in which variations in aggressive behaviour are observed. Anotherway in which concepts may be operationalized is through the analysis ofexisting statistics, of which Durkheim’s (1952/1898) classic analysis of suiciderates is an example. A number of issues to do with the process of devisingmeasures of concepts and some of the properties that measures should possessare discussed in Chapter 4.Selection of respondents or participantsIf a survey investigation is being undertaken, the researcher must find relevantpeople to whom the research instrument that has been devised (e.g. selfadministered questionnaire, interview schedule) should be administered.Hirschi, for example, randomly selected over 5,500 schoolchildren from an areain California. The fact of random selection is important here because it reflectsa commitment to the production of findings that can be generalized beyond theconfines of those who participate in a study. It is rarely possible to contact allunits in a population, so that a sample invariably has to be selected. In order tobe able to generalize to a wider population, a representative sample, such as onethat can be achieved through random sampling, will be required. Moreover,many of the statistical techniques to be covered in this book are inferentialstatistics, which allow the researcher to demonstrate the probability that theresults deriving from a sample are likely to be found in the population fromwhich the sample was taken, but only if a random sample has been selected.These issues are examined in Chapter 6.
Data analysis and the research process5Setting up a research designThere are two basic types of research design that are employed by psychologistsand sociologists. The former tend to use experimental designs in which theresearcher actively manipulates aspects of a setting, either in the laboratory or ina field situation, and observes the effects of that manipulation on experimentalparticipants. There must also be a ‘control group’ which acts as a point ofcomparison with the group of participants who receive the experimentalmanipulation. With a survey/correlational design, the researcher does notmanipulate any of the variables of interest and data relating to all variables arecollected simultaneously. The term correlation also refers to a technique foranalyzing relationships between variables (see Chapter 8), but is used in thepresent context to denote a type of research design. The researcher does notalways have a choice regarding which of the two designs can be adopted. Forexample, Hirschi could not make some children committed to school and othersless committed and ob
Boxes 2.1 Opening display for SPSS 23 2.2 Data option drop-down menu 23 2.3 Define Variable dialog box 24 2.4 Define Missing Values subdialog box 27 2.5 Define Variable Type subdialog box 27 2.6 Define Labels subdialog box 29 2.7 Define Column Format subdialog box 30 2.8 Template dialog box 30 2.9 Formatting a disk 3