Transcription
SPSS REFERENCE MANUAL
SPSS Reference Manual: A guide for market researchersPrepared by Paul HartzerFirst edit: 3/20/07Last edit: 2/15/10 2010 Paul HartzerSPSS is a registered trademark of SPSS, Inc, an IBM Company.SPSS Reference Manual2Paul Hartzer
Table of ContentsSPSS REFERENCE MANUAL1SPSS Reference Manual - Introduction .5The main SPSS interface .7Customizing the GUI .8More about syntax files .9SECTION 1: OVERVIEW10FILE HANDLING11Opening an existing SPSS datafile . 12Opening an existing syntax file . 13Creating a new SPSS datafile . 14Creating a new syntax file . 14Loading an existing flat ASCII datafile (advanced). 15Merging multiple files – Adding respondents . 19Merging multiple files – Adding variables . 21Saving an SPSS datafile . 23Saving a syntax file . 23Exporting SPSS data to ASCII . 24DATA MANIPULATION25The SPSS status bar . 26Weighting: Turning on . 27Weighting: Turning off . 27Weighting: Changing . 27Filtering . 28Recoding . 31DATA ANALYSIS34Overview . 35Frequencies . 36Basic cross-tabs . 37Advanced cross-tabs: General tables (intermediate) . 39Multiple response sets (advanced) . 41INTERFACING WITH EXCEL44Transferring SPSS Output to Excel . 45Other Excel topics . 46SECTION 2: ADVANCED TOPICS47LOADING AND SAVING DATA FILES48Introduction. 49Getting data . 50SPSS Reference Manual3Paul Hartzer
Labeling variables and values . 52Cleaning the Data . 54Saving the Data (and related commands) . 56Other Commands and Keywords . 57EXCEL STRING MANIPULATION58Introduction. 59Concatenation. 61IF (conditional) . 62LEN . 62FIND . 62LEFT . 63RIGHT . 63TRIM . 63ROW and COLUMN. 64TEXT . 64UPPER, LOWER, and PROPER . 65AND and OR . 65ISERR and ISNUMBER . 66Parting Comments . 66SPSS Reference Manual4Paul Hartzer
SPSS Reference Manual - IntroductionOverviewThis guide presents instructions on how to do basic tasks in SPSS. It is intended forcasual users of SPSS who want to be able to perform specific tasks quickly. SPSS hasmany functions that we don’t typically use in market research. This document is meant tohelp you home in on the functions we do use. The screen shots are from SPSS 15, butthe differences in the menus are minor between that and SPSS 12.What is SPSS?SPSS, the Statistical Package for the Social Sciences, is one of the major statisticalpackages (along with SAS and mTAB, among others). It is used for performing analysison data files, including taking frequencies of responses, filtering data, creating crosstabulations, and weighting. In addition, SPSS can do higher-level statistical analysis.SPSS does have certain limitations, however. Although its processing is far more powerfulthan Excel, its output is difficult to customize. When working with output, it is typical tocopy SPSS output into Excel for formatting to make it presentable to people less familiarwith SPSS.User InterfacesThere are two interfaces in SPSS: The GUI (Graphical User Interface), which is the menusystem that Windows users are most familiar with from other software, and syntax files.Nearly everything in SPSS can be done either through the GUI or through syntax. Whilethe choice can often be a matter of personal taste, each has its strengths. Here are someguidelines.When to use the GUIThe GUI has the following advantages: It’s easier to learn than syntax. For simple actions, it’s faster because there’s less typing.When to use syntax filesSyntax files are best used when you want to: Repeat the same steps multiple times, or on multiple files. Remember how a report was generated, for future reference.Pasting commandsIn reality, SPSS performs its tasks through syntax; the GUI is provided as a conveniencefor the user. As a result, SPSS provides a simple way to do create most syntax: Throughthe Paste button, which is available on most menus.SPSS Reference Manual5Paul Hartzer
As you begin to use SPSS, it’s important to keep an eye towards using the Paste buttonto save your steps. When you click the Paste button, SPSS places the syntax for whatyou’re doing into a file rather than running it. This is the best of both worlds: It allowsyou to set up what you want to do in the GUI, and then generate a syntax file on the fly.Using this guideThis guide is divided into two sections.The first section is an overview of the basic functions most commonly used in SPSS,showing both the GUI and the syntax method for each task (except when only one routeis available). Use the method you’re most comfortable with. Also note there may be otherways to perform some of these tasks. Each task assumes that you’ve already openedSPSS and closed the opening dialog wizard.The second section provides a listing and some examples of the SPSS syntax commandsmost commonly used in loading, cleaning, and saving data, as well as information onhow to leverage Excel’s string formulas for building syntax files. You can use these as abuilding block to extrapolate towards your own needs, as you become increasinglycomfortable with SPSS.The two sections are designed to be somewhat independent of each other. Depending onyour current comfort level, you can start with either.SPSS Reference Manual6Paul Hartzer
The main SPSS interfaceThe main SPSS window shows the data set, and has two views: the Data View and theVariable View. The Data View shows the actual data; it resembles Excel, except that thecolumn headers are the names of the variables.The Variable View lists the variables, including their names, their values, and otherinformation.SPSS Reference Manual7Paul Hartzer
Customizing the GUICertain aspects of the GUI can be customized. To get to the dialog box, click Edit andselect Options . Here is some information about the more useful settings.General tabVariable Lists are the lists of variables that appear in various GUI dialog boxes. Labels aremore descriptive than names. Generally, sorting the variables alphabetically will makethem easy to find.The Session Journal keeps information about processing, including errors, encounteredduring a session. This is useful if you’re experiencing an error you can’t figure out usingthe output alone, but most users will never use the journal.Output Labels tabPivot Table Labeling shows whether names, labels, or both are going to be shown. Ifyou’re going to be doing your analysis in SPSS, choose both; if you’re going to becopying tables into Excel, choose Labels.Other tabsThe other tabs allow you to further customize how the output looks. Avoid modifying theScripts tab unless you’re an advanced user.SPSS Reference Manual8Paul Hartzer
More about syntax filesSyntax files have certain formatting rules that might seem odd to people withoutprogramming experience. However, they’re easy to learn.Many SPSS key words have abbreviations. For instance, VAR and VARIABLE areinterchangeable.The width of a space is generally irrelevant to SPSS (with some important exceptions).One space, ten spaces, even a line break: All of these are interpreted the same, as asingle space. For this reason, all SPSS commands MUST end in a period.The exceptions to this rule: Within quoted information, all spaces are kept. 'Buick'Buick Lucerne' are not the same. Periods should be followed by line breaks; multiple commands can’t be puton the same line, even if they’re separated by spaces. When files are “included,” the first column of each line other than the firstone of a command has to be a space.Lucerne' andOutside of quotation marks, SPSS doesn’t distinguish between lower and upper case. Forexample, EXECUTE, execute, and Execute are all interpreted the same way. This isalso true for variable names.Either single or double quotation marks can be used for text. However, the same symbolmust be used on each side of the text. "Buick Lucerne" and 'Buick Lucerne' are the same. "Buick Lucerne' causes an error.Also keep in mind that if text contains an apostrophe, it might cause a problem. Bestpractice is to remove these apostrophes, but if that’s not feasible, use the other mark. 'I don't like this feature.' causes an error. Use 'I dont like this feature.' or "I don't like thisfeature." instead.To break a line of text onto two lines, use at the end of the first line.Comments are indicated by /* Comment */ or by * at the beginning of a line.SPSS Reference Manual9Paul Hartzer
SECTION 1: OVERVIEWSPSS Reference Manual10Paul Hartzer
FILE HANDLINGSPSS Reference Manual11Paul Hartzer
Opening an existing SPSS datafileGUI method1. On the menu, select File.2. Select Open Data 3. Using the standard Open File wizard, find thefile that you want to open.4. Select Open.Syntax methodGET FILE ' filename, including directory '.Example:GET FILE 'C:\Documents and Settings\User\My Documents\' 'Feb Inter.sav'.SPSS Reference Manual12Paul Hartzer
Opening an existing syntax fileGUI method1. On the menu, select File.2. Select Open Syntax 3. Using the standard Open File wizard, find thefile that you want to open.4. Select Open.Syntax method(N/A)SPSS Reference Manual13Paul Hartzer
Creating a new SPSS datafileGUI method1. On the menu, select File.2. Select New Data.Syntax methodNEW FILE.Creating a new syntax fileGUI method1. On the menu, select File.2. Select New Syntax.Syntax method(N/A)SPSS Reference Manual14Paul Hartzer
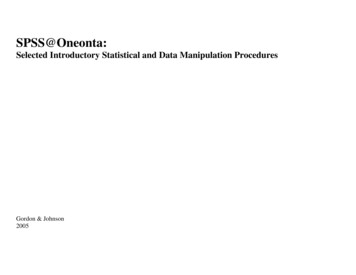
Loading an existing flat ASCIIdatafile (advanced)GUI method1. On the menu,select File.2. Select Open Data 3. Select All Files inthe Files of type:drop-down.4. Using the standardOpen File wizard,find the file thatyou want to open.5. Select Open.6. In step 1, select No andclick Next .SPSS Reference Manual15Paul Hartzer
7. In step 2, select Fixedwidth and No and clickNext .8. In step 3, make surethe first two values are1, and select All of thecases. Click Next .SPSS Reference Manual16Paul Hartzer
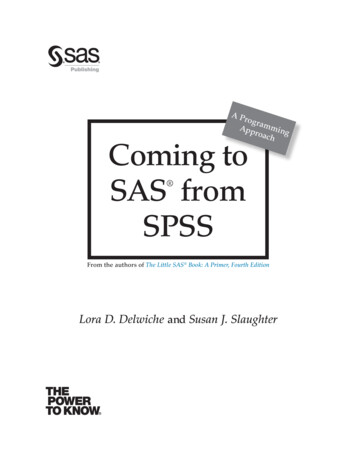
9. In step 4, move,create, and removesolid lines to markoff your data, usingthe data mapassociated with thefile you're loading.Click Next .10. In step 5, name thevariables, anddelete any youdon’t want to load.(Hint: This can bedone later in theGUI, where it'll beeasier.) Click Next .SPSS Reference Manual17Paul Hartzer
11. In step 6, check Yes or No as desired in the first two boxes, then click Finish.Syntax methodNote: If you use Paste in step 11 of the GUI Method, you will get syntax that is differentfrom this (see “notes” below).DATA LIST FILE ' filename, including directory ' / Variable1 15.Example:DATA LIST FILE "\\Ndtsnt-fs--164\CSG\Chevrolet AWGL.asc"/RESPID 8-10ADCODE 1-7 (A)LANGUAGE 450.Notes:This is for data where there is one row per respondent; loading data from card formattedfiles (multiple rows per respondent) is more difficult, and is not covered in this section.If you paste, you will get the GET DATA command instead. GET DATA offsets thecolumns by 1, so ADCODE in the example would be in 0-6 instead of 1-7. This can beconfusing, and is best avoided.(A) in the syntax indicates that the variable is text, instead of a number.SPSS Reference Manual18Paul Hartzer
Merging multiple files – Adding respondentsThis is done when you have two files that have the same variables for differentrespondents.GUI method1. Open one of the files involved.2. On the menu, select Data.3. Select Merge Files Add Cases 4. Using the standard Open File wizard, find the filethat you want to merge in.5. Select Open.6. On the left are any variables that are only in oneof the files. (*) indicates that thevariable is only in the file from step1; ( ) indicates that the variable isonly in the file from step 5. If youwant to include any of thesevariables, move them to the rightwith the arrow button.7. On the right are the variables thatwill be merged. If you want toexclude any of these, move them tothe left with the arrow button.8. Ignore the check box.9. Click OK.SPSS Reference Manual19Paul Hartzer
Syntax methodIn this case, the syntax allows more flexibility than the GUI. For instance, if you want tomerge one file into a file that’s already open, do this (the merged file will contain allvariables from both files):GET FILE ' first filename, including directory '.ADD FILES /FILE */FILE ' second filename, including directory '.Do this if you want to create a new file consisting of multiple files:ADD FILES /FILE ' first filename, including directory '/FILE ' second filename, including directory '/FILE ' third filename, including directory '.If you want to drop specific variables, use the /DROP command:ADD FILES /FILE ' first filename, including directory '/FILE ' second filename, including directory '/DROP varname1 varname2.If you only want to include a small number of variables, use /KEEP instead of /DROP.SPSS Reference Manual20Paul Hartzer
Merging multiple files – Adding variablesThis is done when you have two files that have different variables for the samerespondents.GUI method1. Open one of the files involved.2. On the menu, select Data.3. Select Merge Files Add Variables 4. Using the standard Open File wizard, find thefile that you want to merge in.5. Select Open.6. On the left are any variables that are only in one of the files. (*) indicates thatthe variable is only in the file from step 1; ( ) indicates that the variable is onlyin the file from step 5. If you want to include any of these variables, move themto the right with the arrowbutton.7. On the right are the variablesthat will be merged. If youwant to exclude any of these,move them to the left withthe arrow button.8. The default is to merge filesone-to-one: The first recordswill be combined, then thesecond, and so on. If this iswhat you want to do, skipstep 9.9.SPSS Reference Manual21Paul Hartzer
More often, though, you’ll want to merge based on a specific variable, such asrespondent ID. To do this, click on Match cases on key variables in sorted files,and then move the variable to the Key Variables box.a. IMPORTANT NOTE:The two files must besorted on this variable.Otherwise, you’ll get anerror.b. If there are unmatchedrecords (one filedoesn’t containinformation on thesame respondents),choose whether toinclude all respondentdata, or only data forrespondents from onefile.10. Click OK.11. If you are matching cases, click OK to the warning message.12. When asked if you want to save the contents of the data file, say no.Syntax methodNote that the command here is different. Instead of ADD, it’s MATCH. If you just want tomatch one-to-one (as in step 8 above), don’t include the /BY line.GET FILE ' first filename, including directory '.MATCH FILES /FILE */FILE ' second filename, including directory '/BY match variable .As with ADD, MATCH allows you to specify more than two files.SPSS Reference Manual22Paul Hartzer
Saving an SPSS datafileNote that when you close SPSS, you will be prompted to save any unsaved files.GUI method1. On the menu, select File.2. Select Save (or Save As ).3. Using the standard Save File wizard, find the directory andname the file.4. Select Save.Syntax methodSAVE OUTFILE ' filename, including directory '.Use /DROP to exclude some variables from the save (VAR1 and VAR2 won’t be saved):SAVE OUTFILE ' filename, including directory ' /DROP VAR1 VAR2.Use /KEEP to only save specific variables (VAR1 and VAR2 will be the only variables inthe file):SAVE OUTFILE ' filename, including directory ' /KEEP VAR1 VAR2.Hint: If you want to change the order of the variables in the file, use /KEEP and list allthe variables in the file, in the order you want them in.Saving a syntax fileNote that when you close SPSS, you will be prompted to save any unsaved files.GUI method1. From the syntax window, on the menu, select File.2. Select Save (or Save As ).3. Using the standard Save File wizard, find the directory and name the file.4. Select Save.SPSS Reference Manual23Paul Hartzer
Syntax method(N/A)Exporting SPSS data to ASCIIGUI method1. On the menu,select File.2. Select Save As .3. Using thestandard SaveFile wizard, findthe directory andname the file.4. Select FixedASCII (*.dat)from the Save astype drop-downlist.5. Select Save.Syntax methodWRITE OUTFILE ' filename, including directory ' /ALL.If you only want to keep certain variables, list them instead of using /ALL:WRITE OUTFILE ' filename, including directory ' /RESPID VAR1VAR2.SPSS Reference Manual24Paul Hartzer
DATA MANIPULATIONSPSS Reference Manual25Paul Hartzer
The SPSS status barAt the bottom of the SPSS data window, there is a series of rectangles. From left to right,these tell you: The status of the SPSS processoro The status message is useful if you’re running a request that’s taking along time, especially if you’re running a long syntax file. It will tell youwhat command SPSS is currently working on.Whether there are transformations pending.oWhen you’re running a syntax file, some commands don’t get applied tothe data right away. If that’s the case, there will be TRANSFORMATIONSPENDING. SPSS uses the word “transformations” to refer to any changeto the data file, such as weighting, filtering, new variables, sorting, andso on.oTo process all pending transformations, use the EXECUTE command. Forexample:WRITE OUTFILE ' filename, including directory ' /ALL.EXECUTE.oIf you want to cancel the pending transformations, use CLEARTRANSFORMATIONS. Whether the data is filtered (FILTER ON or blank).Records that are excluded from the current filter aremarked with a diagonal line in their row listing. Whether the data is weighted (WEIGHT ON or blank).SPSS Reference Manual26Paul Hartzer
Weighting: Turning onGUI method1. Click on the scale button.*2. Select “Weight cases by.”3. Select the variable you want to weight on.4. Click on the right arrow.5. Click OK.Syntax methodWEIGHT BY VAR1.Weighting: Turning offGUI method1. Click on the scale button.*2. Select “Do not weight cases.”3. Click OK.Syntax methodWEIGHT OFF.Weighting: ChangingGUI method1. Turn off the previous weight.2. Turn on the new weight.Syntax methodWeighting by a new variable will automatically turn off the previous weight.WEIGHT BY VAR1.SPSS Reference Manual27Paul Hartzer
* Note:If the Scale button is not present, click Data on the menu and choose Weight cases .FilteringGUI method1. Click on the yellow highlighted grid button.*2. Click on “If condition is satisfied” and then If .3. Build your filter in thebox at the upper right.SPSS Reference Manual28Paul Hartzer
This can be done by selecting variables and the buttons below, or by typing directlyin the box (or some combination of both). Here are some examples:a. If you want all men over the age of 40, the filter might be GENDER 1AND AGE 40b. If you want everyone who either makes between 50,000 and 100,000or who lives in Detroit, the filter might be (INCOME 50000 ANDINCOME 100000) OR CITY 14 (where 14 is the city code forDetroit).c.If you want to find everyone who gave a response to the race question,the filter might be NOT MISSING(RACE)4. For the most part, the functions the casual user will implement in filters area. AND, OR, NOTb. , , , , , (or )c.MISSING(). MISSING() is used to find out if a particular record has datafor a particular variable.5. If you need to know what values a variable has, right click on the name in thevariable list and pick Variable Information.6. Decide if you want to filter ordelete unwanted records:a. Filtering: If you’re justfiltering for an analysis,select Filtered underUnselected Cases Are.b. Deleting: If you want todelete records from thedata file, select Deletedinstead. Only do this ifyou want to permanentlyalter the data file.7. Once you’ve created the filter youwant, click OK.8. To turn off a filter, repeat step 1,and then pick All Cases and clickOK.SPSS Reference Manual29Paul Hartzer
Syntax methodFiltering for analysis (keep the unselected records in the datafile):COMPUTE filter ( filter definition ).FILTER BY filter .For instance, example 3a would be:COMPUTE filter (GENDER 1 AND AGE 40).FILTER BY filter .Note that filter can be any valid variable name. What this does is create a new variablethat is 1 if the record satisfies the case and 0 if it doesn’t.Deleting records with a filter (delete the unselected records from the datafile):SELECT IF ( filter definition ).For instance, example 3a would be:SELECT IF (GENDER 1 AND AGE 40).Note that filter can be any valid variable name.Turning the filter off:USE ALL.* Note:If the Grid button is not present, click Data on the menu and choose Select cases .SPSS Reference Manual30Paul Hartzer
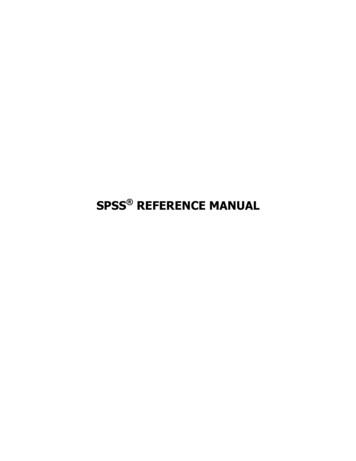
RecodingRecoding has two main purposes: Modifying or correcting a scale in a variable. Creating a new variable that combines multiple values of an old variable(such as creating an “age group” variable from a numeric age).When recoding, using the syntax method is usually less difficult than using the GUImethod. However, both are included here.GUI method1. On the menu, select Transform.2. If you want to recode existing variables, pickRecode Into Same Variables . Otherwise, pickRecode Into Different Variables .3. Chose the variables to recode and click the rightarrow. Whatever recodes you specify will be doneto all variables.4. If you’re creating new variables, enter their namesand labels in the Output Variable box and clickChange.5. To create a recoding condition, click Old and New Values. A new dialog box willopen (see next page).6. In the new dialog box, specify a value or, if you want to recode a range (say, 0to 30), click Range and enter the range.7. For the new value, enter a value.SPSS Reference Manual31Paul Hartzer
8. Click Add.9. Continue 6-8 for all recodes. If you want to just copy all the rest of the valueswithout changing them, click All Other Values and Copy Old Value(s). Make sureto add each condition.10. When you’re done, click Continue.11. If you want to specify a condition for your recode (for instance, you want tomake the respondent gender 1 if the head of household 1), you can createthat condition by clicking on If . See Filtering above for information on how tobuild filters.12. Click OK.SPSS Reference Manual32Paul Hartzer
Syntax methodTo recode Var1, Var2, and Var3 into new variables:RECODE Var1 To Var3 (oldval newval)(ELSE COPY) INTO Vara1 ToVara3.If the variables after the INTO portion don’t exist, SPSS will create them. To use thesame variables, leave off the INTO portion:RECODE Var1 To Var3 (oldval newval)(ELSE COPY).To blank out a value, recode into SYSMIS:RECODE Var1 To Var3 (oldval SYSMIS)(ELSE COPY).To recode a range:RECODE Var1 To Var3 (oldval1 thru oldval5 newval)(ELSE COPY).For instance, say you have an age variable that you want to convert into an age groupvariable. These are the rules: If the respondent is younger than 16, blank out the age. Group 1 is 16-34. Group 2 is 35-54. Group 3 is 55-99.This would be the syntax:RECODE AGE (16 thru 34 1)(35 thru 54 2)(55 thru99 3)(ELSE SYSMIS) INTO AGEGROUP.As a second example, say you’ve learned that two of the values were reversed at thethird panel company. 2 should have been “Black” and 3 should have been “Asian,” but itwas the other way around at that panel company only. The recode syntax would be:RECODE RACE (2 3)(3 2)(ELSE COPY).However, to limit it to just the panel company in question, use the DO IF structure:DO IF (PANEL 3).RECODE RACE (2 3)(3 2)(ELSE COPY).END IF.SPSS Reference Manual33Paul Hartzer
DATA ANALYSISSPSS Reference Manual34Paul Hartzer
OverviewSPSS offers a wide variety of analytical tools. However, for the vast majority of basicmarket research data processing, we only use three: Frequencies (aka “freqs” or “counts”), a simple distribution of howrespondents answered a single question. Basic cross-tabs, a comparison of one question vs. another. Advanced cross-tabs, where we construct a banner (column heading) orstub (row heading) from multiple questions.Cross-tabs also often have layers, a third dimension. For instance, if we wanted tocompare how men and women differed in time intention, and were interested in whetherthere’s a difference between panel companies, we would put the panel company in alayer.SPSS Reference Manual35Paul Hartzer
FrequenciesGUI method1. Make sure that your desired weightand filter are turned on (or off).2. On the menu, select Analyze.3. Select Descriptive Statistics Frequencies.4. In the dialog box, select the variables you want to look at and click on the arrowbutton.5. If you want statistics other than counts, such as mean, median, or standarddeviation, click on the Statistics button and make your selections. (Close thedialog with Continue.)6. Click OK.Syntax methodThe basic command is:FREQUENCIES VAR Var1 Var2.To also include statistics in the report, use the /STATS subcommand:FREQUENCIES VAR Var1 Var2 /STATS MEAN MEDIAN STDDEV.For instance, to get an unweighted count of respondents by age, including the medianage, this would be the syntax:WEIGHT OFF.FREQUENCIES VAR AGE /STATS MEDIAN.SPSS Reference Manual36Paul Hartzer
Basic cross-tabsThis technique will allow you to do basic datacomparisons. For most basic, quick analysis, this isthe quickest method. A drawback is that theresulting output is not as customizable as moreadvanced cross-tabs are.GUI method1. Make sure that your desired weight andfilter are turned on (or off).2. On the menu, select Analyze.3. Select Descriptive Statistics Crosstabs.4. In the dialog box, select the variablesyou want in the rows and columns.Note that variables will not be nested.That is, if you select two columnvariables (var1 and var2) and two rowvariables (var3 and var4), SPSS willoutput four
SPSS Reference Manual 5 Paul Hartzer SPSS Reference Manual - Introduction Overview This guide presents instructions on how to do basic tasks in SPSS. It is intended for casual users of SPSS