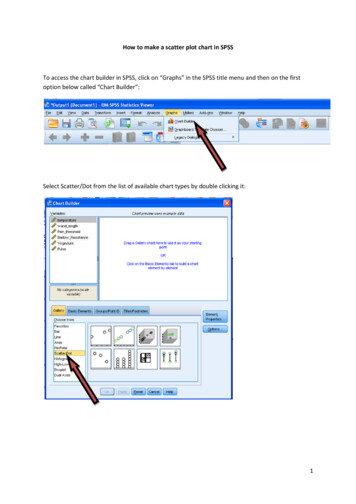
Transcription
INTRODUCTION TO SPSSPART I . 2INTRODUCTION. 2Background . 2Data Entry. 4Defining Variables . 4Variable and Value Labels . 7Entering Data. 9FILE MANAGEMENT . 11Saving an SPSS for Windows 7 File . 11Backing Up Your Data . 12Retrieving Data Files . 12DESCRIPTIVE STATISTICS . 13Frequency Tables . 13Descriptives . 15Cross-tabulation . 16Three-way tables . 18EDITING AND MODIFYING THE DATA. 19Inserting Data . 19Deleting A Case. 19Inserting A Variable . 20Deleting A Variable . 20Moving A Variable . 20PART II . 21CONSTRUCTING NEW VARIABLES . 21Computing a New Variable . 21Computing a New Variable by using built-in Functions . 22Computing Duration of Time Difference by built-in Functions . 23Recoding a value . 24Selecting a Subset of the Data . 26GRAPHICS . 28Bar Charts . 28Histograms . 29Scatter Plots . 30Plotting a Regression Line on a Scatter Plot . 31STATISTICAL INFERENCE IN SPSS . 32Introduction . 32Categorical Variable . 32The Chi-squared test and Fisher’s Exact test . 33CONTINUOUS OUTCOME MEASURES . 35Comparison of Means Using a t-test . 37LINEAR REGRESSIONS . 40Model Checking . 41NON-PARAMETRIC METHODS . 43COMPARISONS OF RELATED OR PAIRED VARIABLES . 45Continuous Outcome Measures . 46Analysis of Binary Outcomes that are Related . 47Related Ordinal Data . 48LOGISTIC REGRESSIONS . 48Model Checking . 50SURVIVAL ANALYSIS . 51READING AN EXCEL FILE INTO SPSS . 54CREATING A SPSS SYNTAX . 56SPSS Version 23.0 15/03/2017
PART IINTRODUCTIONBackgroundThis handbook is designed to introduce SPSS for Windows. It assumes familiarity with Microsoftwindows and standard windows-based office productivity software such as word processing andspreadsheets.SPSS for Windows is a popular and comprehensive data analysis package containing a multitudeof features designed to facilitate the execution of a wide range of statistical analyses. It wasdeveloped for the analysis of data in the social sciences - SPSS means Statistical Package for SocialScience. It is well suited to analysing data from surveys and database.The practical uses dataset from a cross-sectional survey of respiratory function and dust levelsamongst foundry workers. The object of the survey data was to determine whether the dust levelsfound in the foundries have any effect on the respiratory function.Acquiring the DATAA number of datasets have been created to enable you to work through this guide. These can befound online or via the ‘Shared Data’ folder. To access click the Start button in the bottom lefthand corner and type - shared data – and press enter, the window explorer will open and thendouble click: mhs health methodology course data We suggest you copy and paste foundry.sav, foundry.xls, and foundrysyn.SPS to your desktop.To access the data online click the stics/teaching/statisticalsupportand download the relevant SPSS handouts and above datasets to your desktop. You may at somepoint be asked for your username and password.Note: for further information this booklet where possible will link you to a relevant Youtube videoexplaining the technique discussed.SPSS Version 23.0 15/03/20172
Starting SPSSAfter logging on to Windows 7, the user will be presented with a screen containing a number ofdifferent icons. Start SPSS by clicking the Start button then selectingAll ProgramsIBM SPSS StatisticsIBM SPSS Statistics 23.0Then the SPSS 23.0 for Windows 7 screen will appear called Untitled – SPSS Data Editor(shown below). In the middle of the Data Editor screen you can see another window with thefollowing options New Files – Create a new dataset Recent Files – Open a previously used dataset What’s New – Learn about new features in SPSS 23.0 Modules and Programmability – Links to help menus for advanced users Tutorials – Beginners guides to features in SPSS 23.0Click, the New Dataset within the New Files option, to get a blank SPSS data screen and themaximise your SPSS window.SPSS Version 23.0 15/03/20173
Data EntryThe SPSS Data Editor screen looks like a spreadsheet but there are some important differences.Each row represents the data for a case. A case could be a patient or a laboratory specimen. It couldalso be a set of results for a patient at a particular time. Each column represents a variable. Avariable could be the answer to a question or any other piece of information recorded on each case.Before you enter any data in the spreadsheet you have to create a variable for the information youhave collected. You must define a variable for each question in your data set you plan to analyse.Defining VariablesIf you look at the left hand corner at the bottom of the SPSS Data Editor screen, you will see twosmall tabs labelled: Data View and Variable View. To create a new variable click on VariableView and the following screen will appear.Each row describes the attributes of one variable. Begin by entering a variable name in the Namecolumn. A variable name can be up to 64 characters long, must contain no spaces, and should besomething meaningful. It is best to stick to alphanumeric characters and start with a letter. Once youhave entered a name, SPSS defines the variable type as Numeric. You may need to change thevariable type, to e.g. String if you wanted to use text such as names, or to Date if you want to enterdates. To do this, click on the cell within the Type column. A little combo button will appear on theright hand side, click the button and the following screen will appear.SPSS Version 23.0 15/03/20174
You will usually be working with one of Numeric, Date or String type of data. For Numericvariables you may want to change the decimal places. If the data are integers (whole numbers) suchas age in complete years you could alter the decimal places to zero. If the numbers you are planningto enter are very small (0.00072) or you require a high level of precision (21.7865) you may want toincrease the number of decimal places. Usually there is no need to change the width from 8, notethat width must be larger than the number of decimal places. For a date variable it is best to use a 4digit year (dd.mm.yyyy)With text strings you are given the option to change the number of charactersSPSS Version 23.0 15/03/20175
Where possible you are strongly advised to use numerical coding rather than strings as this makesstatistical analysis easier. If you are entering string data that is longer than 8 characters, you willneed to increase the Width from the default of eight. To be able to fully display the string in thedata view window you may need to increase the numbers of columns in the variable view window.The column missing in the variable view window allows you to define codes that identify a missingvalue. You can have several values allowing you to distinguish between types of missing data dueto the respondent forgetting to answer rather than say not applicable or refused to answer. Forexample, a code of -88 could indicate not applicable, and -99 could indicate the respondent hadmissed a question out. If a value is defined as a missing value code for a particular variable, subjectswith that code will be dropped from the analysis of that variable.To set up missing value codes for a variable, click on a cell followed by the grey square within theMissing column as you did with Type. Click Discrete missing values and enter the values torepresent missing in the boxes below (Up to 3 can be entered). To complete the entry press OKSPSS Version 23.0 15/03/20176
Variable and Value LabelsThere are two types of labels in SPSS. A variable label, given to a variable gives a clearerdescription of the variable and will be displayed on the statistical output such as graphs and tables.The second, a value label allows you to describe each of the values in a variable. These labels willbe displayed on tables improving readability. For example, Exposure group in the followingpractical has two values “Unexposed” and “Exposure to dust” which are coded as “0” and “1”. Thelabel option in the variable view window also allows you to define labels for missing values.To define a variable label click the cell within a Label column screen and enter your description ofthe variable.To define Value Labels - click the cell of the value column and then the click on the combo buttonto the right, then enter the Value and its associated label then press Add. The added label will thenappear in the window below.Once you have entered all the value labels for a variable press OK.SPSS Version 23.0 15/03/20177
Exercise The table below lists the example variables from the foundry study. Set-up the followingvariablesVariableNameidnogroupDescription (Variable Label ) Missing Data CodeIdentification NoExposure GroupValue Labels for each code1 Exposed to dust0 UnexposedagesexAge at assessmenthtHeight in cmsasthmaEver had asthmabronEver had BronchitissmknowDo you smoke nowsmkeverHave you ever smokedcignoNo of cigarettes per day-88cigyrsNo of years smoked-880 female1 maleSPSS Version 23.0 15/03/20170 No1 Yes2 Don’t Know0 No1 Yes2 Don’t Know1 Yes0 No0 No1 Ex smoker2 Current smoker8
Entering DataWhen you finish creating all the variables, you enter the Data View and the following screen withall the variable names at the top of the spreadsheet.You can now enter the data as you would in an excel spreadsheet. To make an entry in a particularcell on the spreadsheet use the mouse to move the cursor to select that cell and type in the value.The value will appear in the cell. Click on the mouse, press enter or use the cursor keys to enter thatvalue.If you attempt to enter data of the wrong type into a variable (for example text into a numericvariable) the data will not be accepted. If incorrect data is entered, it can be overtyped or deleted.Video Tutorial – Setting up a dataset and entering datahttps://www.youtube.com/watch?v MoKDcPpRa 0SPSS Version 23.0 15/03/20179
ExerciseThe data below are some variables from the foundry study for which you have just entered the variable codes. If you leave a gap in any cell in theworksheet, SPSS will put a dot (.) and treat it as missing data. To enter the cases, either type the number corresponding to the value label oralternatively display the Value Labels of the coded values. These are displayed by using choosing value labels buttonoptions at the top of either the Data view or Variable View window.IdnoSPSS Version 23.0 15/03/2017group age SexHtasthmabron smknow smkever cigno cigyrs1001 Exp.49Female 175 NoNoYesCurr20311002 Exp.46Female 168 YesNoYesCurr20111003 Non34Female 180 NoNoNoNever1004 Non34MaleNoYesCurr2516180 No10from the second row of
FILE MANAGEMENTSaving an SPSS for Windows 7 FileOnce you have entered some data you should save the file. It is good practice to save data at regularintervals during data entry just in case.To save the data you have just entered, click the File at the top left corner of the screen and then theSave As. sub-option.Something similar to the following screen will appear:Save a copy of the current SPSS for Windows 7 file on your P: Drive or your pen drive, underDrives: click on 7 in the Look in window to generate a list of the drives.Click on the up/down-arrows to move to the relevant pen drive and enter a suitable name in theFile name window. By default SPSS will add the file extension .sav in order to help identify thefile as a SPSS data file. Finally, click on the Save button.SPSS Version 23.0 15/03/201711
Backing Up Your DataIt is good practice to save data on different disks and also several names as data entry progresses(e.g. mydata1 mydata2 etc). To make a backup copy of your data repeat the Save Data Asprocedure.Retrieving Data FilesRetrieving an SPSS for Windows 7 File is essentially the reverse of the save process. Click on theFile option, then the Open sub-option followed by the Data option. Something similar to thefollowing screen will appear. Then retrieve the required file from the saved location.We can also open a data file when we as start an SPSS session (see above).SPSS Version 23.0 15/03/201712
DESCRIPTIVE STATISTICSFor the next stage you need to retrieve the data file foundry.sav which contains the fully labelleddataset you saved earlier to your desktop (see page 2). The open your data in SPSS as you would inany other package click File, Open, Data and retrieve your data from your workspace.The first step in data analysis is to generate descriptive statistics. This will give us a feel for thedata. It will also help identify any inconsistencies that may be in the data. This is sometimes calleddata cleaning. Techniques that are commonly used to do this include:Frequency AnalysesDescriptive StatisticsCross-tabulationsPlotsFrequency TablesCarrying out a frequencies analysis on variables is the first step when checking for data errors, clickon Analyze and choose the Descriptive Statistics option and then choose Frequencies. Move thevariables of interest into the Variables box on the right-hand side, and then click Statistics to selectsome summary statistics such as range, maximum, minimum, mean and median, which will helpyou look for errors.SPSS Version 23.0 15/03/201713
The following screen will appear.To select the variable to perform a frequency table for example the Exposure group variable, clickon its name in the left hand list and then press. Finally click on OK and the following output isthen generated in the output window.Exposure GroupFrequencyValidPercentValid osure to Dust7353.753.7100.0136100.0100.0TotalTo return to the data editor click o
SPSS Version 23.0 15/03/2017 3 Starting SPSS After logging on to Windows 7, the user will be presented with a screen containing a number of different icons. Start SPSS by clicking the Start button then selecting All Programs IBM SPSS Statistics IBM SPSS Statistics 23.0
