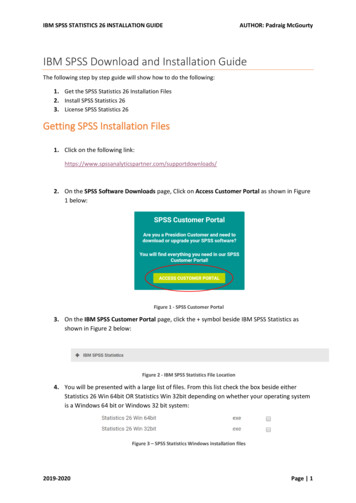
Transcription
SPSS@Oneonta:Selected Introductory Statistical and Data Manipulation ProceduresGordon & Johnson2005
SPSS@Oneonta: Selected Introductory Statistical and Data Manipulation ProceduresThis manual was donated by the authors to support the James A. Fraley Scholarship Fund.Authors:Lisa A. Gordon, Adjunct Lecturer: Statistics, Department of Mathematics, Computer Science & Statistics, SUNY OneontaSteven D. Johnson, Senior Staff Associate, Institutional Research, Division of Finance & Administration & Adjunct Lecturer: Statistics, Department of Mathematics,Computer Science & Statistics, SUNY OneontaComments & Suggestions:Comments and suggestions may be forwarded to: GORDONLA@ONEONTA.EDU or JOHNSOSD@ONEONTA.EDU.James A. Fraley Scholarship:This manual was donated to support the James A. Fraley Scholarship at the SUNY College at Oneonta. All donations aid in the growth of the scholarship’s endowment.The Fraley scholarship assists students majoring in the field of statistics at SUNY Oneonta. For information about the Fraley Scholarship contact the Department ofMathematics, Computer Science & Statistics, 238 Fitzelle Hall, SUNY, Oneonta NY 13820 (607-436-3708).Printing:First Edition: July 2001; Second printing August 2002. Second Edition: July 2005Disclaimer:This document is intended for the use by students in STAT 101: Introductory Statistics and STAT 141: Statistical Software – SPSS; both are courses offered at SUNYOneonta. It is not intended to be a comprehensive documentation of all that SPSS can provide with regard to a particular statistic or test. The content of the documentmay change as needed to meet its function as a supplemental reference for STAT 101/141. No living trees were harmed in the printing of this manual.Copyright:Copyright 2001, 2005 by the authorsFew rights reserved. Any part of this publication may be reproduced for educational purposes provided that appropriate credit is given to its authors and SPSS, Inc. Useon the SUNY Oneonta campus must be coordinated through the authors and the Department of Mathematics, Computer Science & Statistics.SPSSTM is a trademark of SPSS, Inc. The inclusion of SPSS Statistical Software input and output contained in this manual was accomplished using screen shots takenfrom SPSS version 13.0. For additional documentation, FAQ’s, etc. go to the SPSS web site at http://www.spss.com.1
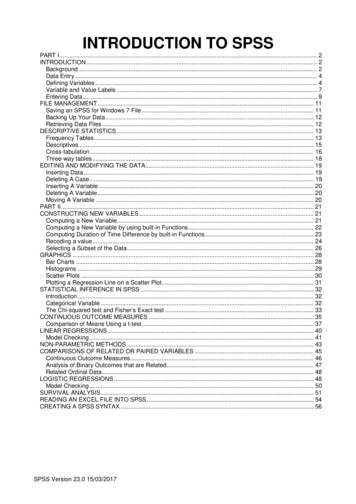
TABLE OF CONTENTSTABLE OF CONTENTS . 2INTRODUCTION . 5SPSS ENVIRONMENT:GETTING STARTED WITH SPSS. 8THE INITIAL SPSS WINDOW. 9ENTERING DATA INTO A NEW DATA FILE. 10RETRIEVING A SAVED FILE . 11SAVING YOUR WORK . 12SPSS WINDOWS. 13SPSS FILE EXTENSIONS . 14HELP . 14SPSS PROCEDURES:ANALYSIS OF VARIANCE (ANOVA) . 18BAR CHART. 20BINOMIAL PROBABILITIES . 24BOXPLOT (BOX-AND-WHISKER PLOT) . 27CHI-SQUARE (χ2). 29CONFIDENCE INTERVAL FOR A POPULATION MEAN. 32CONFIDENCE INTERVAL FOR A POPULATION PROPORTION . 33CROSSTABS (A.K.A. CONTINGENCY TABLES) . 342
DESCRIPTIVE STATISTICS. 37DOTPLOT. 39FIVE-NUMBER SUMMARY. 40FREQUENCY POLYGON/AREA GRAPH . 41FREQUENCY TABLES . 42HISTOGRAM . 43HYPOTHESIS TEST FOR A POPULATION MEAN . 44HYPOTHESIS TEST FOR A POPULATION PROPORTION. 46INTERACTIVE GRAPHS. 48LINE GRAPH . 51LINEAR CORRELATION. 52LINEAR REGRESSION. 53MULTIPLE RESPONSE . 55NORMAL PROBABILITIES. 60NORMAL PROBABILITY PLOT. 61OGIVE . 62PARETO CHART . 63PIE CHART . 64SCATTERPLOT. 66SIMPLE RANDOM SAMPLE (SRS) . 67STANDARDIZED SCORES (OBTAINING Z-SCORES) . 68STATISTICS & CASE PROCESSING TABLES. 693
STEM-AND-LEAF PLOT . 70T-TEST . 71SPSS DATA MANIPLUATION:CHART EDITOR . 73COMPUTE . 80DATA EDITOR . 82DEFINE VARIABLES . 83EDIT MENU . 85EXPORTING TABLES AND CHARTS . 86FILE & VARIABLE INFORMATION . 87INSERT VARIABLE OR CASE . 88MERGE FILES. 89OUTPUT VIEWER . 90PIVOT TABLES . 91RECODE . 92SELECTING CASES . 94SORTING CASES & VARIABLES. 95SPLIT A DATA FILE . 96TABLE EDITOR . 97TEXT FILES . 98APPENDIX A: DATA FILE INFORMATION. 100INDEX . 1054
INTRODUCTIONThis manual is intended as a reference guide to the SPSS statistical software package used by students in the introductory statistics classes at SUNY Oneonta. The manualprovides a "how to" approach to each topic presented. It does not discuss every option available for a given topic, but rather provides sufficient instruction to obtain thebasic output one might need address data analysis at an introductory level. At the same time, this is not a statistics text. Therefore, the user will need to refer to a statisticstext for definitions and further clarification of the procedures presented herein.DOCUMENT OVERVIEWMost topics are presented on no more than two pages and include: a brief OVERVIEW of the topic; a summary listing of the STEPS to complete the procedure; and, formost topics, an EXAMPLE of how to use the statistical topic, which includes a more detailed presentations of the steps. Within each procedure’s Example, SPSS screenshots show how to access and complete the desired SPSS command. SPSS output is presented so that the user may see the results of the command selected. For sometopics the output may be "enhanced" through superimposed notes, which point out various components of the output.CONVENTIONS USED IN THE MANUALThere are a number of conventions or means of presenting information that are constant throughout the manual. As one initiates a SPSS command, a Dialog Box willopen. It is within these Dialog Boxes that one will enter all the information needed to produce the desired output.STEPS: All bold print, indicates all steps needed to successfully complete the minimum requirements for the SPSS command to provide output.OPTIONS: With the selected SPSS command, using the Options noted below the STEPS will provide additional output or enhance the output.ADDITIONAL REQUIREMENTS: For some SPSS features it is necessary to go to a second Dialog Box and enter additional information BEFOREselecting the Ok button.RELATED GRAPHS: For some statistical procedures a reference may be made to a related graph.RELATED STATISTICAL PROCEDURE: For some Tables and Graphs a related statistical procedure may be noted.SUMMARY OF STEPS: For some procedures an expanded, more descriptive presentation of the STEPS is presented for the EXAMPLE.‘VARIABLES’ used in the examples appear in bold, all capital letters within single quotation marks.Dialog Boxes, Cells into which one would enter information and some other actions, such as click OK, are presented in bold lettering.5
ORDERING OF TOPICSThe contents of this manual have been broken into three sections.Section 1: SPSS Environment - provides information on how to get started using SPSS.Section 2: Statistical Procedures - provides an overview of many statistics and graphs encountered in an introductory statistics course.Section 3: Data Manipulation - provides information on many ways to enhance/modify SPSS data files. While these procedures are not necessary to obtain statisticaloutput, they do facilitate data analysis and interpretation.DATAThe data used for examples throughout this manual were selected from sample data files that are distributed with SPSS. They may be accessed from within SPSS usingthe following STEPS: File Open Data set the "Look in:" cell to the folder containing the data file select the desired data file Open. SPSS willenter the data into the Data Editor Window.The data sets used in this manual are noted below. Coding of variable values may be viewed by selecting the “Variable View” tab in the Data Editor. A printout ofvariable coding may be obtained by opening the data file and then using the STEPS: File Display Data File Information Working File. A summary of variablesand their formatting will be placed in the Output Viewer. If you are interested in the formatting of a single variable, use the STEPS: Utilities Variables. The FileInfo printouts for the files noted below are located in APPENDIX A.DATA FILES:Data: Cars.savData: Employee data.savData: Road Construction Bids.savData: World95.sav6
THE SPSS ENVIRONMENT:HOW TO GET STARTED – SPSS BASICS7
GETTING STARTED WITH SPSSWHERE TO FIND SPSS: SPSS can be accessed from virtually any PC-based computer lab on the SUNY Oneonta campus. For a listing of the on-campus computer labs andsoftware availability select the following path from the Oneonta Homepage: Technology Academic Computer Services Labs.HOW TO ACCESS SPSS: The location of the SPSS icon may varyfrom one lab to another. In most cases, it will be located on the desktopin a folder named Mathematics If it is not there look in the GeneralApplications or Student Applications folders.TO START SPSS: Double-click on the SPSS icon (shown in the left figure)and the Data Editor window below will open.SPSS Startup Iconlocated in DesktopMathematics folder8
THE INITIAL SPSS WINDOWWhen starting SPSS the Data Editor window appears with a dialog box containing start-up options. Recently used data files appear in the top listing and other types of recentlyused files, such as output and syntax files, will appear in the bottom listing. If the file desired is not listed or you want a blank Data Editor, select cancel. The Data Editor will beready to receive direct data input or you can use the main menu File Open Data to locate a specific data file. If you select “OK,” SPSS will open the SPSS directorycontaining over 100 sample data files, including most of the files used in this manual.SPSS contains several pre-defined data files for your use. If you wish to select a data file saved in an SPSS subdirectory select OK (this is the default directory). If you wish toopen a file from another location (such as a disk), select cancel and then use the STEPS: File Open Data and direct SPSS to the file’s location (See topic:RETREIVING A SAVED FILE).To select a data file: Click on the data file, then select Open. Alternately, you may double-click on the file of your choice.Data Editor: First window to appear when SPSS is opened.File selection.Recently useddata filesRecently savedoutput and othertype filesSelecting “OK” here will open the SPSS directory, whichcontains sample files provided with SPSS, including filesused in this manual.9
ENTERING DATA INTO A NEW DATA FILEIf you wish to create a new data file, click Cancel in the opening dialog box. The opening dialog box will close, and the worksheet shown behind it will be active and ready foryou to begin entering data and defining variables. Note that there are two tabs at the bottom of the Data Editor window. When the Data View tab is selected one can enterinformation into the window. When the Variable View tab is selected, one can modify information about the file’s variables (see the sections on the DATA EDITOR andDEFINE VARIABLES). In order to change to either view, click on the respective tab in the lower left corner of the worksheet.To begin entering your data, click inside the cell where you will enter your first value. Type in the value, and press Enter on the keyboard. The value will appear in the cell, andyou will be taken to the cell immediately under it. If you wish to enter the values of all variables for one case (instead of all cases for one variable), use the right-arrow key on thekeyboard instead of pressing Enter after entering a value. You will be moved to the next variable for a case. You may move left, right, up or down in Data View by using thearrow keys. If you make a mistake when entering your data, click once in the cell containing the error, and type in the correct value.VARIABLES vs. CASES: A Variable is a single piece of information collected from every unit in the sample or population of interest. They represent the columns in the dataeditor. For example, in the data below there are four variables, Gender, Year, Height, and Month. Each member of this population of ten individuals provided information aboutthe variable Gender. In contrast a Case contains all of the information (variables) obtained from one source. Cases are the rows in the data editor. So here, the first case is anindividual who identified his Gender (2), Year level (So), Height (67.5 in.) and Month (of birth Apr).Data Editor ready for data entry.Data manually entered.10
RETRIEVING A SAVED FILEOption 1: To open a file that is not displayed on the recently used listings of the dialog box that appears when SPSS is started, select the Open another type of file button, asshown on the left below. In the dialog box that will appear, use the pull-down menu to select where the file is located. For example, in the dialog box shown (below left), the Adrive is highlighted. Selecting that drive will result in the computer listing available files on the A: drive. Note that once you have selected the location, you may need to specifythe file type in the Types of Files dropdown box.Option 2: If you have gone beyond the opening screen’s dialog box or want to open a file different from the one currently in the Data Editor or one of the other SPSS windows,use the main menu. STEPS: File Open select a file type select the Location.Selecting a specific file from the opening dialog box if it is not listed:Selecting a file once the opening dialog box has been closed:Other Files11
SAVING YOUR WORKAt Oneonta if you wish to save your work, do not save it to the hard drive (C:) as these drives are periodically updated and student files are erased. Instead, save it on a floppydisk, zip disk, flash drive or your “P:” drive by selecting File from the Main Menu Bar and then using the Save As command.In the dialog box that appears, click once on the down-arrow on the right side of the Save In box. Select the location to which the file is to be saved. In the File Name box, typein a name for your file, then click OK and the file will be saved to the location previously selected.Menu Bar File Save AsSelect a location via the “Save in" dropdown list12
SPSS WINDOWSSPSS is built around a number of windows, each serving a different function. While several windows are noted below, familiarity with the Data Editor and the Output Viewerare sufficient to obtain data analysis. The ability to use the Chart Editor and the Pivot Table Editor will allow one to produce presentation quality tables and charts. CHART EDITOR1: This window allows for the modification of the appearance of graphs and charts. DATA EDITOR1: Usually the entry point for SPSS analysis, this window contains data and editing descriptionsfor individual variables. DRAFT VIEWER: Displays output in simple text rather than as pivot tables. OUTPUT VIEWER1: All data analysis output is maintained in this window. Editing of tables and graphs beginshere. PIVOT TABLE EDITOR1: This window allows for the modification of the appearance of tables. SYNTAX EDITOR: Allows for the use of command syntax in the development of procedures. SCRIPT EDITOR: Allows for the customizing and automation of certain SPSS tasks.Chart EditorSample Windows:Data EditorOutput ViewerPivot Table Editor (note box around table has a “shadow”effect around it)1Each of these four windows is more thoroughly presented as separate topics.13
SPSS FILE EXTENSIONSSPSS uses a number of file extensions to identify various types of files. The extensions most frequently encountered at the introductory level identify data and output files DATA FILES may be identified by the “.SAV” extension. In a list of files an icon containing “SPSS” and a small spreadsheet precedes a data file name. Selecting alisting of data files will include Excel files, which can be opened in SPSS without modification or using a data entry wizard. OUTPUT FILES may be identified by the “.SPO” filename extension. In a list of files an icon containing a bar chart precedes an output file. SYNTAX FILES contain the extension “.SPS.” These files contain a listing of steps used to obtain data
If you select “OK,” SPSS will open the SPSS directory containing over 100 sample data files, including most of the files used in this manual. SPSS contains several pre-defined data files for your use. If you wish to select a data file saved in an SPSS subdirectory

