Transcription
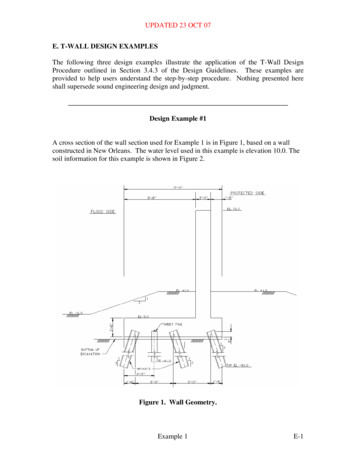
UPDATED 23 OCT 07E. T-WALL DESIGN EXAMPLESThe following three design examples illustrate the application of the T-Wall DesignProcedure outlined in Section 3.4.3 of the Design Guidelines. These examples areprovided to help users understand the step-by-step procedure. Nothing presented hereshall supersede sound engineering design and judgment.Design Example #1A cross section of the wall section used for Example 1 is in Figure 1, based on a wallconstructed in New Orleans. The water level used in this example is elevation 10.0. Thesoil information for this example is shown in Figure 2.Figure 1. Wall Geometry.Example 1E-1
UPDATED 23 OCT 07Figure 2. Soil Profile.Example 1E-2
UPDATED 23 OCT 07Step 1 Initial Slope Stability AnalysisPerform a Spencer’s method slope stability analysis to determine the critical slip surfacewith the water load only on the ground surface and no piles. UTexas4 was used in thisexample for all of the slope stability analysis. For the design example, the critical failuresurface is shown in Figure 3 where the factor of safety is 1.02. Because this value is lessthan the required value of 1.5, the T-Wall will need to carry an unbalanced load inaddition to any loads on the structure.Figure 3. Spencer’s analysis of the T-Wall without piles.Example 1E-3
UPDATED 23 OCT 07Step 2 Unbalanced Force ComputationsDetermine (unbalanced) forces required to provide the required global stability factor ofsafety. The critical failure surface extends down to elevation -23’ in this example. Thetop of the soil near the heel is elevation -0.5’. It is assumed that the unbalanced load ishalfway between these two elevations. Apply a line load at elevation -11.75, at the xcoordinate of the critical failure surface in Figure 3. After several iterations, a line loadof 4,575 lb/ft was found that results in FS 1.50, as shown in Figure 4.F 4575 lb/ftFigure 4. Spencer’s analysis of the T-Wall with an unbalanced load to increaseglobal stability.It should be noted that a search for the critical failure surface was performed with theunbalanced load shown in Figure 4. The search ensures that if the pile foundation of theT-Wall can safely carry the unbalanced load in addition to any other loads on thestructure, the global stability will meet the required factor of safety. The UTexas4 inputfiles for Figures 3 and 4 are attached at the end of this example.Example 1E-4
UPDATED 23 OCT 07Step 3 Allowable Pile Capacity Analysis3.1 For the preliminary analysis, allowable pile capacities determined by engineers inNew Orleans District for the original design of this project are used.Allowable Compression LoadAllowable Tensile Load 74 kips 49 kipsSee Figure 5 for ultimate loads vs. depth from a compression pile load test. Thecompression load above was computed using a factor of safety of 2.0 at a depth of 92feet. For this test, a casing used precludes skin friction above the critical failure surface.The tension load is taken from calculated values shown in Figure 6. At elevation -92 feetthe ultimate load is calculated to be about 81 tons. The capacity above elevation -23 isabout 7 tons. Therefore, the tension capacity can be estimated as 81-7 74 tons. Using asafety factor of 3 (no load test), the allowable capacity is 74(2)/3) 49 kips.Capacity (Tons)708090100110120130140-9274 Tons-93Pile test at tip EL -92.5-94-95EL (ft)-962 Tons/ftInterpretation considering blow counts and 40% ofpile tip block area for end bearing-97-9885 Tons100 Tons-9910 Tons/ft-100-101129.75 TonsPile test at tip EL -101-102Figure 5. Pile Load Test DataExample 1E-5
UPDATED 23 OCT 07Figure 6. Ultimate Axial Capacity with Depth, Calculated3.1 Alternate Method. If load tests are not performed, or allowable capacitiescomputed from an ultimate strength method like APile or CAXPile, the axial pilecapacities can be determined using TZPILE analyses that simulate lateral and axial pileload tests. The soil profiles used in these analyses are presented in Figure 7. The depthscale is in inches. The simulated load tests (after stripping off the top two layers) wereperformed at Elevation -23 which is the lowest elevation of the critical circle from Step 1.Example 1E-6
UPDATED 23 OCT 07Figure 7. Soil Profiles - Stripped to critical surface of minus 23 for TZPILE andLPILE analysisA plot of the TZPILE compression load versus settlement (at the pile head) is presentedin Figure 8. The allowable compressive load is 58 kips based on and ultimate load of 174kips and a factor of safety equal to 3.0 (assuming no pile load tests will be performed andno load case related reductions are applicable). Note that the ultimate of 174 kips (87tons) is approximately equal to the pile capacity curves in Figure 5.Example 1E-7
UPDATED 23 OCT 07174Allowable Compressive Force 174 kips / (FS 3.0) 58 kipsFigure 8. TZPILE Axial Pile Analysis Compression Settlement vs Axial Load Plotfor determination of allowable compressive loads in piles by load simulationmethod.Similarly, the allowable tensile capacity for a pile can be determined from analysis usingthe load simulation method. As shown in Figure 9, the ultimate tensile capacity iscomputed to be 84 kips. The allowable tensile capacity is determined by dividing theultimate load by the factor of safety of 3.0 (assuming no pile load tests were performedand no load case related reductions are applicable). Thus, the allowable tensile load is 28kips. This is less than the tension load computed above, but is presented as an exampleonly and is not used in later design. Most likely there is a discrepancy in assumptions instratigraphy or ultimate strength.Example 1E-8
UPDATED 23 OCT 07Allowable Tension 84 kips / (FS 3.0) 28 kipsFigure 9. TZPILE Axial Pile Analysis TENSION Settlement vs Load Plot forallowable tensile loads in Piles3.2 The allowable shear load (from LPILE) is determined from pile head deflectionversus lateral load plot on Figure 10. The ultimate load was determined to be 24.5 kips.The allowable load is determined to be 8.2 kips after dividing by the factor of safety of3.0.Example 1E-9
UPDATED 23 OCT 07Shear Force vs. Top Deflection52,00048,00044,00040,000Shear Force,36,00032,00024.5 kips28,00024,00020,00016,000Allowable Shear 24.5 kips / (FS 3.0) 8.2 kips12,0008.2 kips8,0004,0000.00.15 ft0.10.20.30.4Top Deflection,LPILE Plus 5.0, (c) 2006 by Ensoft, Inc.Figure 10. LPILE analysis of Pile head deflection vs shear force at critical surface todetermine allowable shear force in piles.Table 1 tabulates the allowable loads for axially loaded compressive and tensile piles,Table 1. Allowable Axial and shear loadsTypeForce (kips)Axial Compressive74Axial Tensile54Shear8.2Example 1E-10
UPDATED 23 OCT 07Step 4 Initial T-wall and Pile Design4.1 Use CPGA to analyze all load cases and perform a preliminary pile and T-walldesign. The unbalanced force is converted to an “equivalent” force applied to the bottomof the T-wall, Fcap, as calculated as shown below (See Figure 11): Lu 2 R Fcap Fub (L p R ) Where:Fub unbalanced force computed in step 2.Lu distance from top of ground to lowest el. of critical failure surface (in) distance from bottom of footing to lowest el. of crit. failure surface (in)LpEIR 4EsE Modulus of Elasticity of Pile (lb/in2)I Moment of Inertia of Pile (in4)Es Modulus of Subgrade Reaction (lb/in2) below critical failure surface. InNew Orleans District this equates to the values listed as KHB.For the solution:Piles HP 14x73.I 729 in4, E 29,000,000 psiSoils – Importance of lateral resistance decreases rapidly with depth, therefore only firstthree layers are input – with the third assumed to continue to the bottom of the pile. Theparameters were developed from soil borings from the New Orleans District shown inFigure 12.Silt, φ 15, C 200 psf, γsat 117 pcf, KHB ave. k 167 psiClay 1, φ 0 , C 200 psf, γsat 100 pcf, KHB k 88.8 psiClay 2, φ 0 , C 374 psf, γsat 100 pcf, KHB k 165.06 psiThe top layer of silt under the critical failure surface is stiffer but only three feet thick.Will use a k 100 psi.R therefore is equal to 121 in 10.08 feetPcap 4,575 * (22.5/2 10.08) / (18 10.08) 3,475 lb/ftExample 1E-11
UPDATED 23 OCT 07Ground Surface atUnbalance LoadTop -0.5EquivalentUnbalanced Forcefor CPGA-2-5Uniform UnbalancedForce, 4,575 lb / ftLu 22.5 ftLp 18 ftSilt-23-26RClay 1Critical FailureSurface-39Clay 2Pile 3Pile 2Pile 1Figure 11. Equivalent Force Computation for Preliminary Design With CPGAExample 1E-12
UPDATED 23 OCT 07Figure 12. Soil Stiffness with Depth4.2 This unbalanced force, Pcap, is then analyzed with appropriate load cases in CPGA.Generally 8 to 20 load cases may be analyzed depending on expected load conditions.For this example, only the still water case is analyzed but both pervious and imperviousfoundation conditions are evaluated. See the spreadsheet calculations in Attachment 3for the computation of the input for CPGA. The model is a 5 foot strip of the pilefoundation.For the CPGA analysis, the soil modulus, Es is adjusted based on the global stabilityfactor of safety. For this example case, the factor of safety is 1.02. Es for CPGA iscompute from the ratio of the computed factor of safety to the target factor of safety.From Figure 12, Es at the bottom of the wall footing is about 53.3 psi.Example 1E-13
UPDATED 23 OCT 07CPGA Es. (1.02-1.0) / (1.5 – 1.0) * 53.3 2.1 psi4.3 This is already a low value, but group factors from EM 1110-2-2906 can also beadded. From page 4-35 of the EM with a spacing to pile diameter ratio of 5 ft / (14/12) 4B, the reduction is 2.6. Es is therefore 2.1/2.6 0.8 psiThe CPGA output is shown in Attachment 4. A summary of results for the two loadconditions analyzed are shown below:LOAD CASE PILE123F1K123F1K.2.1-.2Pervious ConditionF2K.2.2-.2LOAD CASE 9-29.430.7M3IN-KALFCBF.0 .02.0 1.41.0 1.03.03.35.18**Impervious -K-29.6-27.328.7M3IN-KALFCBF.0 .12.0 1.38.0 .94.05.34.16*Where:F1 Shear in pile at pile cap perpendicular to wallF2 Shear in Pile at Pile Cap parallel to wallF3 Axial Load in PileM1 Maximum moment in pile perpendicular to wallM2 Maximum moment in pile parallel to wallM3 Torsion in pileALF Axial load factor – computed axial load divided by allowable loadCBF Combined Bending factor – combined computed axial and bendingforces relative to allowable forcesAllowable axial pile capacities used for this analysis, 74 kips compressive and 49 kipstensile, were shown in step 3. The maximum pile forces computed in the middle pilesexceed these values. This would require deeper piles or perhaps a revision of the pilelayout. From Figure 4, and a factor of safety of 2 for an allowable pile capacity frompile load test data, to reach an allowable of 105 kips (ultimate of 210 kips or 105 tons),the piles only need to be increase to about 99 feet in length. This is not much difference,and the next steps will continue with the layout as shown. The tension piles have slightlyexceeded the allowable capacity and could be made a few feet deeper to achieve requiredloads as well.Computed deflections from the CPGA analysis are shown below:Example 1E-14
UPDATED 23 OCT 07PILE CAP DISPLACEMENTSLOADCASE12DXINDZINRRAD-.7241E 00-.6757E 00-.2963E 00-.2609E 00-.3212E-02-.2899E-02These deflections are less than the allowable vertical deflection (DZ) of 0.5 inches andallowable horizontal deflection (DX) of 0.75 inches from the Hurricane and StormDamage Reduction Design Guidelines.4.4 Sheet pile design. Seepage design of the sheet pile is not performed for this example.4.5 Check for resistance against flow through. Since the pile spacing is uniform, wewill analyze one row of piles parallel with the loading rather than the entire monolith.a. Compute the resistance of the flood side row of piles.n Pult Pall 1.5Where:n number of piles in the row within a monolith. Or, for monoliths withuniformly spaced pile rows, n 1. Use 1 for this examplePult β(9Sub)Su soil shear strengthb pile width 14”β group reduction factor pile spacing parallel to the load - since thepiles batter opposite to each other, there group affects are not computed.For the soils under the slab, Su 120 psfTherefore: Pult 9(120 psf )(14 in/12 in/ft) 1,260 lb/ftΣPult summation of Pult over the height Lp, as defined in paragraph 4.1For single layer soil is Pult multiplied by Lp (18 ft) - That is the conditionhere since the shear strength is constant from the base to the critical failuresurface.ΣPult 1,260 lb/ft (18 ft) 22,680 lbΣPall 1(22,680 lb)/1.5 15,120 lbb. Compute the load acting on the piles below the pile cap.Fup wf ub L pWhere:w Monolith width. Since we are looking at one row of piles in this example,w the pile spacing perpendicular to the unbalanced force (st) 5 ft.Example 1E-15
UPDATED 23 OCT 07FubLuFub Total unbalanced force per foot from Step 2 4,575 lb/ftLu 22.5 ftLp 18 ftf ub fub 4,575 lb/ft / 22.5 ft 203 lb/ft/ftFp 5 ft(203lb/ft/ft)(18ft) 18,270 lbc. Check the capacity of the piles 50% of Fp 18,270 lb(0.50) 9,135 lbThe capacity ΣPall 15,120 lb 9,135 lb so OK for flow-through with thischeck.4.6 Second flow through check. Compute the ability of the soil to resist shear failurebetween the pile rows from the unbalanced force below the base of the T-wall, fubLp,using the following equation:f ub L p Ap S u 2 FS ( st b) Where:ApSu The area bounded by the bottom of the T-wall base, the critical failuresurface, the upstream pile row and the downstream pile row multiplied by the shearstrength of the soil within that area. – See Figure 13. Su 120 psfApSu (18(10 22)/2)(120 psf) 34,560 lbFS Target factor of safety used in Steps 1 and 2. – 1.5st the spacing of the piles transverse (perpendicular) to the unbalanced force 5 ftb pile width – 14 inchesfpbLp (203 lb/ft)( 18 ft) 3,654 lb A p S u 2 34,5602 12,021 lb FS ( st b) 1.5 14 5 12 Therefore, capacity against flow through is OKExample 1E-16
UPDATED 23 OCT 0710 ftUnbalancedForce BelowPile Cap, fubLpShear Areabounded bypiles, ApLp 18 ft13Critical FailureSurface22 ftFigure 13. Shear Area for Flow Through CheckExample 1E-17
UPDATED 23 OCT 07Step 5 Pile Group Analysis5.1 A Group 7 analysis is performed using all loads applied to the T-wall structure.Critical load cases from step 4 would be used. In this example, only one load case withtwo foundation conditions is shown.5.2 The loads applied in the Group 7 model include the distributed loads representingthe unbalanced force that acts directly on the piles and also the water loads and selfweight of the wall that acts directly on the structure. In Group 7 these loads are resultanthorizontal and vertical forces and the moments per width of spacing that act on the Twall base (pile cap). They also include the unbalance force from the base of the cap tothe top of soil, converted to a force and moment at the base of the structure. These forcesare calculated using a worksheet or Excel spreadsheet and are shown at then end of thespreadsheets shown in Attachment 3. For this analysis the resultant forces per 5-ft ofpile spacing were:Impervious Foundation ConditionVertical forceHorizontal forceMoment 61,325 lb 37,231 lb 1,540,666 in-lbsPervious Foundation ConditionVertical forceHorizontal forceMoment 52,731 lb 37,231 lb 1,031,916 in-lbs5.3 The unbalanced load below the bottom of the footing is applied directly asdistributed loads on the pile. Check if (nΣPult) of the flood side pile row is greater than50% Fp, (from 4.5).(nΣPult) 1 (22,680) 22,680 lb50% Fp 9,135 lbTherefore distribute 50% of Fp onto the flood side (left) row of piles.0.5fubst 0.5 (203 lb/ft/ft)(5 ft) 507.5 lb/ft 42 lb/inThe remainder is divided among the remaining piles.Middle pileRight pile 21 lb/in 21 lb/in5.4 The group 7 model is illustrated in Figure 14.Example 1E-18
UPDATED 23 OCT 07Figure 14. Group 7 Model with Soil Stratigraphy.5.5 Additionally, in this analysis partial p-y springs can be used be cause theunreinforced factor of safety of 1.020 is between 1.0 and 1.5. The percentage of the fullsprings is determined as follows:Partial spring percentage (1.020 – 1.000)/ (1.5- 1.0) x 100% 4%Thus the strengths of in the top two layers, extending to Elevation -23 ft, were reduced to4% of the undrained shear strength of 120 psf or 4.8 psf (0.0333 psi). The reducedundrained shear strength was used to scale the p-y curves above elevation -23 ft only.The results of the Group 7 analysis are listed in Table 1 where the pile responses for thefull loading conditions on T-wall systems are listed. An example of the Group 7 outputfor the pervious condition are shown in Attachment 5Example 1E-19
UPDATED 23 OCT 07Table 2. Axial and shear Pile loads per 5-ft of width computed by Group 7 for fullloading conditions that include distributed load in 50-25-25 split applied directly to pilesand resultant horizontal, vertical and moments due to water loads and self weight applieddirectly to the structureImpervious CaseLeft PileCenter PileRight PileAxial Force (kips)-35.3 (T)88.5 (C)11.6 (C)Shear Force (kips)4.492.42.7Max. Moment (k-in)-227-199-225Pervious CaseLeft PileCenter PileRight PileAxial Force (kips)-41.3 (T)93.3 (C)4.0 (C)Shear Force (kips)4.582. 52.7Max. Moment (k-in)-243-219-249Figure 15 shows moment in the piles vs. depth and Figure 16 shows shear vs depth.There is no lateral soil stiffness from 0 to 216 inches.Example 1E-20
UPDATED 23 OCT 07Figure 15. Moment vs depth.Example 1E-21
UPDATED 23 OCT 07Figure 16. Shear vs depth5.7 The axial forces and shear in Table 2 are then compared with allowable loads listedin Table 1. The results of the comparison show that:a. the axial compressive forces in the center pile, 92.5 kips, exceeds theallowable compressive load of 74 kips.b. the axial tensile force from the left (flood side) pile of -41.0 kips is less thanthe allowable tensile load of 54 kips.c. The shear forces in each of the three piles are lower than the allowable shearof 8.2 kips.Because the axial capacities of the center pile is exceeded, the pile layout must berepeated using a different pile layout. Axial forces and moment in the pile would becompared to allowable values computed according to EM 1110-2-2906. Moment andaxial forces in the piles would also be checked for structural strength according to criteriaExample 1E-22
UPDATED 23 OCT 07in the Hurricane and Storm Damage Reduction System Design Guidelines and EM11102-2906.Displacements from the Group 7 analysis are as .5200.485DZIN-0.20-0.18These deflections are less than the allowable vertical deflection (DZ) of 0.5 inches andallowable horizontal deflection (DX) of 0.75 inches from the Hurricane and StormDamage Reduction Design Guidelines.Deflection of the piles vs. depth is shown in Figure 17.Figure 17 Deformed shape of pile capExample 1E-23
UPDATED 23 OCT 07Deflection of the piles vs. depth is shown in Figure 18.Figure 18 Deflection vs DepthExample 1E-24
UPDATED 23 OCT 07Step 6 Pile Group Analysis (unbalanced force)6.1 Perform a Group 7 analysis with the distributed loads applied directly to the piles.The distributed loads are statically equivalent to the unbalanced force of 4,575 lb/ft. Noloads are applied to the cap except unbalance forces. The p-y springs are set to 0 to thelowest critical failure surface elevation by setting the ultimate shear stress of these soils ata very low value. The distributed loads were computed in the previous step and areshown in the Excel spreadsheet computations shown in Attachment 3. Results of theGroup analysis are shown below:Table 3. Axial and shear Pile loads per 5-ft of width computed by Group 7Left PileCenter PileRight PileAxial Force (kips)-21.9 (T)46.5 (C)-24.5 (T)Shear Force (kips)4.242.322.48Step 7 Pile Reinforced Slope Stability Analysis7.1 The UT4 pile reinforcement analysis using the circle from Step 2 is performed todetermine if the target Factor of Safety of 1.5 is achieved. The piles are treated asreinforcements in the UT4 and the shear and axial forces from Step 6 are used todetermine these forces. The forces in Table 3 must be converted to unit width conditionsby dividing by the 5-ft pile spacing to be used as the axial and shear forces in the pilereinforcements in UT4. The results of the analysis are shown in Figure 18. The factor ofsafety is 1.521 which exceeds that target factor of safety of 1.5. Therefore, the globalstability of the foundation is verified in this Step. The input file is listed in Attachment 6.Example 1E-25
UPDATED 23 OCT 07Figure 19. Factor of safety computed using pile forces from Group 7 analysisAnd critical circle from fixed grid analysis7.2 Pile axial and shear forces determined in the pile group analysis are input in the slopestability analysis as longitudinal and transverse reinforcement forces. Sign conventionfor longitudinal forces in UTexas4 is that tensile forces are positive and compressiveforces are negative. Sign convention for pile founded T-Walls with piles that extendbelow the critical failure surface and resist sliding of the soil mass is that transverseforces in UTexas4 are positive in the clockwise direction and negative in the counterclockwise direction. This results in positive transverse forces in cases where the left sideof the T-Wall is the flood side and negative transverse forces in cases where the right sideof the T-Wall is the flood side. Positive longitudinal and transverse reinforcement forcesfor pile founded T-Walls are shown in Figure 20.Example 1E-26
UPDATED 23 OCT 07 Figure 20. Positive directions for longitudinal and transverse reinforcement loads inpile.Example 1E-27
UPDATED 23 OCT 07Attachment 1 – Spencer’s method analysis without piles that results in Figure 3.HEADINGT-Wall Deep Seated AnalysisAnalysis without pilesPROFILE LINES11 Layer 3 (CH) - Floodside.00-2.00141.00-2.00155.00-2.0021 Layer 3 (CH) - Landside157.00-2.00375.00-2.0032 Compacted Fill - FS141.00-2.00145.50-.5042 Compacted Fill - LS158.501.00167.001.00176.00-2.0053 301.00-2.00-2.50-2.50-5.0061 Layer 3 (CH) - Under Wall145.50-5.00158.50-5.0074 Layer 4 (CH).00-14.00375.00-14.0085 Layer 5 (ML).00-23.00375.00-23.0096 Layer 6 (CH).00-26.00375.00-26.00107 Layer 7 (CH)Example 1E-28
UPDATED 23 OCT 07.00375.00-31.00-31.00118 Layer 8 (CH).00-39.00375.00-39.00129 Layer 9 (CH).00-65.00375.00-65.001310 Compacted145.50150.00155.00Fill - Above T Wall Base-.501.001.00FS1410 Compacted Fill - Above T Wall Base157.001.00158.501.00LSMATERIAL PROPERTIES1 Layer 3 (CH)80.00 Unit WeightConventional Shear120.00.00No Pore Pressure2 Compacted Fill110.00 Unit WeightConventional Shear500.00.00No Pore Pressure3 T Wall.00 Unit WeightVery Strong4 Layer 4 (CH)100.00 Unit WeightConventional Shear120.00.00No Pore Pressure5 Layer 5 (ML)117.00 Unit WeightConventional Shear200.0015.00Piezometric Line16 Layer 6 (CH)100.00 Unit WeightConventional Shear200.00.00No Pore Pressure7 Layer 7 (CH)100.00 Unit WeightLinear Increase217.008.10No Pore Pressure8 Layer 8 (CH)Example 1E-29
UPDATED 23 OCT 07100.00 Unit WeightLinear Increase374.008.30No Pore Pressure9 Layer 9 (CH)100.00 Unit WeightLinear Increase590.008.00No Pore Pressure10 Compacted Fill - Above T-Wall Base.00 Unit WeightConventional Shear.00.00No Pore PressurePIEZOMETRIC LINES162.40 Water 00-1.00262.40 Piezometeric levels in 00173.00-1.00375.00-1.00DISTRIBUTED LOADS1ANALYSIS/COMPUTATIONCircular Search 1146221.00-100.00.00Tangent-23SINgle-stage ComputationsRIGht Face of SlopeLONg-form outputSORt radiiCRIticalPROcedure for computation of Factor of SafetySPENCERGRAPHCOMPUTEExample 1E-30
UPDATED 23 OCT 07Attachment 2 – Spencer’s method analysis with unbalanced load that results inFigure 4.HEADINGT-Wall Deep Seated AnalysisAnalysis without pilesPROFILE LINES11 Layer 3 (CH) - Floodside.00-2.00141.00-2.00155.00-2.0021 Layer 3 (CH) - Landside157.00-2.00375.00-2.0032 Compacted Fill - FS141.00-2.00145.50-.5042 Compacted Fill - LS158.501.00167.001.00176.00-2.0053 301.00-2.00-2.50-2.50-5.0061 Layer 3 (CH) - Under Wall145.50-5.00158.50-5.0074 Layer 4 (CH).00-14.00375.00-14.0085 Layer 5 (ML).00-23.00375.00-23.0096 Layer 6 (CH).00-26.00375.00-26.00107 Layer 7 (CH)Example 1E-31
UPDATED 23 OCT 07.00375.00-31.00-31.00118 Layer 8 (CH).00-39.00375.00-39.00129 Layer 9 (CH).00-65.00375.00-65.001310 Compacted145.50150.00155.00Fill - Above T Wall Base-.501.001.00FS1410 Compacted Fill - Above T Wall Base157.001.00158.501.00LSMATERIAL PROPERTIES1 Layer 3 (CH)80.00 Unit WeightConventional Shear120.00.00No Pore Pressure2 Compacted Fill110.00 Unit WeightConventional Shear500.00.00No Pore Pressure3 T Wall.00 Unit WeightVery Strong4 Layer 4 (CH)100.00 Unit WeightConventional Shear120.00.00No Pore Pressure5 Layer 5 (ML)117.00 Unit WeightConventional Shear200.0015.00Piezometric Line16 Layer 6 (CH)100.00 Unit WeightConventional Shear200.00.00No Pore Pressure7 Layer 7 (CH)100.00 Unit WeightLinear Increase217.008.10No Pore Pressure8 Layer 8 (CH)Example 1E-32
UPDATED 23 OCT 07100.00 Unit WeightLinear Increase374.008.30No Pore Pressure9 Layer 9 (CH)100.00 Unit WeightLinear Increase590.008.00No Pore Pressure10 Compacted Fill - Above T-Wall Base.00 Unit WeightConventional Shear.00.00No Pore PressurePIEZOMETRIC LINES162.40 Water 00-1.00262.40 Piezometeric levels in 00173.00-1.00375.00-1.00DISTRIBUTED LOADS1LINE LOADS1145-11.75 -4575.00.00 1ANALYSIS/COMPUTATIONCircular Search 1145220.50-100.00.00Tangent-23SINgle-stage ComputationsRIGht Face of SlopeLONg-form outputSORt radiiCRIticalPROcedure for computation of Factor of SafetySPENCERGRAPHCOMPUTEExample 1E-33
UPDATED 23 OCT 07Attachment 3 Structural Loads for CPGA and Group AnalysesUS Army Corps of EngineersPROJECT TITLE:COMPUTED BY: DATE:T-Wall Design ExampleKDHSUBJECT TITLE:CHECKED BY:SHEET:07/27/07DATE:Water at El. 10', PerviousSaint Paul DistictInput for CPGA pile analysisUpstream Water ElevationDownstream Water ElevationWall Top ElevationStructure Bottom ElevationBase WidthToe WidthWall ThicknessBase ThicknessVertical ForcesComponentHeightStem Concrete15Heel Concrete2.5Toe Concrete2.5Heel Water9Toe Water1.5Heel Soil3.5-Triangle1.50Toe Soil3.5Rect Uplift-4Tri Uplift-11Sum Vertical ForcesPervious Foundation 500ftftftftftftftftBack Fill Soil ElevationFront Fill Soil ElevationGamma WaterGamma ConcreteGamma Sat. BackfillDistance to Backfill BreakSlope of Back FillSoil Elevation at 06250.06250.110-0.0480.1100.06250.0625Horizontal ForcesComponentH1H2Gamma Lat. Coeff.Driving Water10-50.06251Resisting Water-1-50.06251Lateraral soil forces assumed equal and negligibleSum Horizontal ForcesTotal Structural ForcesAbout t Vert. Force10.5515Arm11.17Moment117.84 ft-kNet Vertical ArmFrom Toe1.8310ft-kft5ConcreteWaterUpliftSoil0-5Moment About Toe-19.3 ft-kModel Width5 ft-10-15-20-2505101520Example 1E-34
UPDATED 23 OCT 07US Army Corps of EngineersPROJECT TITLE:COMPUTED BY: DATE:T-Wall Design ExampleKDHSUBJECT TITLE:CHECKED BY:SHEET:07/27/07DATE:Water at El. 10', PerviousSaint Paul DistictCalculation of Unbalanced ForceUnbalanced Force. Fub4,575 lb/ftElevation of Critical Surface-23 ftLength - Ground to Crit. Surface, Lu22.5 ftLength - Base to Crit. Surface, Lp18 ft4Pile Moment of Inertia. I729 in2Pile Modulus of Elasticity E29,000,000 lb/in2Soil Modulus of Subgrade Reaction, k100 lb/inSoil Stiffness Parameter, R121 inEquivalent Unbalanced Force, Pcap3,474 lb/ftFrom UTexas AnalysisFrom UTexas Analysis(assume failure surface is normal to pile)HP14x731/4(EI / k)Fub * (Lu/2 R) / (Lp R)CPGA InputPXPYPZMXMYMZ-50.03 kips52.73 kips0-96.29 kip-ft0Group Input3 Pile Rows Parallel to Wall FaceUnbalanced Loading on Piles for Group AnalysisFub * Model Width /LuTotal85 lb/in50%42 lb/inFor Pile on Protected Sied25%21 lb/inNote: Applied to length of pile from bottom of cap to top of critical surface.18Unbalanced Loads on Wall for Group Analysis of Just Unbalanced ForcesDistance From Base to Ground Surface, Ds4.50 ftPX0PY4,575PZ0MX0MY0MZ -123,525lblblbFub * Model Width / Lu * Dslb-in-PZ * Ds/2Total Loads for Group AnalysisPXPYPZMXMYMZ52,731 lb37,231 lb0 lb001,031,916 lb-inPYub Sum Horizontal * Model WidthExample 1E-35
UPDATED 23 OCT 07US Army Corps of EngineersPROJECT TITLE:COMPUTED BY: DATE:T-Wall Design ExampleKDHSUBJECT TITLE:CHECKED BY:SHEET:07/27/07DATE:Water at El. 10', ImperviousSaint Paul DistictInput for CPGA pile analysisUpstream Water ElevationDownstream Water ElevationWall Top ElevationStructure Bottom ElevationBase WidthToe WidthWall ThicknessBase ThicknessImpervious Foundation Assumption10-112.5-5131.51.52.5Vertical ForcesComponentHeightStem Concrete15Heel Concrete2.5Toe Concrete2.5Heel Water9Toe Water1.5Heel Soil3.5-Triangle1.50Toe Soil3.5Prot. Side Uplift-4Flood Side Uplift-15Sum Vertical Forcesx110011.5011.50011.540ftftftftftftftftBack Fill Soil ElevationFront Fill Soil ElevationGamma WaterGamma ConcreteGamma SoilDistance to Backfill BreakSlope of Back FillSoil Elevation at Heelx211.511.5131013105.013
shall supersede sound engineering design and judgment. _ Design Example #1 A cross section of the wall section used for Example 1 is in Figure 1, based on a wall . Pile test at tip EL -101 Pile test at tip EL -92.5 Interpretation considering blow counts and 40% of pile tip b