Transcription
MONROE COUNTY: IRAS-PAT VALIDATIONFINAL REPORTEvan LowderZeyue LinEric GrommonBrad RayDECEMBER 20191
INTRODUCTIONPretrial decision-making involves timely choices by judges with limited information and variableinput from members of the courtroom workgroup (DeMichele et al., 2018). It is well establishedthat the decisions made at this phase of justice system processing have implications forsubsequent outcomes. Defendants incarcerated pending trial are more likely to plead guilty,receive lengthier sentences, and subsequently recidivate more often in relation to defendantsreleased prior to court disposition (Stevenson & Mayson, 2017). Incarceration can alsostigmatize and disrupt housing, employment, family relationships, and ties to the community(Stevenson & Mayson, 2017). Pretrial risk assessments have emerged as one strategy to structureand improve decision-making. The integration of assessment tools also comes at a time whenreforms on the use of monetary bond schedules are being advanced across the country(Stevenson, 2018).Pretrial risk assessment tools are not without controversy. The primary set of criticisms aboutthese tools concern whether they are able to predict pretrial misconduct, differentiate thelikelihood or frequency of misconduct by risk level, and minimize the potential effect of racial,ethnic, and gender biases while maintaining comparable rates or reducing the risk of pretrialmisconduct. Much of the evidence for or against the utility of pretrial risk assessment tools isbased on theoretical claims; research evaluations have not kept pace with the volume of localimplementations and the most prominent research studies have been produced by entities thathave designed a tool (Stevenson, 2018). Although studies have demonstrated the predictivevalidity of specific pretrial risk assessment tools (e.g., Austin, Bhati, Jones, & Ocker, 2010;Austin, Ocker, & Bhati, 2010; Cadigan & Lowenkamp, 2011; Latessa, Lemke, Makarios, Smith,& Lowenkamp, 2010), questions remain about tools that have not been subject to validity tests,tools that have been constructed in one jurisdiction and integrated in another, the items used toscore tools, the capacity to administer the tools, how the perceptions of courtroom workgroupprofessionals can influence the adoption of tools (DeMichele et al., 2018), and the effect ofinstrument adoption on rates of incarceration and pretrial misconduct (Stevenson, 2018).Previously, researchers from the Indiana University Public Policy Institute, Center for CriminalJustice Research (CCJR) conducted a process evaluation of pilot counties to understand how theIndiana Risk Assessment System – Pretrial Assessment Tool (IRAS-PAT) was adopted byparticipating pilot counties. This foundational study also identified barriers and facilitators toimplementation and explored relationships between IRAS-PAT items, risk categories, and bondor order for release outcomes (Grommon, Ray, Sapp, & Thelin, 2017). The current inquirymoves to the second stage of research on the IRAS-PAT pilot program. This phase offers acounty-by-county validation of the IRAS-PAT.To date, the IRAS-PAT has not been subject to a formal validation. Other assessment tools in theIRAS suite – Community Supervision Tool (CST), Community Supervision Screening Tool, andPrison Reentry Tool (PRT) – were assessed in a sole Indiana validation study (Latessa, Lovins,& Makorios, 2013). Overall, the findings confirmed that the IRAS-CST, IRAS-CSST, andIRAS-PRT are able to predict recidivism and the relative risk of recidivism varies by risk level.The predictive validity of the IRAS-PAT could not be assessed in this study due to the lack ofrequisite data (Latessa et al., 2013, p. 9).2
Insights about the predictive validity of the IRAS-PAT can be deduced from IRAS’spredecessor, the Ohio Risk Assessment System (ORAS) and its Pretrial Assessment Tool (PAT).The ORAS-PAT consists of seven items across four domains: criminal history (three items),employment (one item), residential stability (one item), and substance abuse (two items). ORASPAT assessments were validated in a sample of 452 defendants from seven Ohio counties and anaverage follow-up of 12 months (Latessa, Smith, Lemke, Makarios, & Lowenkamp, 2009).Overall, 16% of defendants failed to appear or were rearrested. Risk score was positively andmoderately associated with recidivism (r 0.23). Risk levels also followed a stepwise progressionas 5% of low risk defendants recidivated, while 18% of moderate risk and 30% of high riskdefendants recidivated. Similar stepwise patterns were observed within ORAS-PAT domains(although the associations between domains and recidivism outcomes were not as strong as thoseestablished in the test of relationship between risk score and recidivism, ranging in value fromr 0.05 to r 0.19).The initial validation of the ORAS-PAT offers promising results, but it is not clear if thesefindings are or are not consistent with the IRAS-PAT or samples of defendants from Indiana.Beyond generalizability concerns, researchers leading the initial ORAS-PAT validation note thatfindings may be influenced by measurement error as data were generated from detailedstructured interviews with defendants. This suggests that the data used to validate the tool werenot generated in the same manner used by local jurisdictions to administer the tool and identifyrisk levels.To better understand the predictive validity of the IRAS-PAT, we report IRAS-PAT validationfindings from Monroe County. This study also provides a demonstration of the approach to beundertaken with the remaining pilot program counties should the appropriate data systems andmetrics be in place to support a validation study. Prior to presenting the results, we describe themethods, procedures, and assumptions. The study will conclude with a discussion of key findingsand directions for future research.METHODSStudy ContextMirroring national trends, the state of Indiana reported the highest local incarceration rate of allmidwestern states (330 per 100,000 residents) in 2013, representing a 15% increase over 1999rates. Indiana’s local jail capacity was among the highest for midwestern jurisdictions at yearend 2013 (83.2% capacity), second only to Ohio (Minton et al., 2015). Responding to thesetrends, the Indiana Supreme Court founded the Committee to Study Evidence-Based PretrialRelease to develop and evaluate evidence-based pretrial release practices. In 2014, theCommittee developed a pilot program to examine implementation of the IRAS-PAT in 11Indiana counties: Allen, Bartholomew, Grant, Hamilton, Hendricks, Jefferson, Monroe, Porter,St. Joseph, Starke, and Tipton. The purpose of the pilot project was to validate and evaluate theimplementation of the IRAS-PAT in the 11 pilot counties, including the extent of its use andfeasibility for use in other Indiana jurisdictions. The pilot program began between January 2016and March 2017 in participating counties and is ongoing.3
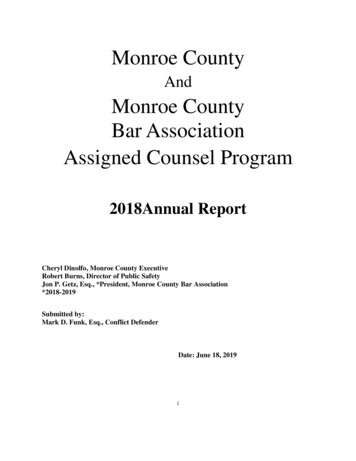
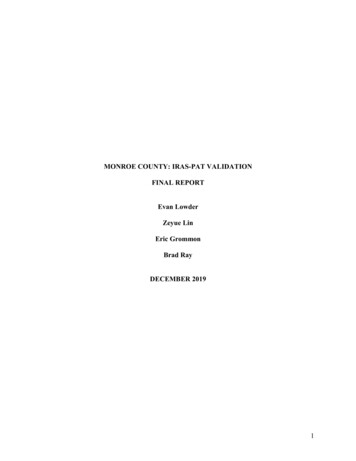
Data for this investigation were drawn from Monroe County, which is located in Central Indianaand has a population of 146,986 people (2017 estimate). Probation officers in Monroe Countyadministered the IRAS-PAT post-booking and pre-arraignment to misdemeanor and felonyarrestees. Persons excluded from the pilot project were those individuals who were on probation,parole, and other types of community supervision; who were held on an out-of-county hold; orwho were arrested on a Writ of Attachment. The pilot program began October 1st, 2016 and isongoing; however, we defined the validation period for the pilot program as October 1st, 2016through September 30th, 2017. The follow-up period for each defendant was defined by thepretrial processing period (i.e., the date of index jail release to the date of court disposition).Data SourcesWe received administrative data from several databases. Jail records from the Monroe CountySheriff’s Office provided information on booking dates and length of stay as well as offenses atthe time of arrest over a 2.5-year study period (October 1st, 2016-March 19th, 2019). FromINcite, we received pretrial records containing information on IRAS-PAT assessments, includingdate of administration, for the study period. Court records were procured through the statewideOdyssey Case Management System (Odyssey), which included all case-related informationincluding, but not limited to hearings, FTAs, and case outcomes over the same period.Data CleaningWe linked jail bookings records to court records contained in Odyssey using a combination ofdefendant identifiers (i.e., last name, first name, and date of birth) and date logic. Specifically,we created unique person-level identifiers for each detainee using a combination of the first threeletters of a first name, first three letters of a last name, and year of birth. Then, we matched courtcases filed in Monroe County to booking records based on the individual-level identifier and 1)an initial hearing occurring on the same day as or up to 3 days following a booking date; 2) afiling date occurring on the same day or up to three days following a booking date; or 3) a filingdate occurring the day before or up to three days before a booking date. Following this process,assessment records from INcite were linked to jail booking records where the date of assessmentoccurred during an episode of incarceration.Overall, we identified 4,870 unique bookings during the pilot period. Of these, we linked 2,022bookings to a plausible court case filed for each detainee. Of 2,022 bookings with a court case,we identified 1,262 (of 1,993 total assessments) with an assessment conducted during the periodof incarceration. Of these 1,262 defendants with a linked court case and assessment, weidentified 82 duplicate individuals and 1 booking with an unfeasible filing date. For defendantswho had multiple assessments conducted during the pilot period, we selected the first assessmentthat was associated with a court case filing. Of the resulting 1,179 detainees with a linked courtcase and an assessment, 84 defendants had no court case disposition by the end of the follow-upperiod (March 29th, 2019) and an additional 65 defendants had cases that were disposed prior torelease from jail, resulting in no defined at-risk period in the community. This process resulted ina final analytic sample of 1,030 pretrial defendants. See Figure 1 for sample flow chart.4
SampleThe sample consisted of 1,030 pretrialdefendants who were an average age of31.79 (SD 12.22, Range: 18 to 78).Defendants were primarily male (n 759, 73.7%) and Caucasian (n 810,78.6%). Smaller proportions ofdefendants identified as AfricanAmerican (n 143, 13.9%), Asian (n 22, 2.1%), or Hispanic or Latino (n 28, 2.7%). Racial or ethnicidentification was unavailable for asmall proportion of defendants (n 9,0.9%). Defendants were primarilybooked on misdemeanor charges only(n 684, 66.4%). Roughly one-third ofFigure 1. Sample Flow Chartdefendants were booked on at least onefelony charge (n 346, 33.6%). Across all offenses for which defendants were booked into jail,offense categories included driving under the influence (n 279, 27.1%), disorderly conduct (n 200, 19.4%), battery (n 164, 15.9%), drug-related crimes (n 158, 15.3%), liquor law-relatedcrimes (n 105, 10.2%), theft (n 91, 8.8%), and motor vehicle (n 70, 6.8%) offenses.Importantly, these categories are not mutually exclusive because a detainee can be booked onmore than one offense.VariablesIRAS-PAT. The IRAS-PAT is an actuarial assessment designed to predict risk of arrest andFTA during the pretrial period. The IRAS-PAT is a 7-item instrument measuring 1) age at firstarrest, 2) number of FTA warrants in the past 24 months, 3) three or more prior jailincarcerations, 4) employment at the time of arrest, 5) residential stability, 6) illegal drug use inthe past six months, and 7) a severe drug use problem. Items 1, 3, 5, 6, and 7 are scoreddichotomously (i.e., 0 or 1) and items 2 and 4 are scored on a 0-2 point scale, producing amaximum total score of 9. Total scores classify defendants into three risk bins: Low (0-2),Moderate (3-5), and High (6 ). Our investigation used IRAS-PAT total scores, risk estimates,and items.Case outcomes. Case outcomes were measured in the period between a defendant’s release dateand case disposition date. We measured three primary outcomes. Any arrest measured a newbooking occurring during the pretrial period. Any new arrest measured a new booking occurringduring the pretrial period in which a detainee was booked on at least one offense for a newcrime. Bookings that were not associated with a new offense (e.g., violation of probation orparole, an outstanding warrant, supervision violation, etc.) were excluded from this measure. AnyFTA measured failure to appear at any court appearance during case processing. Additionally, wereport descriptively on any pretrial misconduct during the pretrial period, indicated as either anew arrest (or any arrest) or FTA occurring during this period. Multivariable models additionally5
controlled for time at risk, defined as the number of days in the community, excluding jail time,between the release date and case disposition date. On average, defendants were at risk for189.96 days (SD 158.48, Range: 1 to 863).Analytic StrategyWe first conducted descriptive statistics on all study variables to assess response distributions.Then, we conducted crosstabulations of risk levels with case outcomes to examine rates ofpretrial misconduct at each risk classification. Significant associations were tested using a chisquared test of independence and effect size measured using Cramer’s V. Cramer’s V values of.10, .30, and .50 indicate small, medium, and large effect sizes, respectively (Cohen, 1988).Among defendants with arrests or any pretrial failure during the case processing period, weexamined survival days (i.e., days from release to date of arrest or FTA) by risk classification.To examine the predictive validity of IRAS-PAT assessments, we used a multi-prongedapproach. First, we examined the Area Under the Curve (AUC) of the Receiving OperatingCharacteristic (ROC) curve statistics. AUC values are commonly used to evaluate the predictiveaccuracy of risk assessment total scores. AUC values range from .50 to 1, with .50 indicatingchance levels of classification and 1 suggesting perfect classification. AUC values below .54 aretypically considered poor, .55 to .63 fair, .64 to .70 good, and .71 and above excellent. Theseconventions have been documented in reports adopted by the Bureau of Justice Assistance,National Institute of Justice, and National Institute of Corrections and represent the benchmarksfor predictive accuracy in the field of risk assessment (Desmarais & Singh, 2013). Second, weconducted a series of logistic regression analyses to examine the predictive validity of IRASPAT assessments for each pretrial misconduct outcome, controlling for time at risk. Forreference, odds ratios of 1.50, 3.00, and 5.00 indicate small, medium, and large effect sizes,respectively (Chen, Cohen, & Chen, 2010).Third, we conducted survival analyses using cox proportional hazard models to examinepredictive accuracy as a function of time to a specific outcome. Hazard models are useful forexamining not only whether or not an event occurred (e.g., whether someone had a new arrest ornot) but also the length of time that someone is at risk in the community (i.e., survival time).These models are especially useful when the length of follow-up time differs across participants.Cox regression models a hazard function, which is expressed as the probability of a participantexperiencing the outcome (i.e., yes; no) at a given time (i.e., the participant’s survival time in thecommunity). Cox regression models produce hazard ratios (HR), which are numericalexpressions of the difference in the rate of an outcome occurring between two conditions. Forinferential statistics, we used a p .05 criterion to determine statistical significance.6
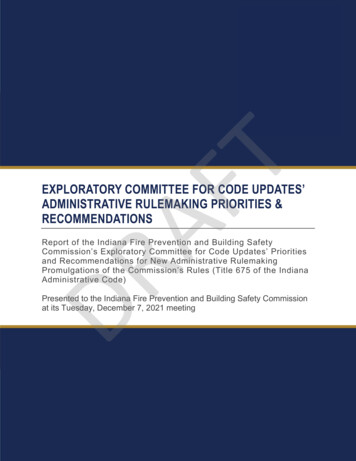
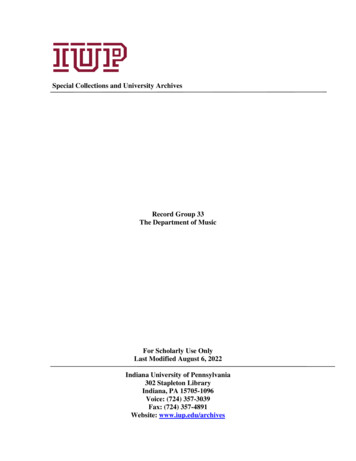
RESULTSDescriptivesNumber ofDefendantsIRAS-PAT. IRAS-PAT scores averaged 2.86 (SD 1.84, Range: 0 to 9) across defendants,corresponding to a low-moderate risk classification. The frequency distribution of IRAS-PATscores is presented in Figure 2. As shown, defendants were relatively low risk, with half ofIRAS-PAT scores falling below 3 45IRAS-PAT Total Score6362878389Figure 2. Frequency of IRAS-PAT Total ScoresThe high proportion of defendants with low risk classifications (n 526) is also depicted inFigure 3. As shown, fewer defendants were classified at moderate risk (n 402), and less thanone-tenth at high risk (n 102).Percentage erateHighIRAS-PAT Risk LevelFigure 3. Frequency of IRAS-PAT Risk EstimatesCase Outcomes. Following jail release, but prior to case disposition, 19.0% of defendants had afailure to appear for any court hearing (n 196) and 14.5% had at least one new arrest (n 149).Slightly less than one-third of the sample had any pretrial misconduct prior to case disposition (n 297, 28.8%).7
Crosstabulations of Risk Level and OutcomesTable 1 presents risk classifications crosstabulated with outcome variables. As predicted, rates ofpretrial misconduct were lowest for defendants classified at low risk and highest for defendantsclassified at high risk. On average, rates of pretrial misconduct were 5-10 times greater for highrisk defendants relative to low risk defendants. Slightly more than half of all pretrial defendantsclassified at high risk and released into the community prior to case disposition had some form ofpretrial misconduct. For defendants who had any failure to appear prior to case disposition, highrisk defendants failed to appear for a court appearance (M 129.12 days, SD 125.87) soonerthan moderate (M 197.56 days, SD 173.26) and low (M 246.28 days, SD 207.56) riskdefendants. Among defendants who were arrested for a new offense prior to case disposition,high risk defendants were arrested more quickly (M 117.72 days, SD 125.96) relative tomoderate (M 122.95 days, SD 139.82) and low (M 145.74 days, SD 163.24) riskdefendants. Among all defendants, the length of time between pretrial release and casedisposition was positively associated with any FTA (r[1028] .31, p .001), any new arrest(r[1028] .31, p .001), and any arrest (r[1028] .42, p .001).Case OutcomesLown %Any FTA46 8.7Any New Arrest38 7.2Any Arrest55 10.5Any Pretrial Misconduct (with Any New Arrest) 72 13.7Any Pretrial Misconduct (with Any Arrest)81 15.4Note. ***p .001Risk LevelModeraten%108 26.975 18.7149 37.1162 40.3208 48.3ComparisonHighn%42 41.236 35.365 63.763 61.872 70.6X2 (df)84.60*** (2)63.76*** (2)166.59*** (2)138.45*** (2)179.13*** (2)Cramer’s V.29.25.40.37.42Table 1. Crosstabulations of Risk Classification and Pretrial Outcomes8
Predictive Validity AnalysesAUC of the ROC. AUC values were .71 (SE .02, 95% CI: .0.67, 0.75) for any FTA, .70 (SE .02, 95% CI 0.65, 0.74) for any newarrest, and .76 (SE .02, 95% CI: .73, .79) for any arrest. These values correspond to excellent levels of predictive accuracy for FTAand any arrest risk and good levels of predictive accuracy for risk of any new arrest.Logistic Regression Models. Table 2 present results of a series of logistic regression analyses modeling case outcomes whilecontrolling for time at risk. The results showed the strongest predictive validity of IRAS-PAT assessments for any arrest prior to casedisposition. In particular, each 1-point increase in IRAS-PAT total scores was associated with a 1.70 times increase in the likelihoodof arrest. Risk estimates produced good levels of predictive validity for all outcomes, with effect sizes suggesting strong predictiveaccuracy. For likelihood of a new arrest, defendants classified at high risk were 6.61 times more likely to be arrested for a new offenserelative to low-risk defendants. Defendants classified at moderate risk were 2.31 times more likely to be arrested for a new offenserelative to low-risk defendants. For FTA, defendants classified at high risk were 7.04 times more likely to FTA during the pretrialperiod relative to low-risk defendants. Defendants classified at moderate risk were 3.11 times more likely to FTA relative to low-riskdefendantPredictorBSEAny FTAN 1030Wald C2 ORTotal ScoreIRAS-PAT0.36 0.05 62.18***Time at Risk 0.01 0.01 66.95***Risk EstimateHigh (Low)1.95 0.26 54.16***Moderate (Low)1.14 0.20 32.78***Time at Risk 0.01 0.01 65.25***Note. ‡p .10.*p .05. **p .01. ***p .00195% CIBSECase OutcomesAny New ArrestN 1030Wald C2 OR95% CIBSEAny ArrestN 1030Wald C2 OR95% CI1.44 [1.31, 1.58]1.00 [1.00, 1.00]0.33 0.05 44.25*** 0.01 0.01 54.78***1.391.00[1.26, 1.54][1.00, 1.00]0.53 0.05 125.56*** 0.01 0.01 103.99***1.70 [1.55, 1.87]1.00 [1.00, 1.00]7.04 [4.18, 11.83]3.11 [2.11, 4.60]1.00 [1.00, 1.00]1.89 0.28 46.18***0.84 0.22 14.56*** 0.01 0.01 55.60***6.612.311.00[3.83, 11.40][1.50, 3.56][1.00, 1.00[2.87 0.27 111.82*** 17.56 [10.32, 29.87]1.45 0.19 59.46*** 4.28 [2.96, 6.19] 0.01 0.01 105.06*** 1.00 [1.00, 1.00]Table 2. Logistic Regression Models of IRAS-PAT Total Scores and Risk Estimates Predicting Case Outcomes9
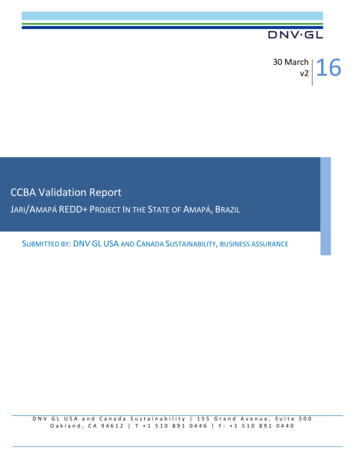
Survival Models. Survival model results are presented in Table 3. As shown, each 1-point gain in the IRAS-PAT total score wasassociated with a 1.35, 1.31, and 1.27 times greater hazard of any FTA, any new arrest, and any arrest, respectively. Across outcomes,risk levels were more discriminating in predicting the hazard of any FTA versus any new arrest or any arrest. The hazard rates fordefendants assessed at moderate risk were on average twice as high for all outcomes relative to those for defendants assessed at lowrisk. However, hazard rates for defendants assessed at high risk varied from four to five times higher than those for defendantsassessed at low risk, depending on the outcome. Survival curves by IRAS-PAT risk level and outcome are presented in Figure 4.PredictorAny FTAN 1030Wald C2 HRBSE95% CITotal ScoreIRAS-PAT0.30 0.04 61.50*** 1.35 1.25, 1.46Risk LevelModerate (Low) 0.82 0.18 21.14*** 2.27 1.60, 3.23High (Low)1.71 0.21 62.99*** 5.51 3.61, 8.40Note. ‡p .10.*p .05. **p .01. ***p .001. HR hazard ratio.BSECase OutcomesAny New ArrestN 1030Wald C2 HR95% CIBSEAny ArrestN 1030Wald C2 HR95% CI0.27 0.0440.97***1.311.20, 1.420.240.0350.92***1.271.19, 1.350.72 0.201.53 0.2313.10***43.14***2.064.621.39, 3.062.93, 7.300.661.260.160.1817.15***46.95***1.933.531.41, 2.632.46, 5.07Table 3. Cox Regression Survival Models of IRAS-PAT Total Scores and Risk Levels Predicting Case OutcomesFigure 4. Survival Curves by IRAS-PAT Risk Level and Case Outcome10
Item-Level AnalysisIn Table 3, we present results of logistic regression models of IRAS-PAT items predicting case outcomes. Across outcomes, thestrongest and most consistent item-level predictors included part-time employment or unemployment (relative to full-timeemployment; Item 4), residential instability (Item 5), three or more prior incarcerations (Item 3), and a recent history of one FTA(relative to no FTA; Item 2. Importantly, these item-level effects reflect the unique contribution of each item to the predictive accuracyof the IRAS-PAT, above and beyond all other items. That is, some items may show predictive utility on their own, but not contributeuniquely to the prediction of pretrial outcomes after controlling for other items. Age at first arrest (Item 1) and illegal drug use in thepast six months (Item 6) did not contribute uniquely to the prediction of any of the three assessed pretrial misconduct outcomes.PredictorBAge at first arrest – (33 )0.69Number of FTAs – 1 (None)0.59Number of FTAs – 2 (None)0.14Three Prior Incarcerations (No)0.45Employed – Part time (Full-Time)0.49Employed – Not Employed (Full-Time)0.75Residential Stability (In Residence 6 Mo)0.70Illegal Drug Use 6 Months (No)-0.24Severe Drug Use Problem (No)0.61Time at Risk 0.01Note. ‡p .10.*p .05. **p .01. ***p .001SE0.420.280.400.190.260.200.200.200.26 0.01FTAN 1030Wald 0095% CI0.87, 4.611.03, 3.140.52, 2.521.08, 2.300.97, 2.751.42, 3.181.37, 2.960.53, 1.171.10, 3.051.00, 1.00B0.090.77-0.260.520.630.650.77-0.200.53 0.01SE0.410.290.470.210.290.230.210.230.28 0.01Case OutcomesAny New ArrestN 1030ORWald 5**1.9113.43*** 2.170.810.813.55‡1.7052.35*** 1.0095% CI0.49, 2.451.22, 3.820.30, 1.931.22, 3.821.07, 3.281.22, 2.981.43, 3.270.52, 1.270.98, 2.961.00, 370.280.400.190.250.200.190.200.26 0.01Any ArrestN 1030Wald 2.001.0195% CI0.72, 3.121.22, 3.731.01, 4.852.14, 4.491.33, 3.631.76, 3.841.51, 3.240.53, 1.161.20, 3.341.00, 1.01Table 3. Logistic Regression Models of IRAS-PAT Items Predicting Case Outcomes11
SUMMARY OF FINDINGSOverall, several promising findings emerge from the present investigation: IRAS-PAT assessments show strong effect sizes for the prediction of pretrial misconductoutcomes. IRAS-PAT assessments predicted FTA and new arrest risk with similar accuracy IRAS-PAT items assessing employment (Item 4), residential stability (Item 5), priorincarceration (Item 3), and prior FTA (Item 2) contributed most uniquely to theprediction of pretrial misconduct items. Importantly, these findings do not suggest thatother items lack predictive accuracy or fail to contribute to the prediction of pretrialoutcomes in combination with other items. Fairly high proportions of defendants classified at moderate (40.3%) and high (61.8%)risk levels experience misconduct prior to case disposition (defined as an FTA or newarrest during the pretrial processing period).CONCLUSIONThe purpose of this report was to examine the predictive accuracy of IRAS-PAT assessments onpretrial misconduct outcomes during pretrial case processing in Monroe County, Indiana. Asnoted, IRAS-PAT assessments accurately predict pretrial misconduct outcomes in MonroeCounty and met or exceeded accepted performance standards for tools designed to assess risk ofsupervision violation and new offense (Desmarais & Singh, 2013). Assessments predicted eachindicator of pretrial misconduct used in this study (i.e., failure to appear, new arrest, and anyarrest) at nearly equivalent rates of accuracy. That is, assessments were no more or lesspredictive on any one form of pretrial misconduct than another. This finding is relevant since riskassessment tools may be better suited to forecast some outcomes better than others (Desmarais &Singh, 2013).IRAS-PAT assessments were able to identify, differentiate, and place Monroe County’s pretrialpopulation into appropriate risk classifications based on the population’s likelihood for pretrialmisconduct. Consistent with research on risk assessment tools (Desmarais & Singh, 2013),defendant risk classifications were more discriminating predictors of misconduct in comparisonto defendants’ total IRAS-PAT scores. Across each of the indicators of pretrial misconduct, asmall proportion of defendants classified as low risk engaged in misconduct (between 7% and15% of low-risk defendants). Pretrial misconduct increased among defendants classified asmoderate risk (between 19% and 48%) and grew even larger among high risk (between 35% and71%). As is to be expected from evidence-based practice (National Institute of Corrections,2009), defendants classified as high risk experienced higher rates of pretrial misconduct relativeto moderate- and low-risk defendants. Monroe County has worked to develop or modify pretrialsupervision and contact standards to ensure defendants are placed to appropriate levels of pretrialsupervision.Within Monroe County, four IRAS-PAT items were particularly unique predictors of pretrialmisconduct. These items corresponded to domains of employment, residential stability, andcriminal history. Items capturing defendants’ criminal history by age of first arrest anddefendants’ illegal drug use were not uniquely or uniformly associated with pretrial misconduct12
after accounting for the remaining IRAS-PAT items and domains. Importantly, these findings donot suggest that other IRAS-PAT items lack predictive accuracy; rather, other items do notcontribute uniquely to the prediction of pretrial misconduct outcomes.The current study is not without limitation. One of the concerns of the administration of pretrialrisk assessment tools is their ability to classify defendants regardless of race, ethnicity, or sex(VanNostrand, 2007). To examine whether the IRAS-PAT produces similar predictive resultsamong Monroe County’s demographic subgroups requires years of ongoing IRAS-PAT datacollections and disproportionate sampling techniques to generate adequate samples. Our researchdesign is unable to produce sufficient subsamples that would allow us to replicate each of thestatistical analysis reported here by demographic subgroup and draw sound conclusions about thepredictive validity of the IRAS-PAT across subgroups. Recall, the sample represents a two-yearpost-IRAS-PAT integration period of pretrial operations. The sample largely consisted ofCaucasian (79%) males (74%). The sample resembles Monroe County’s resident population byrace or ethnicity as 86% of residents are Caucasian (U.S. Census Bureau, 2019). Like mostassessments of local justice systems (see, for example, Zeng, 2019), males were overrepresentedin the sample. Half of the County’s population is male (U.S. Census Bureau, 2019). Futurerevalidations and research should monitor the predictive performance of the IRAS-PAT by race,ethnicity, sex within Monroe County and acr
Indiana Risk Assessment System - Pretrial Assessment Tool (IRAS-PAT) was adopted by participating pilot counties. This foundational study also identified barriers and facilitators to implementation and explored relationships between IRAS-PAT items, risk categories, and bond or order for release outcomes (Grommon, Ray, Sapp, & Thelin, 2017).