Transcription
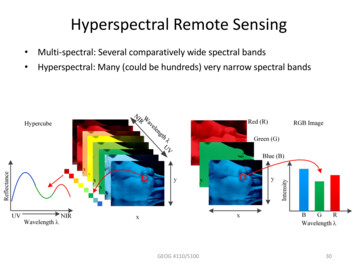
Hyperspectral Remote Sensing Multi-spectral: Several comparatively wide spectral bands Hyperspectral: Many (could be hundreds) very narrow spectral bandsGEOG 4110/510030
AVIRIS: Airborne Visible/Infrared Imaging Spectrometer 224 continuous spectral Bands 400-2500 nm Bandwitdth 10 nm Main objective is to identify,measure, and monitorconstituents of the Earth'ssurface and atmosphere basedon molecular absorption andparticle scattering signatures.GEOG 4110/510031
Hyperion 220 spectralchannels 357– 2576 nm 10 nm bandwidth 30-m resolution 7.75 km swath Flies on EO-1 12-bit dynamic range Launched Nov. 20,2000Next Generation: Hyperspectral InfraRed Imager (HyspIRI)https://hyspiri.jpl.nasa.govGEOG 4110/510032
Hyperspectral Remote Sensing Does not lend itself to conventional image viewing techniqueswith RGB color composites– Reducing 200 bands into three does not take advantage of the fullspectrum of dataGEOG 4110/510033
Radiance vs. ReflectanceThis is the average of 25 image spectra measured bythe AVIRIS sensor over a bright dry lake bed surfacein the Cuprite, Nevada scene.The spectral reflectancecurve for the sample areais actually relatively flatand featureless.The spectral reflectance ofthe surface materials isonly one of the factorsaffecting these measuredvalues.GEOG 4110/510034
Radiance vs. Reflectance Detected radiance inhyperspectral remote sensing isparticularly affected by:No atmosphere– Solar emittance characteristics asa function of wavelength– Atmospheric constituents andabsorption bands– Reflectance spectrum of surface 0GEOG 4110/510035
Calibration of Hyperspectral Data Three main considerations taken intoaccount before translation of radiancevalues into surface reflectances– Compensation for shape of solar spectrumto determine apparent reflectivity Well-constrained by models– Compensation for atmospheric gastransmittance and absorption bandswithin the atmosphere to determinescaled reflectivity Atmospheric radiative transfer models– Consideration of topographic effects Digital elevation modelsGEOG 4110/510036
Hyperspectral Remote Sensing Challenges in using hyperspectral data– Data volume Multi-spectral: 7-bands, 8-bit digitization à 56 elements Hyperspectral 220 bands, 12 bit digitization à 2640– Data redundancy Often there is little difference among neighboring spectral bands The challenge is finding those with unique information Redundant bands can be identified using the correlation matrixThe correlation matrix of nrandom variables X1, ., Xn is then n matrix whose i,j entry is thecorrelation between (Xi), (Xj).GEOG 4110/5100Ri, j CVi, jCVi,iCV j, j37
Correlation MatrixInsert Fig. 13.4x2x1GEOG 4110/510038
Spectral Angle Mapper based Classification In N dimensional multispectral space a pixel vector x has both magnitude(length) and an angle measured with respect to the axes that define thecoordinate system of the space. For hyperspectral space, sometimes there are too many dimensions andthe classifications break downGEOG 4110/510039
Spectral Angle Mapper based Classification The spectral angle mapping approach considers only the angularinformation, reducing the dimensionality of the problem by notconsidering the magnitude Spectra are characterized by their angles from the horizontal axes– Decision boundaries are set up from library information or training datadefining sectors for different classes– Spectra are labeled according to the sector in which they fall– Requires that angles are sufficiently different from one another in order todefine classesGEOG 4110/510040
Library Searching and SAM SAM is applied in multidimensional space to compare image pixel spectrumand a library reference spectrum– the multidimensional vectors are defined for each spectrum and the anglebetween the two vectors is calculated.– Smaller angles represent closer matches to the reference spectrum.– a “match” angular threshold is applied to determine whether or not a pixel falls ina particular angular class SAM represses the influence of shading effects to accentuate the targetreflectance characteristics (De Carvalho et al., 2000) SAM is invariant to unknown multiplicative scalings, and consequently, isinvariant to unknown deviations that may arise from different illuminationand angle orientation (Keshava, et al., 2002).GEOG 4110/510041
Expert Spectral Knowledge and Library Searching Takes advantage of thepresences of diagnosticallysignificant features– Absorption features thatprovide the informationneeded for identification– Requires sufficient spectralresolution for the distinction Not just identifying the dips inthe reflectance but alsoidentifying the shapes of thedips– Magnitude– Width: full-width at halfmaximum depth (FWHM)GEOG 4110/510042
Spectral mixture Mixed pixel: The signal detected by a sensor into a single pixel isfrequently a combination of numerous disparate signals. Mixed pixels are frequent in remotely sensed hyperspectral images due toinsufficient spatial resolution of the imaging spectrometer, or due to intimatemixing effects. The rich spectral resolution available can be used to unmix hyperspectralpixels.GEOG 4110/510043
Mixed pixel The mixture problem can happen in macroscopic fashion, this means that afew macroscopic components and their associated abundances should bederived. However, intimate mixtures happen at microscopic scales, thus complicatingthe analysis with nonlinear mixing effects.GEOG 4110/510044
Linear Spectral unmixingIn linear spectral unmixing, the goal is to find a set of macroscopically purespectral components (called endmembers) that can be used to unmix all otherpixels in the data. Unmixing amounts at finding the fractional coverage (abundance) of eachendmember in each pixel of the scene, which can be approached as ageometrical problem:GEOG 4110/510045
Linear Spectral unmixingPhysical constraints: Abundances are non negative (non negativity constraint) Abundances sum to one for each pixel (sum to one constraint)GEOG 4110/510046
Spectral Unmixing M the number of endmembers N the number of spectral bands fm the fraction of coverage for a particular class m where mis from 1 to M Rn is the observed reflectance in the nth spectral band wheren is from 1 to N an,m is the spectral reflectance of the nth band of the mthendmemberMRn f m an,m ξ n n 1, N m 1Where ξn is an error in band nObserved reflectance in each band is the linear sum of thereflectancesof the endmembers (within the uncertainty expressed in the error term)GEOG 4110/510047
Spectral UnmixingObserved reflectance in each band is the linear sum of the reflectances of theendmembers (within the uncertainty expressed in the error term)MRn f m an,m ξ nn 1, Nm 1In Matrix form: R Af ξWhere f is a column vector of size M, R and ξ are column vectors of size N,and A is an N x M matrix of endmember spectral signatures by column Fraction of pixel occupiedby each class 1 - MReflectance of a pixelat each wavelength" R1 % " a1,1 a1,m % " f1 % "ξ1 %' ' ' ' ' ' ' ' #Rn '& #an,1 an,m '& # f m '& #ξ n '&Spectral signature of class 1Error matrixSpectral signature of class mGEOG 4110/510048
Spectral UnmixingFor the unmixing Matrix: R Af ξWe try to find values of f that minimize ξIf we assume we have the correct set of endmembers, theequation simplifies toR AfWe solve through an error minimization using psuedo inverse(Moore-Penrose)f (AtA)-1At RFor more explanation on this minimization refer OnVectors/leastSquares.htmFor information on matrix inversions refer l-formula-for-the-inverse-of-a-3x3-matrix/Solution requires:a) the sum of the fm values is 1 andb) 0 fm 1 for all mGEOG 4110/510049
Summary: Spectral Unmixing Mixed pixels: A pixel that contains multiple classes Often we wish to distinguish sub-pixel information Examples:– Ice and water in a MODIS pixel or Passive microwave pixel– Mineral identification– Sparsely-vegetated areas– Diversely vegetated areas Mixed pixel problem not well addressed with multispectral data becausedistinctions with limited band numbers were clear to differentiate classes With hyperspectral data, enough of a distinction can be made for manysurface classes Unmixing has particular relevance for something like mineral mappingwhere abundance of minerals is desired parameter Seeks to determine the linear combination of endmembers that producethe spectral response of the pixel– Endmembers: pure cover types that are found in an imageGEOG 4110/510050
Hyperspectral Remote Sensing Does not lend itself to conventional image viewing techniques with RGB color composites – Reducing 200 bands into three does not take advantage of the full spectrum of data GEOG