Transcription
Remote Sensing of Informal Housing Settlementsin Metropolitan BangkokCurtis N. ThomsonEnvironmental Studies ProgramNatural and Mathematical SciencesRichard Stockton CollegePomona, NJ 08240thomsonc@stockton.eduAbstractIn 1988 the National Housing Authority of Thailand estimated that about 10 percentof the population was living in 1300 slum or squatter settlements (officially designated as‘congested communities) within the Bangkok metropolitan area. These settlements arelocated in a number of areas throughout the city, established on both public and privateland and are consist of a variety of housing at very high densities (30 units per 1600 sq.m.).Due to the sometimes transient nature or these communities, or the speed with which theycan develop, as well as the lack of information about the residents who occupy theselocales, it is important to update and examine these neighborhoods on a regular basis.Determining the growth and extent of these communities, however, has been a timeconsuming task as it has been done only through aerial photograph interpretation.This study tests the application of Landsat Enhanced Thematic Mapper satelliteimagery to identify, delineate, and assess the variability of land cover, associatedbiophysical characteristics, and distribution of Bangkok's ‘congested communities’.Unfortunately, digital image analysis of these sites produced spectral overlap with severalother types of urban land use, which will result in imprecise identification anddelineation. This appears to be the result of the resolution of the imagery and the lowspectral variability of this type of ground cover, in any wavelength.Keywords: urban remote sensing, slums, low-income housing
2Remote sensing of urban areasSatellite data are increasingly considered to be an essential data source for the appraisalof urban environments as they provide timely and valuable information for analyzing thelandscape. Unfortunately these landscapes are composed of diverse materials (concrete,asphalt, metal, plastic, glass, shingles, water, grass, shrubs, trees, and soil) and arrangedin complex ways, which produce spectral responses that are difficult to interpret (Jensenand Cowan, 1999). This is usually the result of land cover variability in close proximityproduces a variety of reflectance characteristics that the satellite detects. The resultingimage pixels are then comprised of different proportions of grass, trees, buildings, androads, which can be difficult to differentiate (Forster 1985; Welch 1980).Compounding these difficulties in Asia is that the patterns of land cover/land-use differmarkedly in scale from their counterparts in North America. Street layout, buildings andstructural materials, along with the size, amount and type of vegetation, make analysis ofthese places more complex. The resulting image pixels are then comprised of differentproportions of grass, trees, buildings, and roads, which can be difficult to differentiate.Most researchers have approached the task of characterizing an urban area by firstaccurately classifying the various land use types (which are a combination of land covercharacteristics), and then identify the extent of the built up area and its internalvariability. The main basis for this work is found in a variety of publications, but perhapsthe most condensed version is in Haack, et al., 1997).Identification and separation of urban-nonurban land use, with acceptable accuracy, ispossible (e.g. Jensen and Cowan, 1999). Some specific topics that have been addressedinclude the separation of urban-nonurban land use (Jensen, 1983), population estimates(Forester, 1985; Haack, et al. 1997; Lo, 1986, Lo 1995; Lo and Welch, 1977), quality of lifeindicators (Curry 1997; Haack, et al. 1997; Lo and Faber, 1998), energy demand (Sutton, etal. 1997; Welch 1980), and meteorological data (Lo, et al., 1997).In an environment similar to Bangkok, Lo (1981) has examined the capability of satellitedata for mapping land use in Hong Kong. Iisaka and Hegedus (1975) were some of thefirst to undertake population studies of urban area in their study of the Tokyo's centralbusiness district, while Murai and Mastra (1987) used satellite data to identifypreferential residential areas of Jakarta. However, there has been a notable lack ofresearch on the type of housing examined in this study. This research will determine theutility of satellite imagery to help identify and delineate housing that occurs at densitiesthat are far higher than the work noted above.Although it has been possible to identify potential sites where this type of housing mayoccur, or where sites for public low-income housing may be located (author, 2000),satellite image analysis of established housing of this type has not yet been discussed inthe literature in any detail. Part of the reason for this lack of discussion, may be due tolack of interest by scholars, but it is also likely that the coarser spatial resolution of thesensor, as well as the spectral similarity of these communities prohibits effectivediscrimination of this type of housing from other to other land cover types.
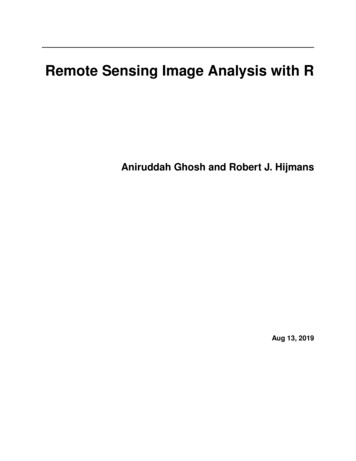
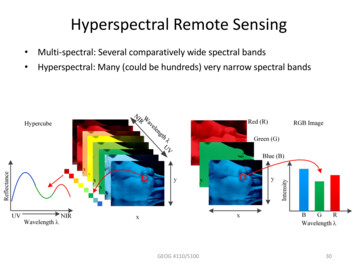
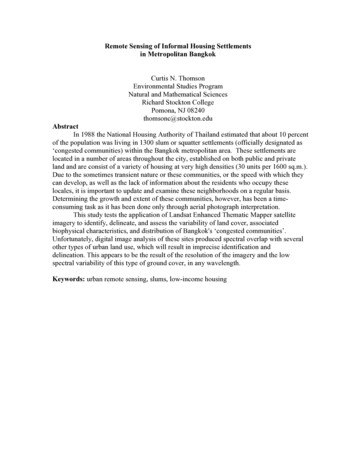
3The capability of acquiring imagery in a single overpass of the satellite and the potentialfor assisting with spectral variation of these neighborhoods, however, are two valuablebenefits that could potentially reduce the amount of time spent on performing basic tasksin detection and identification of these areas. The objectives of this study, therefore, areto determine the potential for using satellite imagery to identify and delineate Bangkok’s‘congested communities’ through multispectral image processing techniques rather thanvisual-spatial methods of aerial photo interpretation.Study AreaThe estimated 1995 population of Thailand was 57 million, with an average population growthrate of 1.7 percent (Ashakul, 1990). In 1980 about 82 percent of the population was still livingin rural areas, but the majority of its urban population resided in Bangkok, which was growingat more than 11 percent a year, and faster than any other province in the country (Dowall,1989). Between 1960 and 1986 the five contiguous provinces to Bangkok gained 4.9 millionpopulation, a compound annual growth rate of 3.6 percent; and this area is projected to reach10.87 million by 2010 (National Economic and Social Development Board, 1992).The rapid growth of Bangkok's population and economy in the past two decades, is clearlyreflected in the changing patterns of land use. Between 1974 and 1984 approximately 35sq. km. of land were converted annually from rural, largely agricultural use to urbanactivities (Dowall, 1989). Interpretation of 1989 satellite imagery (Figure 1) found that thetotal amount of land in the Bangkok Metropolitan Area (BMA) (1304, sq. km.) was about75 percent agricultural, 17 percent residential, 5 percent commercial, and the remaining 3percent designated as industrial factory sites (Chomchan, et al. 1992).
4Figure 1.Because the region is currently converting such a large amount of land into urban areas, onethird of which is housing, the urbanized portion of the BMA increased by 50 percent in thedecade (Dowall, 1992). This increased demand for housing is predominantly the result of theregion gaining about 200,000 people per year. This increase has put tremendous pressure onthe performance of the housing market, especially for low cost housing (Foo, 1992). It isestimated that between 40,000 and 50,000 dwelling units were needed each year.Over the past two decades, traditional living accommodations in the less densely populatedfringe areas of Bangkok have gradually been replaced by residential housing estate projects.However, the rapid increase in land prices in the late 1980s made housing a much moreexpensive and has restricted potential buyers to only those in the high-income bracket(Chanond, 1987). The only option open to the poor was to seek housing in slums or squattersettlements. Officially called ‘congested communities, these neighborhoods have densities of80 or more persons per rai or 15 or more houses per rai (1600 sq.m.), and housing conditionsthat are considered harmful to the health and security of the residents.Estimates indicate that there were 86 slums in 1940, 183 in 1950, 361 in 1960 and 678 in1970. This grew to about 632 slums and 108 squatter settlements in 1974, increasing to845 slums and 175 squatter settlements in 1984, and to some 1100 slums and 200settlements in 1988 (National Housing Authority, various years). As a result of the rapid
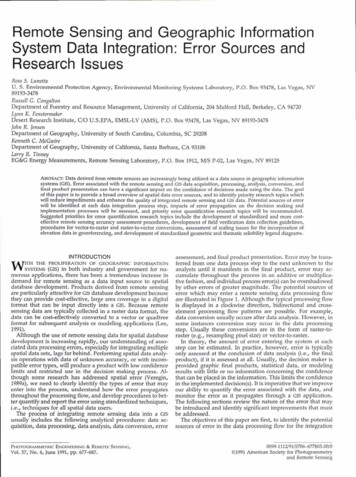
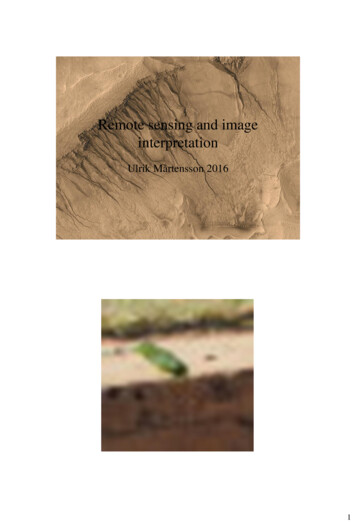
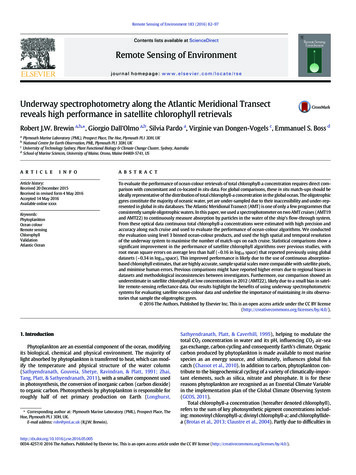
5increase of these communities and the potential difficulty in regulating or providingservices to them they are of substantial concern to local authorities (See inset photos forexamples of these settlements). Unfortunately their size, locale, densities or other factorscan make regulation of or providing serves to these areas difficult. Aerial photographyhas been of greatest value in the search of techniques to identify and monitor these sites,making it possible to calculate size, number and type of dwelling, as well as providesimple measures of housing quality. However, this process if very time consuming andobtaining suitable aerial photos is difficult, due to both the cost and restrictions placed onflying over the city.Data sets and preparationThree types of data used for this analysis, three sets of panchromatic aerial photos, a base mapof the ‘congested communities’ (derived from aerial photography) and a Landsat EnhancedThematic Mapper satellite image. The initial digital (vector) maps of the ‘congestedcommunities’ were obtained from a 1:50,000 scale map compiled from 1:15,000 scale aerialphotos taken in 1974, and updated using small format (35mm) aerial photography, with anapproximate scale of 1:12,000, flow in 1985. House counts from the photos and data fromlocal police precincts were also incorporated to produce the final map’. Additional aerialphotography obtained in 1998, but at a scale of 1:50,000 was used to confirm the existence ofcommunities identified with the earlier studies, but not to identify new sites.Aerial photosThe film used for the 1974 photos had a resolution of 125 line pairs permillimeter. Using the standard formula for calculating ground resolution from an aerialphotograph:GRD reciprocal of scale/system resolutionwhere GRD ground resolution distance (usually measures in meters) and systemresolution for aerial photographs is measured in line pairs per millimeter.Thus, when flown at a scale of 1:15,000 the 1974 imagery produces photos with a groundresolution distance of @ 0.12m. [0.6 (15000)/(125)(1000)]. Resolutions ofapproximately 0.12 meters were very suitable for both identifying and delineating theselow-income communities, as well as for assessing physical characteristics includingdwelling density, and in many cases, building materials, such as wood, zinc for roofing,and concrete- the major materials used in construction of these dwellings.The 1985 small format photos yielded a ground resolution of approximately 3.0 meters,while the 1999 photos had a ground resolution of 1.25 meters. Unfortunately, due torestrictions placed on use of the 1974 and 1985 photos, it was not possible to provideexamples of the 1974 and 1985 imagery. However, the basic information that can bedetected is apparent in the 1998 photos, which although have a relatively coarse scale of1:50,000 provide a great deal of detail if viewed using a zoom stereoscope. An exampleof the original photo and images that have been enlarged is provided in Figures 2, 3, 4,and 5. This conversion has been in order to simulate the greater detail that can be seen
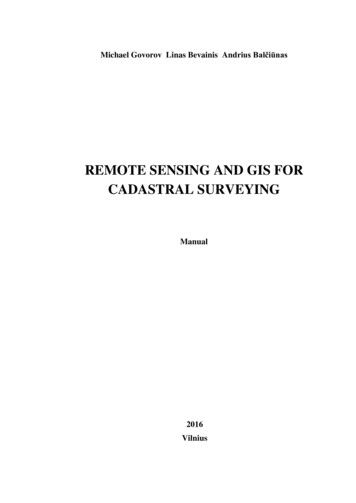
6when viewing the analog image with greater magnification. The original photo wasscanned using 150, 300, 600 and 1200 dpi.Figure 2.Figure 3.Figure 4.Figure 5.Satellite imageryComplementing the aerial photography was a Landsat Enhanced Thematic Mapper sceneacquired in December 2000. It was georeferenced to a Universal Transverse Mercator (UTM)coordinate system that produced a root mean square (RMS) error of less than .5 pixel or lessthan 15 meters. During preprocessing, the output pixel size for each of these images wasreduced to 25 meters and a nearest neighbor algorithm was used for intensity resampling.Enlarging this imagery to try and achieve a different scale is not practical as it would onlyresulting in pixel duplication, making the image appear more coarse. In addition, a generalspatial resolution rule for imagery comprised of pixels is that there needs to be a minimum offour pixels within an urban object for identification (Cowan et al., 1995; Welch, 1982). Thedifferences in ground resolution between the 1200 dpi aerial photo, the 15-meter panchromaticimage, and the 25-meter false color multispectral image are shown in Figures 5, 6 and 7.In order to extract multispectral information from each community, the digital vector mapof the communities was overlaid upon each of the satellite images (Figure 8). Because ofthe potential slight misregistration errors resulting from the various errors that could beproduced from the base map compilation, georeferencing of the satellite image, andregistration of the map to the satellite image, only those pixels that were at least one pixelinside the boundary of any community were used for this study. This would theoreticallyensure that the digital value any pixel in a community would be a result of only the site ofinterest and not border or mixed pixels along the periphery.
7Figure 6.Figure 7.The area of Bangkok that was examined for this study consisted of 1304, sq. km., although the‘congested communities’ account only 2.1 percent of the total land use. The last verified studyto assess the amount of various types of land use in the region (Chomchan, et al. 1992),determined that in the early 1990s, residential areas occupied about 17 percent of the land usein the city, although a current study by the author is suggesting that residential land use in thisregion now accounts for around 23-25 percent of the area. Which ever estimate of residentialland use one uses, the fact that only 2 percent of land is given to these communities isremarkable given that published estimates of the proportion of the population living in this typeof housing ranges from a low of 10 percent (NHA) to over 25 percent (Setchell, 1992).Figure 8AnalysisIdentification and delineation of the ‘congested communities’ from aerial photographs (as seenin the previous figures) was not a complicated process, however, it was very time consumingas land cover/use had to be interpreted individually from each photo. In addition, the inability
8to automate the process so that many photographs can be examined simultaneously makes theprocess more tedious. Satellite image analysis may overcome some these problems as an entirescene can be examined in a relatively short amount of time and once known reflectance values(spectral signatures) for specific types of ground cover are identified, the process can beautomated for use with larger areas as well, and with additional scenes. The only majordrawback is the relatively poor ground resolution that can be obtained, compared to the aerialphotograph. This issue, however, is mainly important for visual analysis of an image, while thedigital satellite imagery provides an exceptional method for concurrently examining multiplewavelengths, many of which cannot be detected on film.The techniques for performing this analysis are statistical transformations of the digital data. Thefirst step in this process is examining the spectral variability of the scene, and then derivingsuitable ‘training sites’ that can be used to allocate all pixels to a specific cover type (class).Spectral VariationClustersThe most important value of the satellite image is not for visual examination, but toconduct multispectral analysis. This was done using an unsupervised clustering routine(ISODATA-Iterative self-organized data analysis technique, using a minimum distancealgorithm.) applied to all reflective bands of the multispectral image. Each pixel wasallocated to one of 50 groups (the number of groups is arbitrarily chosen as this routine isusually performed using a large number of groups (@100) and then a smaller number ofgroups in order to determine how much spectral variability is found within a given scene.Through considering differences in spectral clusters that are produced using both the higherand lower figures, the analyst determines a suitable number of clusters that adequatelyrepresent the spectral variation in the scene for the purposes of the study (Figure 9).
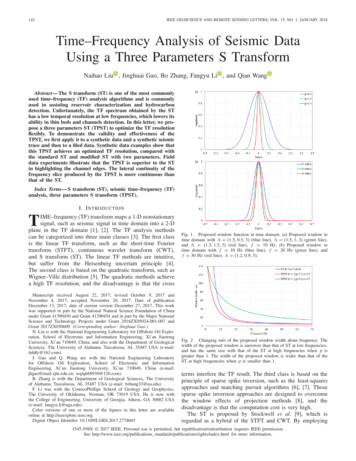
9Figure 9The results provide an informative summary of spectral variation within in the city. Inorder to assist with interpretation of this image, a bivariate scatterplot of these clusterswas constructed (Figure 10). Two of the 6 reflective bands that help in distinguishingthe greatest amount of spectral diversity in the scene were used to portray the variation ofthese clusters in two dimensions. The contrast between the red and near infraredwavelengths not only help to distinguish vegetation, but a large amount of literature overthe years has discussed how the amount of soil and vegetation cover portrayed in this
10graph can be quantified and characterized (e.g. Deering, et al., 1975; Kauth and Thomas,1976; Rouse, et al., 1973).120Lawns100Rice fields with stubbleLight Concrete80Near InfraredMix of grasses, trees,and inert materialsLight colored soils60Tall mature treesSoil Line40Shop HousesWater200020406080100120140RedFigure 10At the lower left corner of the graph, below the hypothetical soil line are clustersrepresenting varying amounts of moisture and/or dark bare soil. Moving up and to theright, along the line, are clusters that represent material that is more reflectance in boththe Red and NIR wavelengths and which has decreasing amounts of moisture. Clusterthat are found the left the soil line are clusters that represent increasing amounts ofhealthy green vegetation as one moves further from the line.Further examination of these clusters showed that they represent several groups of landcover. The group of clusters to the lower right of the soil line represents water, particularlythe river. Three clusters representing the materials used in constructing shop housing arealso found near the soil line at the less reflective end of the spectrum, while other concretestructures and roads, as well as dry soil, are found at the bright reflective end of the soilline. Trees are represented by the group of clusters found in the less bright portion of thespectrum moving toward an increase in greenness, while vegetation not as tall but withgreater ground cover, is represented by clusters found at the brighter and greener portion ofthe figure. In between these two groups, tall trees and shorter vegetation, are clusters thatrepresent ground cover with varying proportions of trees, shorter vegetation and inertmaterial used in housing construction. Spectrally unique clusters, the ground cover ofwhich does not appear to be similar to any of the other clusters, are fallow rice fields, andgrasses with a high percentage of ground cover (lawns).Spectral analysis of ‘Congested’ CommunitiesThe spectral values for those pixels corresponding to the ‘congested’ communities werenext examined. The vector map of the communities was used as a templet to extract only
11those pixels that fell within each community. Spectral variability of these pixels was thendetermined using the Isodata technique. These clusters were ultimately narrowed down to9 specific signatures that fell into 2 main categories of land cover, inert materials thatcover a range of soil types from light to dark and a combination of inert materials andvery sparse vegetation (associated with medium to high density housing).Figure 11 is the bivariate scatter plot, using the same Red and Near Infrared bands, for the9 signatures for the ‘congested’ communities. The plot shows how close the clusters fall tothe hypothetical soil line that runs along the diagonal from lower left to upper right. Themost obvious aspect of this distribution suggests a general lack of vegetation within thecommunities, which is not surprising as previous figures of these communities show almostno vegetation present, except for sparse amounts along the periphery of some communities.A second notable aspect of the plot is how the distribution of clusters is distributed over alarge range of the ‘hypothetical’ soil line that runs diagonally from lower left to upper rightin the image, suggesting that reflectance of these communities has a similar distribution ofinert surfaces from dark to light.70960650Near Infrared85440372130Soil Line2010001020304050607080RedFigure 11Unfortunately, there is no two-band combination that portrays any great variation of thesesignatures, which can be interpreted in a meaningful way. While ground cover for theany image is usually a combination of a multitude factors related to varying proportionsof building materials, soil, vegetation, and water, these ‘congested communities’ arepredominantly covered by either building materials or bare ground, with dwellings
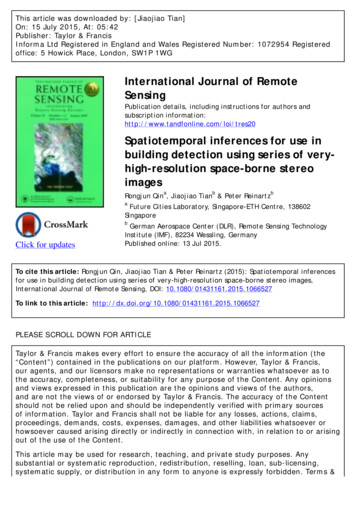
12occupying over 80 percent of the ground surface. This lack of biophysical variationresults in minimal amount of spectral variability for the communities.Due to the lack of suitable aerial photography, it was not possible to determine theground cover constituents associated with each signature. The spectral signatures of thesecommunities were compared with other types of known land covers in order to determinethe potential for distinguishing these communities from other types of land cover in amultispectral classification. As previously mentioned, ground cover of the communities iscomprised of varying proportions of building materials and bare ground. The materialsused for building are predominantly wood or concrete for the basic structure and wood orgalvanized zinc sheets for roofing. Furthermore, as the galvanized metal ages, it alsobecomes covered by dust and will oxidize, turning slightly red over time.The roofs of the dwellings in these communities would be the most important componentin determining spectral reflectance that aerial or satellite imagery would detect, while bareground, shadow, and the sides of the structures (in that order) would be much smallercontributors.Each of the 9 spectral signatures was compared to ground cover types that were used toclassify the entire image of the city. This comparison would help to determine thelikelihood of separating the ‘congested’ community signatures from spectral reflectanceof other land cover in the city. The nine clusters could be allocated into two categories,the first was comprised of a mix of land cover types (including some sparse vegetation)while the second was comprised of inert materials. Figure 12 shows the spectralreflectance for the six ‘mixed’ signatures, while Figure 13 depicts the signatures for thethree signatures for inert material in the same wavelengths.
1312010080Digital ValueCluster 1Cluster 2Cluster 360Cluster 4Cluster 5Cluster 640200GreenRedNIRMIRMIRFigure 12The six ‘mixed’ signatures showed an important distinction that was not present in threeinert signatures, either a leveling in reflectance between the Red and NIR wavelengthsthat is not present in the three inert signatures, which show a marked decline. In order tomore effectively interpret the distinctions between these signatures they were comparedto reflectance values of known ground covers.
14120100Digital Value80Cluster 7Cluster 860Cluster 940200GreenRedNIRMIRMIRFigure 13Table 1 is a comparison of the mean reflectance value for each of the nine communityclusters to one or more of the known land covers. Signature 1 is similar to darker moistsoils that are found in areas of the city with a high water table. Signatures 2 and 3 aresimilar to the longest established areas in the core of the city, where asphalt is used forroads or the concrete has been darkened through wear. Signature 4 is similar to bareground with lighter soils and with very sparse vegetation 15% ground cover. Signature5 is similar to the medium density areas of the city with larger homes, and some treessurrounding homes where vegetation is not established and there is a high proportion ofbare ground. Signature 6 is also similar to a high-density urban area where concreterather than clay based building materials dominate.The three signatures for the inert materials are basically similar to the bright reflectivesurfaces from newer concrete and metal. Both signatures 7 and 8 are very similar tonewer concrete while signature 9 is most similar to industrial areas where metal roofedwarehouses dominate.Further comparison of these mean digital reflectance values and the standard deviation ofeach signature revealed that there is essentially no difference between the informalsettlement signatures and these other land cover types. In digital image processing it isimportant that a there be a notable difference in the values from at least one of thewavelengths in order to distinguish one land cover/use from another, which is not presentfor the settlements.
15Table 1Cluster 1Bare moist groundWavelengthGreen Red NIR MIR MIR17.67 29.80 30.96 53.20 32.1119.81 33.95 38.92 65.01 29.26Cluster 2Roads in older urban areas19.34 32.86 33.8620.05 34.44 32.9964.44 39.8261.38 37.63Cluster 3High density urban-city core20.79 35.32 37.7722.96 39.57 39.0875.45 46.0876.26 46.28Cluster 4Bare ground, very sparse vegetation22.51 38.06 40.1825.2 41.56 42.9259.59 33.9866.04 29.94Cluster 5Medium density urban areas24.96 43.01 42.2625.45 45.07 46.9585.22 52.3593.01 54.38Cluster 6High density urban-concrete materials31.34 55.80 53.69 100.17 58.8233.12 58.87 56.15 94.66 53.72Cluster 7High density urban-concrete25.28 43.33 38.0422.96 39.57 39.0870.19 44.0076.26 46.28Cluster 8Newer roads in suburbs32.12 55.46 48.7729.76 51.99 47.9881.59 49.4077.86 45.42Cluster 9Metal roofed buildings-warehouses42.96 75.75 61.88 109.76 65.7645.18 79.99 65.07 115.38 68.72The result of this examination is that due to the very similar spectral characteristics of theinformal settlements to the more dominant land cover types within the city, theseneighborhoods are not sufficiently ‘unique’ so as to distinguish them from other land covertypes using only their spectral criteria. The basic biophysical factors related to thiscondition were not tested due to a lack of suitable imagery, but the most apparenthypotheses, which bears further examination, is that at 25 m, a single pixel covers an areaequivalent to over 6 dwellings, and the spectral variability of this type of ground cover haslow variability in any wavelength. It is also possible that using the newest 1m resolutionIkonos imagery, it may be possible to detect smaller areas, which can detect spectralvariation between dwellings, rather than just a composite signature from many units.ConclusionWhile multispectral image classification has proven to be a valuable addition todistinguishing a variety of urban land cover, the potential for this technique to be of greatvalue for the identification and delineation of very high density housing is not supported
16using only spectral information, at least when the spatial resolution of a pixel is largerthan a dwelling. At present, it appears that manual interpretation of aerial photographs isstill the most effective means for identifying these communities.BibliographyAshakul, T. (1990) National Urban Development Policy Framework Study, BackgroundReport No. 2-2, Regional and Provincial Urban and Rural Population Predictions,Bangkok: Thailand Development Research Institute.Bangkok Metropolitan Administration (1990) List of Urban Slums, in mimeo.Chanond, C. (1987) Recent changes in the land market on the Urban Fringe of Bangkok ,Working Paper 6. Bangkok: The Bangkok Land Management Study and PADCO.Chomchan, S., S. Silapacharanan, W. Peerapun, T. Chongpeerapien, 1992. Land UseDevelopment in Bangkok and Major Cities: Directions and Problems. In NationalUrban Development Policy Framework Final Report Vol. 2 Bangkok: Office of theNational Economic and Social Development Board.Cowan, D.J., J.R. Jensen, G. Bresnahan, D. Ehler, D. Traves, X. Huang, C. Weisner, AndH.E. Mackey, 1995. The Design and Implementation of an Integrated GIS for EnvironmentalApplications, Photogrammetric Engineering & Remote Sensing, 61:1393-1404.Cowen, D.J. and J.R. Jensen, 1998. Extraction and Modeling of Urban Attributes UsingRemote Sensing Technology, People and Pixels: Linking Remote Sensing and SocialScience, National Academy Press, Washington, DC. Pp. 164-188.Curry, M.R., 1997. The Digital Individual and the Private Realm, Annals of theAssociation of American Geographers, 87(4):681-699.Deering, D.W., J.W. Rouse, R.H. Haas, and J.A. Schell, 1975. “Measuring Forageroduction of Grazing Units from Landsat MSS Data”, Proceedings of the 10thInternational Symmposium on Remote Sensing of Environment, 2:1169-1178.Dowall, D., 1989. Bangkok: A Profile of an efficiently performing housing market.Urban Studies Vol. 26:327-339.Dowall, D., 1992. A Second look at the Bangkok Land and Housing Market. UrbanStudies Vol. 29 (1):25-37.Foo Tuan Seik, 1992. Low-Cost Condominiums: A Viable Alternative for Housing theUrban Poor? A Case Study in the Northern Corridor of Bangkok. Bangkok: Division ofHuman Settlements Development, Asian Institute of Technology.
17Forster, B., 1985. An examination of some problems and solutions in monitoring urbanareas from satellite platforms. International Journal of Remote Sensing 6(1):139-151.Haack, B., S. Guptill, R. Holz, S. Jampoler, J. Jensen, and R. Welch, 1997. Chapter 15:Urban Analysis and Planning, Manual of Photographic Interpretation, American Societyfor Photogrammetry & Remote Sensing, Bethesda, Maryland, pp. 517-553.Iisaka, J. and E. Hegedus,
Remote Sensing of Informal Housing Settlements in Metropolitan Bangkok . has been of greatest value in the search of techniques to identify and monitor these sites, making it possible to calculate size, number and type of dwelling, as well as provide . when viewing the analog image with