Transcription
Remote sensing and imageinterpretationUlrik Mårtensson 20161
2
3
4
5
CV Mapping energy forest in Sweden Topographic map production in Sweden andthe US for orienteering and recreation sites Photographer at LU Land suitability mapping in Pakistan Coastal zone sensitivity in Thailand andVietnam Soils and erosion sensitivity in Nigeria Forest fires in Syria Roll callSchedule – three days vacationLast year evaluation – more theoryGrading – written exam?Learning objectives and goals– Independancy– Own initiatives– Self discipline Practicalities – field trips, organise work Course philosophy - What do you need toknow?6
Electromagnetic radiation All bodies with a temperature above –273 C (0 K) emitenergy A blackbody reflects no radiation. It absorbs all radiationand re-emits it Emissivity (x) [M/(Mb)]where M is the emissivity of an object and Mb is theemissivity of a blackbody with the same temperatureElectromagnetic radiation Two models of explanaition1 Wave modelElectric fieldMagnetic fieldC Speed of light7
Wave length and frequencyWaves behaves as:c v Wherec speed of light (3x10⁸m/sec)v frequency (undulations per second (Hertz, kHz, MHz) wave length (nm mm, mm, m)Wave length wavelength (distance betweentwo wave peaks) frequency (number of cycles p assinga fixed point per unit time)8
Electromagnetic radiationWave length ( )Distance from a given point in the undulationcycle to the same point in the next cyclem 10-2 mm 10-3 mm 10-6 mm 10-9 mcm 0.01mm 0.001mm 0.000001nm 0.000000001Visible light0.40UV-3100.50blue-2100.60green-1100.70red1 3(mm) NIR10210Near-IR3(mm) RadarTelevisionRadioX-rayGamma rayUltra-Violet10Thermal IR9
WavebandsOptical wavebands 0.2 μm – 15 μmUVVisibleReflected IRNear IR (NIR)Middle IR (MIR)Thermal IRFar IR (FIR)0.01 μm – 0.4 μm0.4 μm – 0.7 μm0.7 μm – 3.0 μm0.7 μm – 1.3 μm1.3 μm – 3.0 μm3.0 μm – 15 μm15 μm – 1000 μmElectromagnetic radiation2 Flow of particles (photons)Energy moves as photons or quantumThe energy of a photone, E hvwhereE energy in Jouleh Planck’s constant, 6.626 x 10⁻³⁴ J.secv frequency (Hz)10
Electromagnetic radiationHigher frequency More energyHigher frequency shorter wave lengthc v Stefan-Boltzmann’s Law:M T4where M is the total amount of radiatedenergy from the surface of an object (W/m2), is the Stefan-Boltzmann constant(5.6697 10-8 W/m2/ K) and T is the absolutetemperature ( K).11
Wien’s Displacement Law m A/Twhere m is the wavelength with maximumradiation, A is a constant 2898 mm ºK) and Tis the absolute temperature (ºK) of the object.SRE (W/m2 / mm22 8mmmmm10Visible radiant energy bandBlackbody radiation atsun's temperatureo6000 K107o4000 K101010Blackbody radiation atincandescent lamp temperature6o3000 K5o2000 K4o1000 K1010103Blackbody radiation atearth's temperature2o500 K1o300 Ko200 K10.1110100Wavelength (mm)12
Radiation in the atmosphereSome radiation isreflectedSome wavelengthsare completelyconsumedby gasesScattering is the diffusion ofincident radiationAbsorption consumespart of the radiationSelective scattering: Rayleigh (of UV and blueshort wavelengths, particels smaller thanwavelenght) and Mie (ca 5 – 100 μm causedby particles of smoke, fumes and haze ofapprox. same sizes as wavelengths of lightbeing scattered)Rayleigh scatter Partikelkonc/λ413
Non-selective scattering: caused by dust, fog andclouds of particle sizes 10 times wavelength oflight. Scatters all wavelengths equally.Absorption of radiation causing depletion, by O2, N2,O3, CO2 and H2O in many atmospheric absorptionbandsAtmosphere windows100Transmission (%)Radiation absorbersH 2O80O3CO2H2OCO2O3CO2H2O60402000,1110100Wavelength (mm)UVVisibleNIRTIR14
Atmosphere windowsImportant atmospheric windows are0.3 - 1.3 mm Visible, Reflective IR1.5 - 1.8 mmReflective IR2.0 - 2.6 mmReflective IR3.0 - 3.6 mmThermal IR4.2 - 5.0 mmThermal IR7.5 - 14.0 mmThermal IR123456Remote sensing in Lund Started with cave paintingsWorld leading 1980-1990Stagnated but stable 1990-2005New ground 2015Weaknesses are radar andhyperspectral MSc – Underwater RS, Unmanned15
Aerial PhotographsHow are they made?Remote Sensing Collect data about Visible– Invisible Production of thematic maps, topography Frequent data sourse for GIS16
Remote Sensing Elektromagnetic radiation Different sensors – different radiation types (wavebands) Different platforms: Balloon, airplane, helicopter,satellite, space shuttle, space station, ship, masts, tower,car, hand held. Different time and date, change studiesphotographicAerialphotographsRemote sensing:sensor basedsatellite data17
photographicAerialphotographsRemote sensing:Activesensor basedsatellite dataPassivePhotographic Remote Sensing Image interpretation Photogrammetry18
Aerial photo history PhotographyBalloonAircraftNew film emulusionsSatellite platformsDigital Photography (sensors)18371856 (1893)19151930-4019601980What is needed? CameraLensSensor/FilmAircraft (platform)(Flash)19
Airplane cameras Two categories of camera– Metric with strictly defined geometricattributes, used for mapping– Non-metric, used for reconnaissance andinterpretationMetric cameras152.xx mm wide angle lens with 23 x 23 cmformat88.xx mm Super-wide angle lens with 23 x 23cm format– Filter fitted to allow broad or narrow spectralband photography– Detachable magazine of capacity 200 - 1000 feetlength of film– In rotatable mount, sometimes ingimbals, to ensure verticality ofcameraaxis when film is exposed20
Metric camerasLEICA RC-30 cameraFilm magazinePeriscope sighting andintervalometer forspacing photographsLight-tight camerabodyLight-tight lens coneand shutterNon-metric cameras Non-metric: short focal length, small formatcamera, small capacity magazine– Filter fitted– Same range of film types– Mounts for four cameras with different film/filtercombinations, triggered simultaneously21
Verticalimage,measurableObligueimage, notmeasurableFilm types Ortochromatic Panchromatic IR-black/white22
Film types Colour IR-colour23
?24
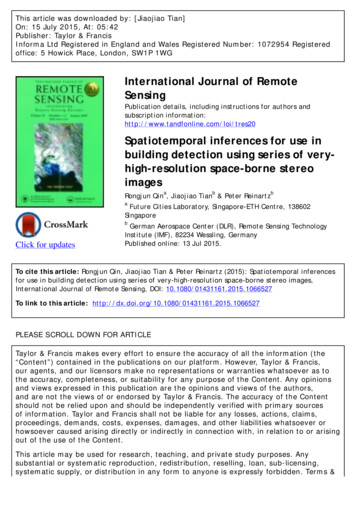
Why IR-sensitive?Reflectance (%)605040Senescent leaves3020Yellowing leaves10Green leaves0.61.0visibleNIR1.41.82.22.6Wavelength(micro meter)MIR25
Why colour film? Regular colour film – objects aredepicted as we are used to see them(in colour) 20 – 120 shades of gray 20000 – 120000 colours and shadesFilmB/WColourIR B/WIR-colour50-125 lp/mm40-50 lp/mm50 lp/mm32 lp/mmApproximately 0.3 m for B/W and about 1.0m for IR-colour in scale 1:3000026
Film B/W Good geometric resolution, cheap Colour Better spectral resolution, but lessgeometrical, less quality on high altitude IR-B/W OK geometric resolution, certainpenetration in haze, harsh shadows IR-färg OK spectral resolution, hazepenetration, good for vegetation mapping, harshshadows, very treatement sensitive, expensiveSensors Geometry sensor controlled Record in 4 bands Visible normally higher geometricresolution – WHY? Combine panchromatic mode with IR Orthographic projection standard27
1938, scanned from negative, 1 m, panchromatic1989, scanned from negative, 1 m, panchromatic28
2007, scanned from positive, 1 m, colour2010, digital camera, 0.25 m, colour29
2010, digital camera, 0.25 m, IR-colour2010, digital camera, 0.25 m, IR-colour, contraststretched and saturation increased30
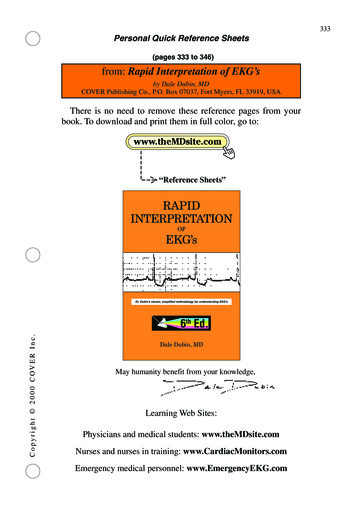
1 m, 2007,colour0.25 m, 2010,colour0.25 m, 2010,IR- e0,8NIR1,2Wavelength (μm)31
Different combinations of the 4 bandsgives different appearances and enhancedifferent objects, contrast stretched IRefficient for variation in vegetation statusColour and IR-colourwith different level ofcolour saturation32
Dead treePink flowers on Japaneesecherry ity33
34
35
Digital images Satellite sensors Airborne radiometers Digital aerial images–––––Scanned aerial photographs from negativesFixed geometrical resolution, pixelOften 256 gray levels (8 bits)Today digital aerial camerasArchiving an issue36
Image quality Camera Lens Image carrier (film or sensor) Atmospheric conditionsGeometry Airphotos are a photographs, NOT a map Scale vary with flight altitude and terrainelevation, indicative scal on photo isaverage on reference level Central projektion, projection centre Radial displacements increase with distancefrom image centre Difference in elevation generatedisplacements that can be used formeasuring elevation37
Film or sensor planeLens and projection centre38
Stereo model General photography 60 % overlapTwo viewing anglesThree dimensional, virtual imageStereoscopeAnaglyphPolarisationBlinkStereo model Measurements in aerial images developedafter WW1- Photogrammetry All topographic mapping done ever since Improves interpretation results, e.g.shadowed areas, shapes and topography39
Photogrammetry Ortho-photo maps– Rectification and correction of image to adjustto a map reference system, uses computerassistance– Priviously use optical-mechanical instrumentsfor this, e.g. stereoaviographs as A8, B8 Rectification require access to GroundControl Points (GCP’s) with known x, yoch z-coordinates ”Rubber sheet”, 2nd and higher orderpolynoms to adjust positionsAerial photography history First vertical image in Sweden 1920ies First national cover 1957/58, 10000 m Most countries in the world 1950-1960 National cover IR-colour 1978-88 (4 600 inthe south, 9200 in the north40
Aerial photography history ”Omdrevsfotografering” 1961, 4600 m, scale1:30000, s/v, 5th year in the south, 10th year in thenorth, 7x7km on film 23x23 cm, 60 % overlap inflight direction and 10-15 % sideways Later also 3000 m (mid altitude, colour, 1:20000),9200 m (high altitude, 1:60000), 13200 m (extremehigh altitude, 1:150000, 4:e år från 1984) och colourand IR-colour Consulting, on demand, national and international,also extreme low altitudes 1500-600m Currently also commercial actorsOmdrevsfotografering Thematic mapping (vegetation, soils,geology) Physical planning Topografic mapping Up-dating existing maps Environment, agriculture, forestry Flight path maps and image information,Survey Department, National MappingAgency (LMV)41
Image informationScale h/c true length/length in imageh flight altitude, c camera constantImage interpretation andinformation content in aerialphotographs42
Photo interpretation Intuitive analytic process Experience important Thematic knowledge of the features tointerpret Field experience Craftsmanship”ish” process Orthophoto interpretation on screen mostcommon, sometimes supported by analoguestereo imagesImage interpretation processThe interpreterThe stereoscopePhoto copyingFilmApertureLensFiltersScattering andabsorptionObject43
Image interpretation process Incoming radiation characteristics Reflection characteristics of theobject Image quality The interpreter’s skills and abilityImage interpretation process1.2.3.4.5.6.7.8.9.Study existing informationSelect image material depending on purpose andscale for presentationCreate an interpretation key, what should beincluded and how it looks like – definitions,including smallest mapping unit (area, width,length)Collect training dataIdentify object, classifyQuantify, e.g. vegetation cover, surface boulderstree crown coverCollect evaluation dataCalculate map accuracyProduce final results and reports44
Interpretation Colour and toneShape and textureGeometryPlacement and contextAdditional informationColour and tone Many object are very similar Many object present seasonal variations,due to e.g. phenology and humidity Many object looks different in differentenvironments45
Shape och texture Natural shapes often not exactly similar Texture relative wave lengths Texture and patterns could be important clues,such as right angles imply human influence Many shapes together gives connections that couldsupport interpretation, e.g. a river will end in adelta Shadows help interpretation of features with avertical extention (such as trees)Image geometry (non-digital images) Obstruction generated by central projection.Most important towards edges Larger image overlap reduce problem (twoviewing angles) Same sized objects may appear different in sizedue to variations in scale due to e.g. topography Stereo imaging normally increase interpretationaccuracy Elevation exaggeration improves estimation ofobject height46
Placement and context Where in the landscape – wet land on a hilltop? How relate to other objects – farmland inthe city? Environment indicators – bed rock in thesurface Exceptions exsist – riding range in the city– grazing land? Climate (placement) could rule out certaininterpretations – trees in the desert?Additional information ?47
Reflection characteristics of different objectsCritical role of reflectors, which aredistinguished theoretically asa) Specular: flat, mirror-like surfaceb) Diffuse: (rough) surfaceMost actual earth surfaces fall between the twoofollememccrfarfaerrreReflection characteristics of different objects Knowledge of energy/target interactions iscentral to effective use of remote sensing In visible and reflective IR portions ofspectrum, knowledge of spectralreflectance is the key48
Reflection characteristics of different objects Detection of Incoming short wave solar radiation 99 % radiated energy between 0.2 - 5.6 mm 44 % between 0.4 - 0.7 mm Longwave terrestial radiation emitted overbroad range from 5.0 mm : also by atmosphericgases and heatedobjects on groundReflection characteristics of different objectsAlbedo: averagepercentage of incidentradiation reflected Fresh snow 80-85% Old snow 50-60% Asphalt 5-10% Water (sun nearhorizon) 50-80% Light soil 25-45% Deciduous forest 1520% Coniferous forest 1015%49
Reflection characteristics of different objects Albedo values are generalisations Albedo values disregard variations inreflectance with wavelength ( ) Each sensor functions in one or morenarrow parts of the E-M spectrum Thus important to know value ofreflectance at specific Reflection characteristics of different objects Many variablesaffect reflectancee.g. with trees: Species Texture/colour ofexposed leaves Morphology of treecrown Health of tree Spaces betweentree crowns Spectralcomposition andintensity of light Atmosphericconditions50
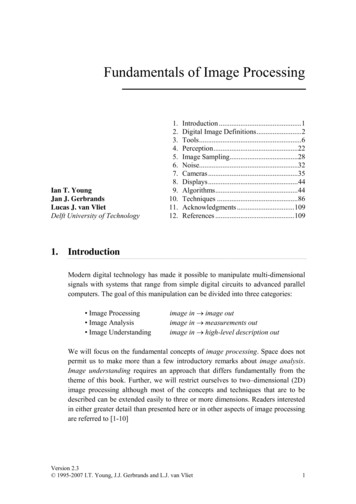
Reflection characteristics of different objects– Soil type andmoisture– Relief and drainage– Slope and aspect– Weather conditions– Date and time ofobservation– Direction ofobservation relativeto illuminationReflection characteristics of different objects100Reflectance (%)water absorption8060dry soil40green Wavelength (mm)51
Reflection characteristicsInfluenced also by: Shadows Light distribution Time for photographingShadows Aerial photography is avoided when thelength of shadows are over 1.5 times theobject height Shadows obscure vision Shadows alters colour charateristics (reemitted radiation from the atmospherecontra direct sun light) Could revail shape of e.g. a tree crown52
Light distribution View angle related to light source angleyeald different reflection characteristics(looking on the shadow or sun side of anobject) Topografy also influence Shadow from clouds Mirror reflex over saturated imageTime for photographing Time of the day controls shadows, lowangle could be useful for acheologicapplications Time of the year––––Different lightDifferent phenological developmentVegetation or no vegetationSnow and ice53
1. Spring, before leaves develop, groundvisibility, topography soils,geomorphology, humidity variations, clayis speckled, organic soils, field cover,decidious trees on trunk and branchshapes2. Spring, after leaves developed. The actualtiming of leaves break out can be used todifferentiate species and decidious andconifers3. Summer, limited vision, dense vegetation,few shadows, good for open areas andcultivated areas, from August goodseparability Spruce-Pine, watervegetation, algae blooming4. Autumn before leaves are falling,decidious-conifer separation, also SprucePine separation, after harvest – soils andhumidity in cultivated areas, IR – forestdamages54
5. Autumn, after leaves have fallen, dark,heavy shadows, archeology applications,similar to early spring6. Winter, military applictions? SnowmappingVegetation55
Conifers Easy seprable in scale 1:10000 – crownshape Difficult in 1:30 000 Best spring before new branches on sprucein spring Shadow crucial for separability Wave bands 1.3 – 3.0 μm best forseparation of speciesDecidious forest Ash – like oak but more and thinner branches Birch – very thin fine crown, slim and distinct Beech – broad, flat crown, regularly shapede,often in single stand forest Oak – broad crown, few but thick branches thatgives and irregular shape, shadow on open ground Mixed decidious forest ”Noble decidious forests” Oak, Beech, Ash; Elm,Fagus56
Open Cultivated immense number of cropsimpossible to separate, field contactimportant, climate zone helps Patterns important, square angles –cultivated if smooth, could be grazed iftrees and stony After harvest – naked soil, good for soilmapping Wet lands – humidity visibleSoils and Geology Multispektral recording often better Humidity reduce reflectance Dry soils have higher reflectance in longerwave bands ( ) Texture - ytskrovlighet (surface roughness),fine texture gives higher reflectance Organic content, iron oxides, etc.57
Soils and Geology Both soils and geology – lots of indirect indicators Drainage pattern – karst under ground, patternindicators for fissures and weaknesses Drainage density Fissures, faulting and tectonics Basement complex difficult to separate type ofrock Basement complex and sanstones often softershapes, limestone and shale sharper Vegetation important indicator Possible to map borders without deciding on type(needs feild check)Soils and Geology Early spring and late autumnGeomorfology – shapes importantGeometric resulution importantProcesses are indicators for soils, e.g. slideangle in clay is steeper than for silt or sand,dunes are sandy material, etc. Cultivated or grazed, clayey moraine orsandy stone moraine Stone fences indicate moraine58
Water Water has low reflectance between0.4 - 0.8 mm. No reflection 0.8 mm (all absorbed) Quantifies atmosphere influence Detect pollution as algae bloom, sedimetsload, oil spillSPECTRAL REFLECTANCE Flygbildsteknik och Fjärranalys. Avery and Berlin. 1992. Fundamentals of Remote Sensing andAirphoto Interpretation (Toronto: Maxwell MacmillanCanada) Ed. 5. Ch. 2 Swain and Davis. 1978. Remote Sensing: The QuantitativeApproach (New York: McGraw-Hill) Ch. 5 by R. Hoffer Kalensky and Wilson. 1975. Spectral signatures of forest trees.Proceedings, 3rd Canadian Symposium on Remote Sensing.155-171.59
Remote sensing in Lund Started with cave paintings World leading 1980-1990 Stagnated but stable 1990-2005 New ground 2015 Weaknesses ar