Transcription
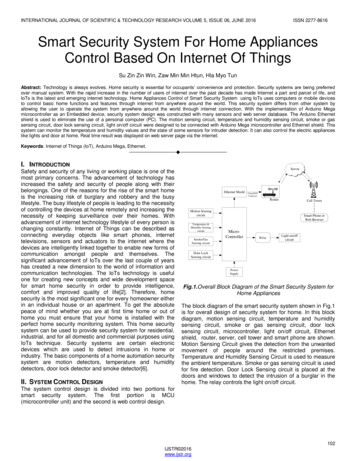
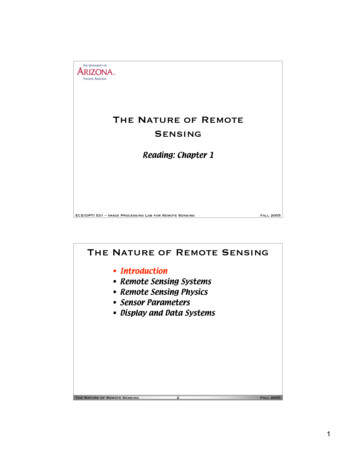
The Nature of RemoteSensingReading: Chapter 1ECE/OPTI 531 – Image Processing Lab for Remote SensingFall 2005The Nature of Remote Sensing IntroductionRemote Sensing SystemsRemote Sensing PhysicsSensor ParametersDisplay and Data SystemsThe Nature of Remote Sensing2Fall 20051
Definitions Remote Sensing “Measurement at aDistance” This course is aboutEarth remote sensing– Airborne or satelliteplatforms– Optical region of thespectrum visible (400–700nm) tothermal (long-wave)infrared wavelengths(8 to 12mm)The Nature of Remote Sensing3Fall 2005Definitions (cont.) Remote sensing requires–––– Energy interacts with matter– Reflection (Scattering)– Transmission– Absorption (Re-emmitted)Active or passive sourceTargetMedium (typically lossy)Sensor (optics, detector) Sensor characteristics– Spatial (Ground SampleInterval)– Spectral (Range and width)– Temporal (Revisit time)– Radiometric (Precision) Source radiation modeledas a traveling wave– Time-harmonic– c λν C 2.998 x 10⁸ m/s λ is the wavelength ν is the frequency– Also, wavenumber 1/λ cm-1 EM spectrum is infiniteand continuousThe Nature of Remote Sensing4Fall 20052
Applications Environmental assessment and monitoringGlobal change detectionAgricultureNonrenewable resourcesRenewable resourcesMeteorologyMappingMilitary surveillance and reconnaissanceNews mediaFurther reading: Remote sensing tutorialhttp://rst.gsfc.nasa.govThe Nature of Remote Sensing5Fall 2005Types of Sensors and Sensing Multiangle Imaging SpectroRadiometer (MISR)sensor on NASA Terra satellite (http://wwwmisr.jpl.nasa.gov/)The Nature of Remote Sensing6Fall 20053
Broadband Sensors Single, broad spectral band,typically 400nm wide in thevisible spectrum Often called “panchromatic” Large number of photonscollected, which allows smallerdetectors, i.e. greater spatialresolution Corona was the first globalsatellite reconnaissance missionCorona photograph ofDolon airfield, USSR,August 20, 1966– high resolution camera– photographic film returned toEarth in re-entry capsule(http://www.nro.gov/corona/imagery.htm)The Nature of Remote Sensing7Fall 2005Heat Capacity Mapping Mission (HCMM) One-of-a-kind NASA sensor– First ApplicationsExplorer Mission AEM-1– April 26, 1978 September 30, 1980Baltimore Demonstrated relativelyhigh resolution (600m)thermal remote sensingfrom satellites Heat capacity refers toretention and release ofthermal energy bygeologic materialsduring the diurnal cycleWashington, D.C.Chesapeake BayCape HatterasHCMM image of eastern US,3AM on June 11, 1978The Nature of Remote Sensing8Fall 20054
Multispectral Sensors Co–registered images inseveral relatively narrowspectral bandsTM1TM2TM3TM4– typically 50–100nm widein the visible spectrum,wider at longerwavelengths Landsat Series (1–7)– 1972 – date– Landsat 6 failed toachieve orbit, 5 and 7 stilloperating– various multispectralsensors Multispectral ScannerSystem (MSS): 4 bands,VNIR 80m Thematic Mapper (TM): 7bands, VNIR/SWIR 30m,TIR 120m Enhanced ThematicMapper (ETM ): 8 bands,PAN 15m, VNIR/SWIR 30mand TIR 60mThe Nature of Remote SensingTM5TM6 (TIR)TM7TM multispectral image of desert andagriculture near Yuma, Arizona9Fall 2005Multispectral Display Visualize spectral content with 3band color composites Example: color infrared (CIR)–––TM color infrared (CIR) compositeof Imperial Valley, CaliforniaThe Nature of Remote Sensing 10red channel assigned to near IRsensor bandgreen channel assigned to red sensorbandblue channel assigned to greensensor bandvegetation appears red,soil appears yellow – grey,water appears blue – blackFall 20055
Airborne SensorsPositive Systems, ADAR System 5500, single frameColor infrared (CIR) composite of Tanque Verde Wash, TucsonThe Nature of Remote Sensing11Fall 2005Hyperspectral Sensors Multispectral sensor with relativelyhigh spectral resolution (typically 5– 10 nm) and large number(typically 200) of nearly-contiguousbands– high spectral resolution potentiallyallows high discrimination of surfacefeaturesTypically acquired with an imagingspectrometer over the wavelengthrange 400 to 2400nm–mostly airborne systems–Airborne Visible/Infrared ImagingSpectrometer (AVIRIS)(http://makalu.jpl.nasa.gov/aviris.html): 224 bands, 5–20m–Hyperion is first satellitehyperspectral sensor, on NASA Hyperion.html): 220 bands, 30mThe Nature of Remote Sensing12AVIRIS hyperspectral image cube of LosAlamos, NM (courtesy Chris Borel, LANL)Fall 20056
spectral SignaturesgrasswaterAVIRIS CIR composite image of Palo Alto, 400building80012001600wavelength (nm)20002400The Nature of Remote Sensing13Fall 2005Multitemporal Image SeriesLandsat Multispectral Scanner System (MSS) 13-year image seriesof copper mine expansion near Tucson, AZAUG 22, 1972NOV 15, 1973JUN 30, 1977The Nature of Remote SensingJUN 1, 1974OCT 11, 1978NOV 14, 1975JUL 13, 198314MAY 30, 1976JUN 14, 1985Fall 20057
Global Composites Images from a singlesensor, acquired overa long period of time(e.g., days or weeks) “Cloud-free” pixelcompositeMay 1–10, 1992 Mosaiced Projected in a singlemap projection forthe whole earthJune 1–10, 1992The Nature of Remote Sensing15Fall 2005Non-Optical Sensors Acquired in nonoptical spectralregions, e.g.microwave Synthetic ApertureRadar (SAR) Measure differentsurface propertiesthan optical images E.g. microwave cansense soil moistureand surface roughnessThe Nature of Remote SensingShuttle Imaging Radar (SIR-C) imageof volcano in Galapagos IslandsRough lavaSmooth lava16Fall 20058
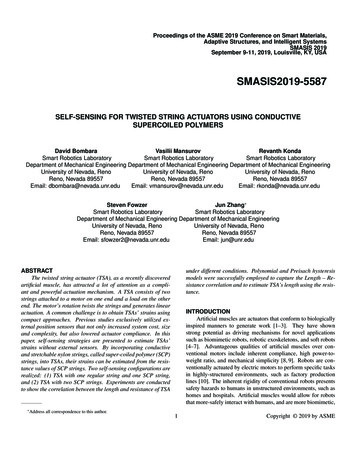
The Nature of Remote Sensing IntroductionRemote Sensing SystemsRemote Sensing PhysicsSensor ParametersDisplay and Data SystemsThe Nature of Remote Sensing17Fall 2005Sensor Parameter Space10001HSIV,SAVIRISV,SHYDICE2,V,S3.2 km altitude6.1 km altitude2PpanchromaticSshortwave infraredTnumber of spectral bandsthermal infraredV100visible/near infraredMODISV,S,T10ASTERS, TMV,STASTERTIMS1LISS-IIIV 001000104GIFOV (m at nadir)The Nature of Remote Sensing18Fall 20059
Case Study: MODIS Limit-of-the-artmultispectralwhiskbroom system 36 spectral bandsfrom visible tothermal on 4 focalplanes 3 spatial resolutions:250m, 500m, 1000m Diverse applications:land, oceans,atmosphereThe Nature of Remote SensingNASA EOS MODerate resolution ImagingSpectrometer (MODIS)19Fall 2005Case Study: MODIS (cont.)Geophysical variablesGeneralBandSpecificSpectral range(nm)Land/cloudboundariesvegetation chlorophyll1620 – 670cloud and vegetation2841 – 876Land/cloudpropertiessoil, vegetation differences3459 – 479green vegetation4545 – 565leaf/canopy properties51230 – 1250snow/cloud differencesland and cloud properties671628 – 16522105 – 2155chlorophyll observations89405 – 420438 – 44810483 – 49311526 – 536sediments12546 – 556sediments, atmosphere13662 – 672cholorophyll flourescence14673 – 683aerosol properties15743 – 753aerosol/atmosphereproperties16862 – 877cloud/atmosphereproperties1718890 – 920931 – 94119915 – 965Ocean colorAtmosphere/cloudsThe Nature of Remote Sensing20GIFOV(m)2505001000Fall 200510
Case Study: MODIS (cont.)Geophysical variablesGeneralThermalSpectral range(µm)BandSpecificsea surface temperaturesforest fires/volcanoes20213.66 – 3.843.929 – 3.989cloud/surface temperature223.929 – 3.989cloud/ surface temperature234.02 – 4.08troposphere temp/cloud fractiontroposphere temp/cloud fraction24254.433 – 4.4984.482 – 4.549Atmosphere/cloudscirrus clouds261.36 – 1.39Thermalmid-troposphere humidityupper-troposphere humidity27286.535 – 6.8957.175 – 7.475surface temperature298.4 – 8.7total ozone309.58 – 9.88cloud/surface temperature3110.78 – 11.28cloud/surface temperature3211.77 – 12.27cloud height and fraction3313.185 – 13.485cloud height and fractioncloud height and fraction343513.485 – 13.78513.785 – 14.085cloud height and fraction3614.085 – 14.385The Nature of Remote SensingGIFOV(m)100021Fall 2005Commercial SystemsCountryUSAIsraelCompanyWWW addressSensorGSI (m)pan/multiGFOV /413 x 13,11 x rd0.6/2.422 x 22,22 x ranceSPOTImagehttp://www.spot.com/homeSPOT 1–410/2060/60SPOT 52.5,5/10,20The Nature of Remote Sensing22Fall 200511
Then and NowRonald Reagan Washington National Airport (courtesy Space Imaging Inc.)IKONOS-P (1m)The Nature of Remote SensingSPOT-P (10-m)ETM-P (15-m)simulatedsimulated23Fall 2005The Nature of Remote Sensing IntroductionRemote Sensing SystemsRemote Sensing PhysicsSensor ParametersDisplay and Data SystemsThe Nature of Remote Sensing24Fall 200512
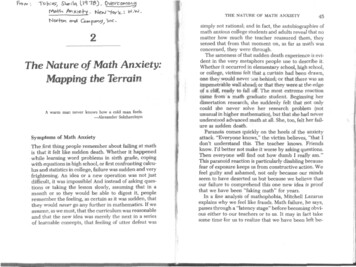
Spectral Regions Determined by:– "windows" where atmospheric transmittance is relatively high– wavelength regions where detector sensitivity is relativelyhighNameWavelengthRange (µm)Radiation SourceSurface Propertiesof InterestVisible (V)0.4–0.7solarreflectanceNear frared (SWIR)1.1–1.351.4–1.8solarreflectancesolar, thermalreflectance,2–2.5Mid-WaveInfrared (MWIR)3–4Thermal Infrared(TIR)8–9.5Microwave, rmal (passive)Temperature(passive)10–14artificial (active)roughness (active)The Nature of Remote Sensing25Fall 2005Atmospheric Transmittance Atmospheric “windows” result from energyabsorption by air molecules––––Water vapor (H20)Carbon dioxide (C02)Ozone (O3)Others to a lesser extent110.80.80.6CO0.4COCO ,CO tanceCO ,2H2 O0.6O3CO20.4HOCO2220.2HO21.21.6wavelength (µm)VNIRThe Nature of Remote Sensing22.4SWIR02.54.5MWIR266.58.510.5wavelength (µm)12.514.5TIR (LWIR)Fall 200513
Radiation Sources Approximately equal at the top-of-theatmosphere (TOA) in the Mid-Wave IR (MWIR)solar irradiance1000earth emission1000-2-1104radiant exitance (W-m -µm )irradiance (W-m - µm )10 41001010-2100-110.11110wavelength (µ m)MWIRThe Nature of Remote Sensing27Fall 2005Human Vision Sensitive over very small range of total solarspectrumsolar spectrum and human visual sensitivity200010.8solar irradiance1500daylight sensitivity0.610000.45000.20400900The Nature of Remote Sensing1400wavelength (nm)281900relative sensitivitysolar irradiance (W-m-2 -µm-1 )250002400Fall 200514
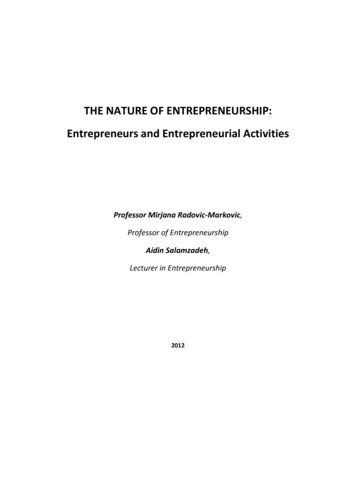
Spectral Signatures Vegetation spectral reflectance has severaldistinguishing features– “red edge” at 720 – 780nm caused by cellular structure– Low reflectance in the blue and red caused bychlorophyll absorption; slightly higher reflectance inthe green– Water absorption features at 1400nm and 1900nm0.50.6Kentucky Blue GrassRed Fescue GrassPerennial Rye Grass0.30.2“rededge”0.1WheatSugar 040080012001600wavelength (nm)2000The Nature of Remote Sensing240040080012001600wavelength (nm)2920002400Fall 2005Spectral Signatures (cont.) Soil and geologic minerals show relativelysmooth spectral reflectance0.610.50.80.4reflectancereflectance– water absorption features in soils at 1400nm and1900nm– narrow molecular absorption features caused bycharacteristic molecules0.30.204008001200160020002400wavelength (nm)The Nature of Remote Sensing0.4Alunite GDS84Buddingtonite GDS85Dolomite HS102Kaolinite CM90.2Dry Red Clay (5% water)Wet Red Clay (20% water)0.10.630040080012001600wavelength (nm)20002400Fall 200515
Myth of Spectral Signatures Idealized characteristic ofsurface materials is neverachieved in practicespectra of pixel samples from 3 materials160140–––––natural variabilityatmospheric variability“mixing” of materialsshadowsbidirectional reflectancedistribution function(BRDF)– sensor noisevegetation120soil/sandDN (SPOT3)100806040 Nevertheless, spectralsignatures are a usefulconceptasphalt2000The Nature of Remote Sensing20314060DN (SPOT2)80100120Fall 2005The Nature of Remote Sensing IntroductionRemote Sensing SystemsRemote Sensing PhysicsSensor ParametersDisplay and Data SystemsThe Nature of Remote Sensing32Fall 200516
Multitemporal Parameters Meteorology requires frequent revisits (at leasthourly) Agriculture requires less frequent revisits(weekly) Geology requires infrequent revisits (every fewmillion years)– “events” such as volcanos and landslides are exceptionsSystemRevisit IntervalLandsat 1–318 daysLandsat 4–716 daysAVHRR1 day or 7 hrsSPOT26 days at nadir1, or 4–5 days pointingIRS-1A, B22 daysMODIS2 daysGOES30 minThe Nature of Remote Sensing33Fall 2005Scan Parameters Field-Of-View (FOV, radians): used by systemdesigners Ground-projected FOV (GFOV, km): used by datausersline1-D whiskbroomThe Nature of Remote SensingTMETM MODISAVHRR2-D Fall 200517
Scanner TypesIn-track pushbroomPointing pushbroomContinuous coveragewhiskbroom scanner(MODIS)The Nature of Remote Sensing35Fall 2005Pixel Parameters Instantaneous Field-OfView (IFOV, mrads) Ground-projected IFOV(GIFOV, m) Ground Sample Interval(GSI, m)one detector elementimage spacewidth wfocal length fopticsnadirIFOV– Also called Ground SampleDistance (GSD) GIFOV and GSI determinegeometric “spatialresolution”GIFOV– Defined at-nadir, “pixelgrowth” occurs off-nadir– Instrument response alsoaffects spatial resolutionThe Nature of Remote Sensingaltitude Hobject spaceearth’s surfaceGSIInstantaneous pixel geometry36Fall 200518
Sensor Comparison Whiskbroom: Landsat Enhanced Thematic Mapper ETM Pushbroom: Earth Observer – 1 Advanced Land Imager ALISignal-to-Noise Ratio (SNR) – Alaska low-light image , both 30m GIFOVLandsat ETM (November 2000)The Nature of Remote SensingEO-1 ALI (December 2000)37Fall 2005Sensor Comparison (cont.)Local geometry – Maricopa, AZ, July 27, 2001EO-1 ALI Level 1R band 2Landsat-7 ETM Level 1G band 1The Nature of Remote Sensing38Fall 200519
The Instrument Response Any measuring instrument is limited in thedegree of detail it can capture This limit is referred to as the instrument’s“resolution”– widely used, but often misused, term Two aspects for remote sensors– spatial response– spectral responseThe Nature of Remote Sensing39Fall 2005Spatial Response The total system response to a spatial “impulse”signal Larger than geometric GIFOV– time integration smear (cross-track for whiskbrooms,in-track for pushbrooms)– optics blur– electronic filters (cross-track for whiskbrooms; notcommon for pushbrooms)– detector electron diffusion, charge transferinefficiency (pushbrooms) The net spatial response is the convolution of allthese factors, converted to a common spatialcoordinate systemThe Nature of Remote Sensing40Fall 200520
Imaging Simulation Example: simulation of Landsat TM imaging– Model TM spatial response components (at a sin-trackLow-passfilter crosstrack onlyThe Nature of Remote Sensing41Fall 2005Imaging Simulation (cont.)TM spatial response componentsThe Nature of Remote Sensing42Fall 200521
Imaging Simulation (cont.)High resolution aerial photographyrotated to alignwith TM orbitand scandirectionscanned aerial photograph, GSI 2mThe Nature of Remote Sensing43Fall 2005Imaging Simulation (cont.) Apply each componentof the spatial responseand downsample to30mopticsoptics and GIFOVdownsample2m — 30m GSIoptics, GIFOV and electronicsThe Nature of Remote Sensing44Fall 200522
Imaging Simulation (cont.) Compare to real TM of same area, acquired 4months latersimulated TMreal TMreal TM(contrast-adjusted)The Nature of Remote Sensing45Fall 2005Spatial Resolution A “subpixel” object smaller than the GIFOV can bedetected, but not resolved Detectability of a subpixel object depends on:––––object size relative to the sensor GIFOVobject radiance contrast to the surrounding backgroundscene noise (“clutter”)sensor noiseDetection of a 7mobject in TM imagery– detection capabilitydepends on spectral bandBerkeley Pier: 7m wide, concrete and woodThe Nature of Remote Sensing46Fall 200523
Detectability50% target coverage of GIFOV Low-contrast subpixeltargets must bebigger than highcontrast targets fordetection! 0! 0.04DNDN! 112815! 0.08minimum-area detectable target111111Dependence of detectability on object size and contrastThe Nature of Remote Sensing47Fall 2005Sampling The measuredradiance of a subpixel object dependson the location of theobject relative to thepixel samplesThree scans across the Berkeley Piercba4540acbDN353025201568101214161820pixelThe Nature of Remote Sensing48Fall 200524
Spectral Response Individual band spectral response determined by– detector responsivity– filter transmission (discrete spectral band sensors)– spectrometer slit width (hyperspectral sensors)110.80.8Relative ResponseRelative ResponseExample spectral response curves – Landsat Thematic Mapper (TM)0.6TM1 TM20.6TM4TM30.40.20400TM5TM70.40.25006000700800 1200900wavelength (nm)1000 14001100The Nature of Remote Sensing16001800wavelength (nm)20002200492400Fall 2005Spectral Resolution As in the spatial case, the width of theinstrument spectral response determines itsability to record detail in the spectral signalSimulation of TM band measurements of a vegetation spectral signal-1-2 -1radiance (W-m -sr -µm )0.0120.0090.006TM40.003TM1TM2TM300.4The Nature of Remote Sensing0.50.60.70.8wavelength (µm)500.91Fall 200525
Spectral Resolution (cont.)Simulation of spectral doublet measurementwith two different spectral resolutionsreflectance1TM e140014501500wavelength (nm)AVIRIS 14501500wavelength (nm)normalized spectral responsivity1The Nature of Remote Sensing0.1normalized spectral responsivity Hyperspectral systemswith narrow spectralresponses (typicallyabout 10nm) areuseful for detectingfine spectral detail01550Fall 2005The Nature of Remote Sensing IntroductionRemote Sensing SystemsRemote Sensing PhysicsSensor ParametersDisplay and Data SystemsThe Nature of Remote Sensing52Fall 200526
Image FormatsBIS (BIP):BandInterleavedby-Sample(-Pixel)lines1- 8bands 1- 7samples 1-8bands1- 7lines1 -8bands1 -7BIL: Band Interleaved-byLineThe Nature of Remote Sensinglines1 -8BSQ: BandSeQuential53Fall 2005File Formats raw– no header geoTIFF– variant of TIFF that includes geolocation information inheader (http://remotesensing.org/geotiff/geotiff.html) HDF– Hierarchical Data Format (http://hdf.ncsa.uiuc.edu/)– self-documenting, with all metadata required to read animage file contained within the image file– variable length subfiles– NASA specific version: EOS-HDF(http://hdf.ncsa.uiuc.edu/hdfeos.html) NITF– National Imagery Transmission Format(http://remotesensing.org/gdal/frmt nitf.html)– Department of DefenseThe Nature of Remote Sensing54Fall 200527
Display Systems Digital Numbers (DNs) are image data Grey Levels (GLs) are numerical display values Look-Up Tables (LUTs) map DNs — GLs andchange image brightness, contrast and colors– Actual displayed colors depend on the color responsecharacteristics of the display systemGL 1Display system nds TGLBBD/AGL3(0,255,0)(0,0,0)green GL2bluecyan(0,255,255)RGB color cubeThe Nature of Remote Sensing55Fall 2005Color Composites Composite any three sensor bands into RGB Color IR (CIR) mode approximates CIR filmspectral responsegeneric composites– interpretation key: red vegetation grey, yellow soils blue, black waterColor ModeDisplayColorTrueColor(TC)Color IR(CIR)FalseColorRed (R)RedNIRAnyGreen (G)GreenRedAnyBlue (B)BlueGreenAnysensor-specific ,7
TM1 TM2 TM3 TM4 TM5 TM6 (TIR) TM7 The Nature of Remote Sensing 10 Fall 2005 Multispectral Display Visualize spectral content with 3- . Hyperion.html): 220 bands, 30m AVIRIS hyperspectral image cube of Los Alamos, NM (courtesy Chris Borel, LANL) 7 The N