Transcription
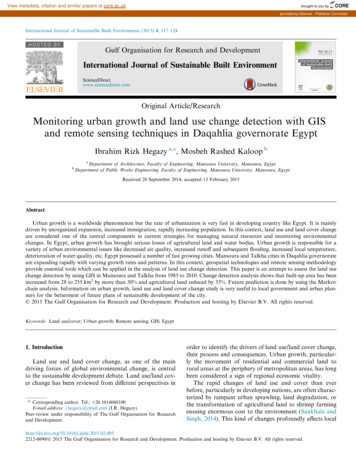
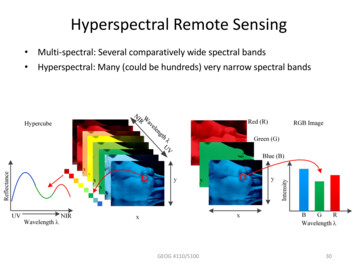
Remote Sensing and Geographic InformationSystem Data Integration: Error Sources andResearch IssuesRoss S. LunettaU. S. Environmental Protection Agency, Environmental Monitoring Systems Laboratory, P.O. Box 93478, Las Vegas, NV89193-3478Russell G. CongaltonDepartment of Forestry and Resource Management, University of California, 204 Mulford Hall, Berkeley, CA 94720Lynn K. FenstermakerDesert Research Institute, C/O U.S.EPA, EMSL-LV (AMS), P.O. Box 93478, Las Vegas, NV 89193-3478John R. lensenDepartment of Geography, University of South Carolina, Columbia, SC 29208Kenneth C. McGwireDepartment of Geography, University of California, Santa Barbara, CA 93106Larry R. T i n n yEG&G Energy Measurements, Remote Sensing Laboratory, P.O. Box 1912, M/S P-02, Las Vegas, NV 89125Data derived from remote sensors are increasingly being utilized as a data source in geographic informationABSTRACT:systems (GIs). Error associated with the remote sensing and GIs data acquisition, processing, analysis, conversion, andfinal product presentation can have a significant impact on the confidence of decisions made using the data. The goalof this paper is to provide a broad o v e e wof spatial data error sources, and to identify priority research topics whichwill reduce impediments and enhance the quality of integrated remote sensing and GIs data. Potential sources of errorwill be identified at each data integration process step, impacts of error propagation on the decision making andimplementation processes will be assessed, and priority error quantification research topics will be recommended.Suggested priorities for error quantification research topics include the development of standardized and more costeffective remote sensing accuracy assessment procedures, development of field verification data collection guidelines,procedures for vector-to-raster and raster-to-vector conversions, assessment of scaling issues for the incorporation ofelevation data in georeferencing, and development of standardized geometric and thematic reliability legend diagrams.INTRODUCTIONassessment, and final product presentation. Error may be trans-ITH THE PROLIFERATION OF GEOGRAPHIC I N F O T I O N ferred from one data process step to the next unknown to theWSYSTEMS (GIs) in both industry and government for numerous applications, there has been a tremendous increase indemand for remote sensing as a data input source to spatialdatabase development. Products derived from remote sensingare particularly attractive for GIS database development becausethey can provide cost-effective, large area coverage in a digitalformat that can be input directly into a GIs. Because remotesensing data are typically collected in a raster data format, thedata can be cost-effectively converted to a vector or quadtreeformat for subsequent analysis or modeling applications (Lee,1991).h h o u g h the use of remote sensing data for spatial databasedevelopment is increasing rapidly, our understanding of associated data processing errors, especially for integrating multiplespatial data sets, lags far behind. Performing spatial data analysis operations with data of unknown accuracy, or with incompatible error types, will produce a product with low confidencelimits and restricted use in the decision making process. Although some research has addressed spatial error (Veregin,1989a), we need to clearly identify the types of error that mayenter into the process, understand how the error propagatesthroughout the processing flow, and develop procedures to better quantify and report the error using standardized techniques,i.e., techniques for all spatial data users.The process of integrating remote sensing data into a GIsusually includes the following analytical procedures: data acquisition, data processing, data analysis, data conversion, errorPHOTOGRAMMETRIC ENGINEERING& REMOTESENSING,Vol. 57, No. 6, June 1991, pp. 677-687.analysts until it manifests in the final product, error may accumulate throughout the process in an additive or multiplicative fashion, and individual process error(s) can be overshadowedby other errors of greater magnitude. The potential sources oferror which may enter a remote sensing data processing floware illustrated in Figure 1. Although the typical processing flowis displayed in a clockwise direction, bidirectional and crosselement processing flow patterns are possible. For example,data conversion usually occurs after data analysis. However, insome instances conversion may occur in the data processingstep. Usually these conversions are in the form of raster-toraster (e.g., resampling pixel size) or vector-to-raster.In theory, the amount of error entering the system at eachstep can be estimated. In practice, however, error is typicallyonly assessed at the conclusion of data analysis (i-e., the finalproduct), if it is assessed at all. Usually, the decision maker isprovided graphic final products, statistical data, or modelingresults with little or no information concerning the confidencethat can be placed in the information. This limits the confidencein the implemented decision(s). It is imperative that we improveour ability to quantify the error associated with the data, andmonitor the error as it propagates through a GIs application.The following sections review the nature of the error that maybe introduced and identify significant improvements that mustbe addressed.The objectives of this paper are first, to identify the potentialsources of error in the data processing flow for the integration0099-1112/91/5706-677 03.00/001991 American Society for Photogrammetryand Remote Sensing
PHOTOGRAMMETRIC ENGINEERING & REMOTE SENSING, 1991.RadiometricGeometric RectificationRect ficationIc.ThematicSpatial ErrorErrorFINAL PRODUCTPRESENTATIONdA. Autocorrelation.Locational Accuracy 1\ .Error Matrix.Discrete Multivariate StatisticsDATA ANALYSISQuantitativeAnalysisIRaster to Vector.Vectorto RasterSamplingSpatialReporting StandardsFIG.1. The accumulation of error in a "typical" remote sensing information processing flow.of remote sensing data into a GIs; second, to discuss and illustrate the consequences of error in the decision making and implementation processes; and, finally, to recommend importantresearch and development issues to overcome error-related impediments for the incorporation of remote sensing data products into GIs data analysis applications.DATA ACQUISITION ERROREnvironmental and cultural data may be acquired by eitherin situ or remote measurement. Some data acquisition errors arecommon to any form of data collection and may be introducedfrom a number of sources. Some of these sources, such as atmospheric conditions and the natural variability of the landscape, cannot be controlled. Conversely, other types of datacollection error, such as geometric or radiometric error, may becontrolled. One of the most difficult sources of error to quantifyis human subjectivity during data analysis and interpretation.Nevertheless, it is important to have an understanding of thetype and amount of error possible from all data acquisition sourcesand to control it whenever possible. Extensive information maybe found in the literature on many of the data acquisition errorsources, e-g., Desachy et al. (1985), Duggin et al. (1985), andSalsig (1990). Data acquisition errors, excluding those errors associated with natural and human variability, will be briefly discussed in the following paragraphs.The processing of multiple data layers in a GIS database ispredicated upon accurate spatial registration between data layers. Therefore, it is critical that all remotely sensed data be geometrically accurate with the same cartographic projection as theGIS database. Modern photogrammetry is moving towards fullyanalytical techniques and digital image processing (ISPRS, 1986;Hood et al., 1989). These photogrammetric developments havebroad implications for remote sensing and GIS integration. Theyprovide a sound and necessary mapping basis applicable toremote sensing imagery. The following discussion identifies someof the primary issues involved, such as basic geometric aspectsof imaging, scene environmental considerations, platforms, andground control (Richards, 1986).Illumination geometry can affect image quality and subsequent analyses. Ideally, illumination geometry is constant ornearly constant throughout an image. In practice, however, acquisition needs dictate a relatively wide total field-of-view (TFOV),resulting in a range of illumination measurement geometries.Passive systems are dependent upon solar illumination. Solarelevation and azimuth conditions for aircraft acquisitions cansignificantly limit the duration of suitable acquisition windows(Brew and Neyland, 1980).Maintaining constant image scale would facilitate image entryinto a GIs. Scale variations are introduced by numerous factors,such as off-nadir viewing (tilt for aerial cameras) and terrainrelief displacement. The instantaneous field of view (IFOV)ofan imaging system also introduces scale variations, which aremost pronounced in wide TFOV systems. Imaging geometry varies by sensor type and effects. A brief comparison of sensorssuch as aerial cameras, multispectral scanners, and side-lookingairborne radars illustrates this issue.The design of conventional aerial camera systems provides acentral perspective geometry and produces radial geometric effects, i.e., effects due to relief displacement. Most mapping systems have high quality lenses, filters, and image motioncompensation to achieve film geometric stability during exposure. Camera systems are also calibrated periodically using welldefined standards that allow for correction of known geometricdistortions. Gyro-stabilization can assure nadir-looking and correct heading orientation.
ERROR SOURCES AND RESEARCH ISSUESMultispectral scanner (MSS) systems are constantly imagingwhen in operation. This means that all platform motions duringacquisition affect the image geometry (these motions are reviewed later). Also, there is no single nadir point in MSS imagery but, rather, a continuous sequence of nadir pixels thattracks the platform movement during data acquisition. Pixelsize away from the nadir line varies as a function of the cosineof the look angle. "Pushbroom" imaging systems with linearcharge-coupled-device (CCD) sensors eliminate many of the geometric errors associated with MSS mirror motions (Slama, 1980).The active image formation process used by a side-lookingairborne radar, or SLAR, necessitates a side-looking or obliqueview of the terrain. Because SLAR systems continuously sendand receive microwave signals, &raft motions can significantly degrade image geometry. To improve image quality, SLARantennae can be gyro-stabilized. Depending on the height ofthe terrain, and the look angle and direction, mountainous regions may be enhanced on radar imagery. Unfortunately, imageforeshortening or "layover" may introduce serious geometricerror which cannot be removed, thus making these data of lessvalue in a GIS. The lee side of mountains may be in radar shadowand therefore provide no information of value. The goal is toacquire synthetic aperture radar (SAR) data with the ideal lookangle and direction to minimize radar layover. Ideal look angleand direction is dependent on land feature orientation and project goals. Then the radar imagery can be rectified just like anyother remote sensor data.As briefly reviewed here, image geometry is dependent uponthe sensor involved. The ability to attain geometric fidelity iswell developed in conventional photogrammetry, which is basedon the use of vertical aerial photography. Many other types ofremote sensing systems, however, involve continuous imagegeneration processes; these processes are more susceptible togeometric distortions and may impede GIs integration. The geometric error introduced by each of these sensors should bequantified and removed or adequately minimized prior to theentry of the remote sensor data in the GIs database.The stability of moving platforms has a major influence onthe geometric fidelity of the remote sensing system. As justnoted, conventional aerial photography has the advantage ofnearly instantaneous film exposure using highly calibratedequipment. Conversely, continuous and line imaging systems,such as video cameras and scanners, are susceptible to geometric distortions due to platform motions.The flight or orbital altitude of a remote sensing platform, inconjunction with the sensor's field-of-view and viewing direction, affect the imaging geometry considerations reviewed earlier. Of additional interest here is platform velocity and direction,and the orientation or attitude of the platform. Major distinctions for these parameters can be made between aircraft andsatellite platforms. Aircraft platform motions have proven especially troublesome because turbulence can rapidly impact aircraft altitude and attitude.Instantaneous aircraft altitude (2) and locational (x,y) information are essential if the remote sensing data are to be accurately rectified and placed in a GIS. A continuous record of x,y, z location allows for determination of ground speed and degree of pitch, roll, and yaw. A correction for high frequencyplatform motions can require solution of a complex pointingmodel on a per-pixel basis. Such systems have been developedbut are not yet widely used (Gibson, 1984; Gibson et al., 1987;Reimer et al., 1987; Rickman et al., 1989; Till, 1987).Promising trends are apparent in both locational and attitudemeasurement equipment for aerial platforms. Global positioning system (GPS) technology provides an excellent basis for x,y, z location measurements (Case, 1989). Similarly, compact andlower priced inertial navigation technology, such as laser ringand fiber optic gyros, are becoming available for attitude measurements.The locational accuracy of rectified remote sensor data or finalmap products can be no better than the ground control uponwhich the rectification coefficients were based. In photogrammetry, control is established by using points whose positionsare known in an object-space reference coordinate system andwhose locations can be positively identified in the image-space.In addition to conventional survey techniques, procedures andissues such as photo markers, photo control extensions (e.g.,aerotriangulation), datums, projections, and accuracy standardsare well addressed for photographic applications (Wolf, 1974).Typical ground control for satellite and aircraft digital remotesensing products also make use of the relationship betweenobject space (the ground) and image space coordinates. Whilefundamental root-mean-square error (RMSE) values are sometimes provided, standardized procedures for establishing andreporting image geometric accuracy have not been developedby the remote sensing community. To allow routine remotesensing data entry and use in GIs databases, such standardsshould be developed and adopted.Ground control is necessary during the field accuracy assessment of any thematic map. The GPS technology will enhancefield verification efforts by providing increased accuracy in determining ground coordinates. However, it will still be costlyand impractical to assess the accuracy of all map feature boundaries using GPS. Standards and procedures for the use of GPSdata in GIs are and will continue to be a primary research topic.Corrections for several scene specific effects are routinely performed during photogrammetric mapping. For example, radialdistortions due to atmospheric refraction can be calculated andremoved for a standard atmosphere and Earth curvature effects(Slama, 1980). These types of effects are more pronounced atthe higher altitudes common for large area remote sensing surveys, but the effects can impact locational accuracy at even relatively low altitudes.Whereas terrain relief and image displacement create problems when performing MSS analysis, conventional photogrammetry is well developed for the extraction and mapping of terrainelevation contours, or hypsography, based upon stereo imageparallax. The accurate measurement and modeling of these effects is necessary for the preparation of planimetric basemaps,elevation contour maps, digital elevation models, and orthophotos.Basic ground-level and atmospheric characteristics are pertinent to photogrammetry but often more developed for digitalremote sensing applications. Examples include atmospheric absorption and scattering (Kaufman, 1988; Kaufman and Fraser,1984; Singh, 1988), surface bi-directional reflectance (BDRF)properties (Lee and Kaufman, 1986), variable topographic illumination conditions, and the relationship between vegetationand climate (phenology). An understanding of these characteristics and their impact on film and digital MSS products areimportant to the correct analysis and interpretation of these datatypes.DATA PROCESSING ERRORSince the early 1960s it has been possible to use digital imageprocessing techniques to geometrically rectdy remote sensing
PHOTOGRAMMETRIC ENGINEERING & REMOTE SENSING, 1991data to a map projection. Simple polynomial-based algorithms this case, variance estimates for regression weights derived fromhave proven adequate for satellite imagery, where geometric ordinary least squares are inflated, resulting in potentially unstdistortions are minimal. Attitude motions common when col- able values. Though better suited by weighted least-squareslecting MSS data from aircraft platforms, however, make this estimation, regressed relationships in cases of correlated orapproach acceptable on only small areas (Jensen et al., 1983). changing erroFvariance (heterodedasticity) still provide probAdaptive or discrete techniques such as finite element programs lems in terms of efficient parameter estimation.are often required to remove the complex distortions that resultThe tendency of adjaceit or nearly adjacent samples to havefrom aircraft instability.similar values in spatial data sets, i-e., autocorrelation, mayThe geometric correction of digital remote sensor data usually violate the independence of samples required in classical statisinvolves some type of resampling, e-g., nearest neighbor, bili- tics. This problem may result in underestimated sample varinear, or cubic convolution (Jensen, 1986). How these and other ance and inflated confidence estimates. The effects ofresampling algorithms affect the radiometric integrity of the data autocorrelation in remotely sensed data sources have been exand its spatial appearance need to be more fully understood. amined by a few investigators, e.g., Woodcock et al. (1988),Techniques to better automate or fine-tune geometric process- Congalton (1988a), Jupp et al. (1988), and Townshend and Jusing have been developed using different methods of multiple tice (1988). Statistical techniques which are not significantlybiasedimage spatial cross-correlation. However, broader application by autocorrelation effects include semi-variogram and blockof these useful techniques requires development of more so- variance analysis. Methods should be developed based on thesephisticated image processing environments. Current software techniques and others to improve digital classifications, conmenu-driven or "toolkit" approaches generally are too primitive struct sampling methodologies, and deflate confidence estiand tedious for routine production processing. Photogramme- mates.tric techniques for differential rectification to remove relief disIn terms of error accumulation, major impediments to theplacement and achieve constant photo scale have led to analysis of spatial data arise from a lack of well documentedorthophotography systems which are being well received in the methods and a lack of inteerated statistical tools within existineGIs community. This approach provides images andlor photo- software packages. Many pommercial software packages are o:graphs with map-like geometric characteristics. Similar process- ganized in a hierarchical manner with limited statistical options,ing is becoming popular for remote sensing imagery and cg., a choice of only one or two classifiers with limited userestablished parameters. As a result, inexperienced analysts maynecessary for GIs integration.blindly follow the software hierarchy using default optionswithout thinking about what is happening to the data. FlexibleProcessing of spatial data in image processing often involves statistical tools need to be identified to take into account thesome form of data conversion. It is possible to resample the particular difficulties inherent to spatial data sets and organizeddata to such a degree that the geometric and radiometric attri- into a usable software environment. This would encourage adbutes of the resampled data have a poor relationship with the equate consideration of statistical assumptions in the developoriginal data. A good example would be cubic convolution re- ment of more accurate information products.sampling of Landsat 56- by 79-metre pixels to merge with 10In addition to statistical validity, the classic problem in GISby 10-metre SPOT data. Another example of resolution degra- based data analysis of misregistered polygon boundaries condation is when remotely sensed data are classified and then tinues to be a plague. Registration error might be seen as somespatially filtered to remove heterogeneous "noise" in the clas- what distinct from the positional errors involved in varioussification. Similarly, in GIS analysis of slope and aspect calcu- independent data products. This distinction is that the resultinglated from digital elevation models, the resulting value is "slivers" cause logical errors of association in addition to porepresentative of a neighborhood rather than being directly re- sitional inaccuracy. The problems of cartographic overlay conlatable to an individual pixel. These types of data conversions tinue to be investigated and have recently been addressed bymust be catalogued and studied and their cumulative impact the National Center for Geographic Information and Analysis(NCGIA) as part of NCGIA Initiative 1: The Accuracy of Spatialquantified when incorporated into GIs.Databases (Goodchild and Gopal, 1989). Proposed approachesDATA ANALYSIS ERRORto removing this hurdle in the processing flow have includedIn the remote sensing and GIs processing flow outlined in attempts to deal with the boundary uncertainty using a statisthis paper (Figure I), data analysis involves the exploration of tically based buffer called the epsilon distance.At this stage of the processing flow, where inference is beingrelationships between data variables and the subsequent inferences that may be developed. This stage of error accumulation made between various types of data, the temporal nature offocuses on the validity of statistical techniques. Difficulties in ecological data also becomes an issue. Errors which will occurstatistical analysis of spatially based data sources involve the due to the static representation of dynamic ecosystem compotypical assumptions of the general linear model, compounded nents suggest that some method of assigning a lifetime to aby the effects of spatial autocorrelation. Data analysis will also data set must be developed. To some degree this task is intractbe subject to errors arising from variability in analyst expertise. able due to the unpredictable or discontinuous nature of certainSuch variability may involve the choice of relevant predictive processes. For example, elevation data are generally consideredvariables or the synthesis of new variables from multiple, cor- stable within the time scale of database development, thoughrelated or uncorrelated parameters. The underlying nature of natural and cultural processes are capable of making measuraspatial data in classical linear regression is beyond the scope of ble changes in landscape morphology over short periods of time.However, certain products may correctly portray the landscapethis paper. However, a few examples are provided.for long periods of time. An example of this is a multitemporalcomposite of the normalized difference vegetation index (NDVI)Beyond the basic problems in sampling and regression model derived from the AVHRR sensor. These data are being compiledspecification, spatial data commonly violate assumptions of in- by agencies such as NASA Goddard and the EROS Data Centerdependence for measured parameters and error variance. As a (USGS) and represent continuous landscape processes whichresult, multi-collinearity may present a problem in the case of change throughout and beyond the period of measurement.regression modeling efforts (Montgomery and Peck, 1982). In Despite this difficulty, studies utilizing this information have
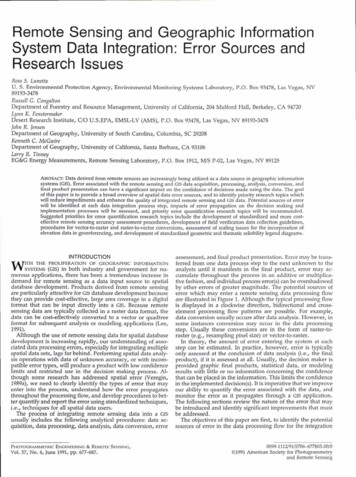
ERROR SOURCES AND RESEARCH ISSUESfound that periodic coverage of the NDW data correspond wellwith certain environmental parameters (Tucker et al., 1983; Princeand Tucker, 1986). It is imperative that the temporal nature ofremotely sensed phenomena be catalogued and judgements madeconcerning the optimum time period during which they arecollected and their degree of longevity, i-e., when are the dataobsolete?the original pixel values, error such as accurate location of edgesor loss of a spectrally similar yet unique resource may occur.Postclassification data generalization takes on two forms, spatial and thematic. Thematic generalization is the grouping ofclasses to form meaningful categories. Because this is performedat the discretion of the analyst, bias errors may be introducedand information may be lost if the analyst does not recognizea unique resource. Spatial (or cartographic) generalization is thesmoothing of a classified data set to remove any (salt and pepClassification systems themselves can be a significant source per) single classified pixels.It is also common to resample a classified data set to a minof error in the integration of remote sensing data into a GIs.Some of the potential sources of errors induced by classification imum map unit. For example, it may not be desirable for parsystems are the inability of classification systems to categorize ticular applications to generate a data set with higher than anmixed classes, transition zones, or dynamic systems; poorly de- acre or hectare minimum map unit, especially if the data set isfined or ambiguous class definitions; human subjectivity; and large and data storage is a consideration. Also, with the recentthe lack of compatibility among different classification systems trend of transferring raster-based remotely sensed data into avector-based GIs, it is important to minimize the number ofused with both remote sensing and traditional data types.polygonswhich must be created in the vector form. GeneraliThematic data layers created using remote sensing data generally require the use of some type of classification system(s) to zation of this form may result in inaccurate boundaries and thefacilitate categorization of the data for subsequent GIS spatial inclusion of small resources within a larger area resource class.data analysis. When dealing with mixed pixels or polygons andDATA CONVERSION ERRORtransition zones or dynamic systems, labeling inconsistencieswill occur with all classification systems. This introduces anelement of error which is particularly difficult to quantify.With the growing use of geographic information systems (GIS)Error induced by classification systems is significant whendealing with both natural and anthropogenic systems. The fun- and the need to incorporate digital remotely sensed data as adamental foundation that natural dynamic systems can be neatly quick and reliable source of information, it was inevitable thatcategorized into "black boxes" does not hold. To make matters data would need to be converted between raster and vectorworse, the level of error related to the black box syndrome formats (Figure 2). Raster format is simply data arranged ascannot easily be addressed. In mixed, transition, or dynamic regularly spaced, equal-sized grids. Satellite data and digitalprocess situations, it is particu1arIy important that detailed field elevation models (DEMS) are common examples of raster data.verification data be collected to adequately describe the varia- These data are easily stored in a computer as a matrix of numbers. Vector data maintain the true shape of a polygon using ation and minimize classification system related error.The problem of poorly defined or ambiguous class definitions series of vertices connected by (implied) straight lines. Vectoris common and often introduces an element of error. In dealing data are the preferred method of data display for most GIs thewith either natural or man made features (land cover or land matic maps due to the smooth line and edge appearance. Aduse), there are an infinite number of situations that do not neatly ditionally, most map products, including the results offall under a specific class definition. If there is not a clear def- photointerpretation, are generally represented in vector format.Unfortunately, there can be sigruhcant error introduced eitherinition for a particular occurrence, there is a reasonable chancethat inconsistency in labeling classes would occur, leading to by converting from raster-to-vector format or from vector-toerror. The better defined the classes and the more logical the raster format. The size of this error depends on the algorithmclassification scheme, the less classification induced error should used in the conversion process, the complexity of features, andthe grid cell size and orientation used for the raster represenresult.Often, multiple thematic data sources are joined together or tation. Failure to consider this potential error can introduce conutilized as GIS coverages in a spatial data analysis process. In- siderable problems into any analysis.consistency in classification schemes can ca
entry of the remote sensor data in the GIs database. The stability of moving platforms has a major influence on the geometric fidelity of the remote sensing system. As just noted, conventional aerial photography has the advantage of nearly insta