Transcription
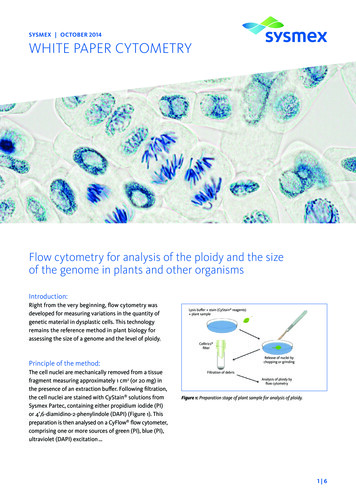
SYSMEX OCTOBER 2014WHITE PAPER CYTOMETRYFlow cytometry for analysis of the ploidy and the sizeof the genome in plants and other organismsIntroduction:Right from the very beginning, flow cytometry wasdeveloped for measuring variations in the quantity ofgenetic material in dysplastic cells. This technologyremains the reference method in plant biology forassessing the size of a genome and the level of ploidy.Lysis buffer stain (CyStain reagents) plant sampleCelltrics filterRelease of nuclei bychopping or grindingPrinciple of the method:The cell nuclei are mechanically removed from a tissuefragment measuring approximately 1 cm2 (or 20 mg) inthe presence of an extraction buffer. Following filtration,the cell nuclei are stained with CyStain solutions fromSysmex Partec, containing either propidium iodide (PI)or 4’,6-diamidino-2-phenylindole (DAPI) (Figure 1). Thispreparation is then analysed on a CyFlow flow cytometer,comprising one or more sources of green (PI), blue (PI),ultraviolet (DAPI) excitation .Filtration of debrisAnalysis of ploidy byflow cytometryFigure 1: Preparation stage of plant sample for analysis of ploidy.1 6
The cell cycle:DNA contentUnder physiological conditions, the cells naturally presenta DNA profile corresponding to a cell cycle with differentphases (Figures 2 & 3):Figure 2: Cell cycle. Key: G0 phase resting, G1 phase first gap, S phase synthesis, G2 phase second gap and M phase mitosis.Suspension of the nuclei:Use of an in-house reference:The filtration stage removes the tissue debris duringrelease of the nuclei. Nevertheless, small fragments noteliminated during the filtration stage, such as chloroplasts,mitochondria and soluble phenolic compounds as wellas DNases and RNases ., can all impair the quality ofthe analysis.It is sometimes recommended to use a reference composed of nuclei from a species whose genome is of asimilar size to that of the sample being analysed. Thisreference is prepared at the same time as the sample sothat the factors have the same effects on the two species.The relative position of the peaks between the referenceand the sample makes it possible to measure the sampleaccurately, under certain conditions, knowing the characteristics of the DNA of the in-house reference in picograms(pg) or base pairs (bp), knowing that:The addition of antioxidants (bisulfite, 2-Mercaptoethanol),tannin-binding agents (PVP), chloroplast lysis (Triton),RNA lysis (RNases) as well as preparation in an ice bathcan correct the interactions due to undesirable substances.DNA content (base pairs) 0.978 109 x DNA content (pg)Figure 3: Cytometric analysis of cell cycle.2 6
Analysis by flow cytometry:In order to eliminate the debris which passed throughthe filtration, cytometry makes it possible to initiate ananalysis of a fluorescence parameter and to use thisA)fluorescence analysis to determine a gate created on thebasis of a cytogram of granularity ‘SSC’ versus fluorescence‘DAPI or PI’ (Figures 4A & 4B).B)10001500NucleiGate: Nuclei1200FL6 IP log100Counts9001060030011101001000SSC0110100FL6 IP log1000Figure 4: Analysis of the ploidy of a tomato sample (Lycopersicum esculentum); 4A cytogram showing granularity (SSC) vs FL6 fluorescence emitted by the PI,the ‘Nuclei’ gate is applied to Figure 4B; 4B histogram of FL6 fluorescence emitted by PI and conditioned on the ‘Nuclei’ gate showing the ploidy peaks.Assessment of the degree of endoreduplication:The example above (Figures 4) using a tomato (Lycopersicumesculentum) demonstrates the phenomenon of endoreduplication corresponding to a DNA replication, such asmitosis, but without division of either the nucleus or thecell itself. The endoreduplication peaks are superimposedover the peaks of the classic cell cycle:2C4C8C16CIt is also possible to view the most abundant nucleianalysed simultaneously; their coincidences create a peakartefact ‘2C 4C’ (Figures 5 & 6).RegionGate% GatedCountMean-xCV-x %2CNuclei54.4918 36710.804.174CNuclei26.649 64821.233.768CNuclei4.321 46041.583.7216CNuclei0.7426078.683.872C 4CNuclei1.9564930.405.55Figure 6: Statistics of regions corresponding to different endoreduplication orcoincidence peaks.CountingTomato Lin log. FCS current Nuclei gateFL6 propidium iodide logFigure 5: Ploidy analysis of tomato sample (Lycopersicum esculentum)showing the endoreduplication peaks.3 6
Measurement of size of genome:Measurement of AT/GC ratio:The quantification of DNA by cytometry using an in-housereference requires the use of a staining which is notbase-specific, a true DNA intercalator, to quantify the sizesof the genome as accurately as possible. These intercalatingfluorochromes are generally propidium iodide or ethidiumbromide (in the example below: RNase and propidiumiodide, Figure 7).The principle is based on the use of a DNA intercalatorversus a fluorochrome specific to base repetitions, e.g.,5 x AT for Hoechst 33 342 and 3 x GC for mithramycine.Measurement of AT/GC ratioRIP Intensity of test / Intensity of reference Measured with propidium iodideor RHO Intensity of test / Intensity of reference Measured with Hoechst 33 342or RCA Intensity of test / Intensity of reference Measured with chromomycin A3% AT test % AT reference x (RHO/RIP)1/5 and/or % GC test % GC reference x (RCA/RIP)1/3100When % AT test % GC test is checked, the result should be 100 %80countscounts60Apomixis and aneuploidy:402000Region100200CountI FL1 stain% Gated300GMn-x400Mean-x500CV-x 1PK353426.70123.97124.114.74Apomixis is the substitution of normal sexual reproductionby asexual reproduction without fertilisation but producingseeds. Apomictic plants are generally identical from onegeneration to the next.The peaks generated by flow cytometry thanks to theembryo and endosperm cells of the seeds specify apomixisor not, as well as the type of apomixis (Figure 8).Figure 7: Analysis of the DNA content of a sample of horsetail (Equisetum sp.)using fragments of garlic (Allium sativum) with a determined DNA content asa reference.The PK1 and PK2 regions correspond respectively to peaks2C and 4C of garlic (Allium sativum) used as a reference,based on the knowledge that 2C 34.80 pg. Region PK3 ofhorsetail (Equisetum sp.) makes it possible to calculate theDNA index compared to PK1 123.97/49.50 2.50, and thusvalue 2C of the Equisetum sp. is 2.50 x 34.80 87.15 pg.4 6
Sexual profilesApomitic bryo3xEmbryo4xEndosperm10 xEndosperm4xEmbryo12 xEndosperm4xEmbryo12 xEndospermFigure 8: Study of the methods of reproduction according to the position of the peaks on the fluorescence histograms by flow cytometry (Matzk & al. 2000).In case of aneuploidy, the position of the peaks will beaffected and will appear as in the following example:rapeseed seedlings (Brassica napus) with a number ofchromosomes n 16 and n 19 creating double peaks.250200counts1501005000100200300FSC relative DNA400500Figure 9: Analysis of ploidy of a sample of rapeseed (Brassica napus) and presenting an aneuploidy profile with splitting into two of the 2C and 4C peaks.5 6
Acknowledgements:We would like to thank Mickaël Bourge (CytometryPlatform CNRS – FRC3115 – IMAGIF 91 118 Gif-surYvette) for his advice and being so kind as to reviewthis document.Bibliography[1] ennert W, Lubienski M, Körner S. & Steinberg M. (2005): Triploidy inBEquisetum subgenus Hippochaete (Equisetaceae, Pteridophyta) Annals ofBotany 95: 807 – 815.[2] Brown SC, Catrice O, Siljak-Yakolev S, Mergaert P & Satiat-Jeunemaître B.(2010): Le cycle et l’endoréduplication chez les végétaux, Dans : Cyclecellulaire et cytométrie en flux. X. Ronot, & D. Grunwald, J-F. Mayol,(eds) Tec & Doc – Lavoisier, Paris, pp190 – 213 & 274 – 276.[5] Marie D & Brown SC. (1993): A cytometric exercise in plant DNA histograms, with 2C values for seventy species. Biology of the Cell 78: 41 – 51.[6] Matzk F, Meister A & Schubert I. (2000): An efficient screen forreproductive pathways using mature seeds of monocots and dicots.Plant Journal 21: 97 – 108.[7] Ochatt S. (2008): Flow Cytometry in Plant Breeding. CytometryPart A 73A: 581 – 598.[3] Doležel J, Bartoš J, Voglmayr H & Greilhuber J. (2003): Nuclear DNAcontent and genome size of trout and human. Cytometry 51A: 127 – 128.[4] Godelle B, Cartier D, Marie D, Brown SC & Siljak-Yakolev S. (1993):Heterochromatin study demonstrating the non-linearity of flurorometryuseful for calculating genomic base composition. Cytometry 14.6:618 – 626. 0196 – 4763.WP ploidy rev.002 · October 2014 Copyright 2015 – Sysmex Europe GmbHSysmex Partec GmbHAm Flugplatz 13, 02828 Görlitz, Germany · Phone 49 3581 8746-0 · Fax 49 3581 8746-70 · info@sysmex-partec.com · www.sysmex-partec.com
Flow cytometry for analysis of the ploidy and the size of the genome in plants and other organisms Introduction: Right from the very beginning, flow cytometry was . Am Flugplatz 13, 02828 Görlitz, Germany · Phone 49 3581 8746-0 · Fax 49 3581 8746-70 · info@sysmex-