Transcription
Basic Principles in FlowCytometryPrepared by Hector NollaManager CRL Flow Cytometry LabUniversity of California, Berkeley
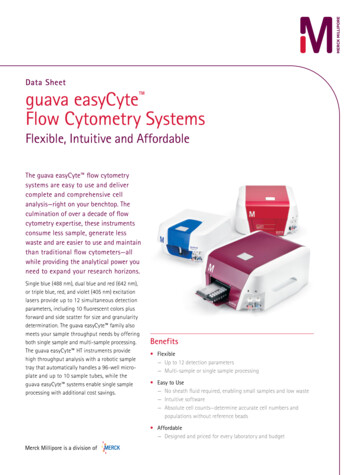
Flow Cytometry» Flow Cytometry is the technical process thatallows for the individual measurements ofcell fluorescence and light scattering. Thisprocess is performed at rates of thousandsof cells per second.» This information can be used to individuallysort or separate subpopulations of cells.
History Flow cytometry developed from microscopy. ThusLeeuwenhoek is often cited in any discussion regardingit’s history. F.T. Gucker (1947)build the first apparatus for detectingbacteria in a LAMINAR SHEATH stream of air. L. Kamentsky (IBM Labs), and M. Fulwyler (Los AlamosNat. Lab.) experimented with fluidic switching andelectrostatic cell sorters respectively. Both described cellsorters in 1965. M. Fulwyler utilized Pulse Height Analyzers toaccumulate distributions from a Coulter counter. Thisfeature allowed him to apply statistical analysis tosamples analyzed by flow.
History In 1972 L. Herzenberg (Stanford Univ.), developed a cellsorter that separated cells stained with fluorescentantibodies.The Herzenberg group coined the termFluorescence Activated Cell Sorter (FACS).
Fluorescence Activation Process(or Immunofluorescence)Antibodies recognize specificmolecules in the surface ofsome cellsAntibodies are artificiallyconjugated to TCBut not othersWhen the cells are analyzed by flowcytometry the cells expressing the markerfor which the antibody is specific willmanifest fluorescence. Cells who lack themarker will not manifest fluorescence
Cellular Parameters Measured by FlowIntrinsic No reagents or probesrequired (Structural)– Cell size(Forward LightScatter)– Cytoplasmic grabularity(90degree Light Scatter)– Photsynthetic pigmentsExtrinsic Reagents are required.– Structural DNA content DNA base ratios RNA content– Functional Surface and intracellularreceptors(Immunofluorescence). DNA synthesis DNA degradation (apoptosis) Cytoplasmic Ca Gene expression
Flow Cytometry Applications ImmunofluorescenceCell Cycle KineticsCell KineticsGeneticsMolecular BiologyAnimal Husbandry (and Human as well)MicrobiologyBiological OceanographyParasitologyBioterrorism
Flow cytometry integrates electronics,fluidics, and optics.Electronics are involved in signal processing,computer display and analysis.Fluidics are applied to sample processing andcell sorting.Optics component are involved in fluorescencedetection.
Flow Cytometry
Flow Cytometry and sortingOpticsElectronicsFluidicsLaserCell sortingDeflectionPlatesComputer Display
FluidicsFlow Chamber:Cells in the sample arehydrodynamically focused(See next Slide)Differential Samplepressure RegulatorFlow ChamberCompressedAir1X PBSSheathReservoirVacuum PumpCompressedAirLaserSampletubeWasteSheath pressure RegulatorCompressorCompressedAir
SampleZCells are presentedto the laser usingprinciples ofhydrodynamicfocusingYSheathXFlowchamberYZLaser opticsXLaser Beam
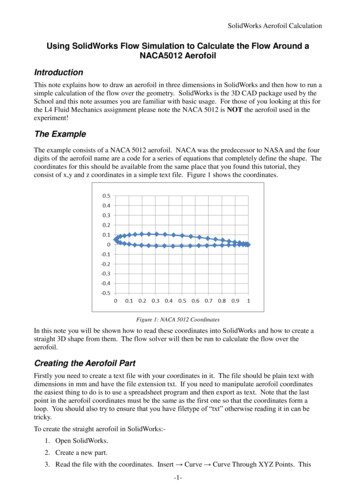
ElectronicsPhotomultiplier Tube (PMT) PMTs convert light into electrical signalsVoltage output or signalAnode Dynodes The higher the voltage applied to each PMT themore electrons are generated. Thus, the greaterthe amplification of the light coming in (gain).**Increasing the voltage does increase sensitivity.Instrument sensitivity is determined by the opticsDynodesDynodes Dynodes Electron flowElectrons flow from dynode todynode. Each dynodegenerates a secondaryemission of more electrons.Each dynode has apotential voltage morepositive than thepreceding dynodePhotocathodeLight sensitive. When photons hit it,it generates electrons(photoelectrons).Fluorescence Light InDerived from Practical Flow Cytometry, 4tthHoward Shapiroedition By
ElectronicsSignal from PMTsPre-amplifiersAnalog to DigitalConverters (ADCs)Each Pulse (or event), for eachparameter, is given a numericalvalue. This value is then plotted.These numerical values areproportional to the lightscattering and/or fluorescenceintensity of the event.Signal PeakDetectorsPulseIntegratorsPulse WidthCircuitry
Optical p Lens600DL550DLLaserBeam488BK488DLFlowCellFSSensor
Optical FiltersBand Pass Optical Filter525/30nm Band PassLong Pass Optical Filter550nm Long PassDichroic Long Pass Optical FilterPositioned at a 45 degreeangle.530 Dichroic Long Pass
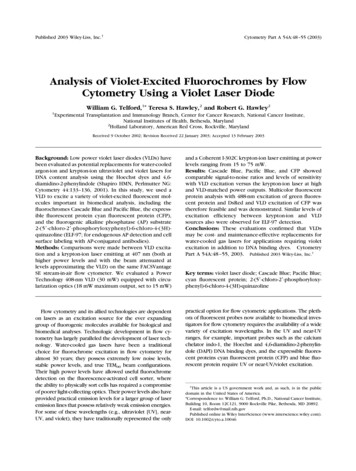
Light AbsorptionQuantum mechanics requires that moleculesabsorb energy as quanta (photons)Absorption of a photon raises the energy ofthe molecule from a ground state to anexcited stateAs molecules relax to a lower energy state,light is releasedFrom: J.Paul Robinson, Purdue University
FluorescenceChromophores are the components of molecules whichabsorb light, they are generally aromatic rings.Fluorescence lifetimes can be measured infemptosecondsQuantum Yield measures the efficiency between photonsabsorbed and photons emittedJ.Paul Robinson, Purdue University
Jablonski diagramFluorescenceEmissionElectronic Energy LevelsS2Rotational, VibrationalLevelsNonradiative orescenceS0(Ground State)
FITCPEPE-Cy5488500nm600nm700nm
SampleZCells are presentedto the laser usingprinciples ofhydrodynamicfocusingYSheathXFlowchamberYZLaser opticsXLaser Beam
Laminar Fluidic SheathCoreSheathLaserPE FLFITC FL488nm SctOuterSheath
Each cell generates a quanta of fluorescencePhotomultiplier Tubes(PMT’s)PE FLFITC FL488nm SctDiscriminatingFiltersDichroic LensesFluorescencePick-up LensForwardLightScatteringDetector
Negative cells are also detectedPE FLFITC FL488nm SctDichroic LensesPickup LensForwardLightScatter
How Signals are GeneratedVoltageAmplitudeLaserSingle Cells5-10usElectrical Pulse
From Fluorescence to Computer Display Individual cell fluorescence quanta is picked up by thevarious detectors(PMT’s). PMT’s convert light into electrical pulses. These electrical signals are amplified and digitized usingAnalog to Digital Converters (ADC’s). Each event is designated a channel number (based onthe fluorescence intensity as originally detected by thePMT’s) on a 1 Parameter Histogram or 2 ParameterHistogram. All events are individually correlated for all theparameters collected.
Light Scattering, 2 Parameter HistogramBiggerApoptoticCells90 degreeLight ScatterY AxisDeadCellsX AxisForward Light Scatter (FLS)BiggerCellsMoreGranularLive Cells
1 Parameter HistogramPositiveNegativeCountBrighterDimmer6411 2 3 4 6 7150 160 170 . 190Channel NumberFluorescence picked up from the FITCPMT
2 Parameter HistogramSinglePositive PIPopulationDouble PositivePopulationPE FLNegativePopulationFITC FLSingle PositiveFITCPopulation
Gating and Statistics Data generated in flow cytometry is displayed usingMultiparamater Acquisition and Display softwareplatforms. Histograms corresponding to each of the parameters ofinterest can be analyzed using statistical tools tocalculate percentage of cells manifesting specificfluorescence, and fluorescence intensity. This information can be used to look at fluorescenceexpression within subpopulations of cells in a sample(gating).
Flow Cytometry DataSmallerRegion,Live cellsmostlyLarger Regionincludes all cells
Running Samples Prepare samples. One sample should be completely negative. This sampleshould be analyzed first. Adjust the Forward LightScatter and Side Scatter amplification.This sample isalso used for adjusting the Fluorescence PMTsamplification voltage. Adjust the PMT Voltage until you can see a populationpeak in the first decade of your 1 parameter histogramand or your two parameter plot. Once the instrument settings are optimized, run samplesand collect data. If you are analyzing 2 or more fluorescence parametersyou have to prepare Single Color samples for each ofyour fluorochromes.
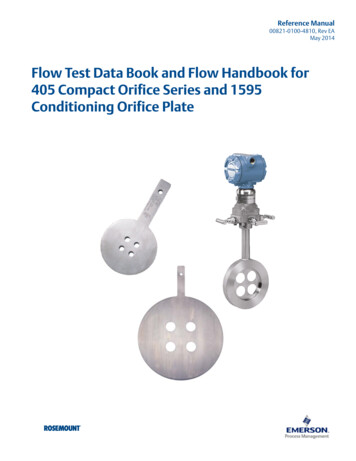
SortingLord Rayleigh, liquid stream emerging from an orificebecomes unstable, and breaks up into droplets(1800’s)If a vibration is applied to a stream (emergingfrom an orifice) the droplet formation becomesstableR. Sweet develops the drop charging and deflectiontechnique for ink-jet printing (1965)In cell sorters, an electromagnetic tunable transduceris incorporated in the flow chamber. This causes thefluid stream to break-off into individual dropletsThe stream behaves like a wavelength, drops arespaced one wavelength apart
SortingThe resulting droplet pattern can be described using thewavelength equation :v fThe droplet pattern is moststable when the break-offpoint is closest to theorificeThis is achieved when thewavelength is 4.5 streamdiametersSubstitutingdiameterv is the velocity of the streamf is the vibration frequencyis the wavelength or dropletspacingfor 4.5 streamv f(4.5d)From Howard Shapiro, PracticalFlow Cytometry, fourth edition
SortingPutting it together:v f(4.5d)For a 75uM orifice anda stream velocity of20m/s:f (20m/s)/(75 X 4.5)f (2.0e7)/(337.5)f 59,259cycles /s or hertzThe ideal frequency for a 75um flow chamber nozzle is 59,259HzFrom Howard Shapiro, PracticalFlow Cytometry, fourth edition
SortingDroplet charging circuitryWhen a cell meets a pre-determined criteria tobe sorted, a voltage is applied to the streamThe applied charge will travel down thestream to the last attached dropThe droplet charge is delayed to coincide withthe arrival of the cell to the precise position inthe stream of the last attached dropCharged droplets are physically deflected as they passthrough a set of two deflecting plates with oppositepolarities.From Howard Shapiro, PracticalFlow Cytometry, fourth edition
Orifice (75um)Observation pointLaminarFluidSSheathElectricalChargeBreak-off point( geddroplet( )WasteCollectorCollection tubeDropletSorting
» Flow Cytometry is the technical process that allows for the individual measurements of cell fluorescence and light scattering. This process is performed at rates of thousands of cells per second. » This information can be used to individually sort or separate subpopulations of cells. History Flow cytometry developed from microscopy. Thus Leeuwenhoek is often cited in any discussion .File Size: 1MBPage Count: 37