Transcription
The Basics of FlowCytometryFACSCoreFacilityJanine Bögli, Biozentrum, 29. January 2018
The functions of theFACS Core FacilityCentralization of equipment and expertiseTrain usersSorter operationAdvice andtroubleshooting2
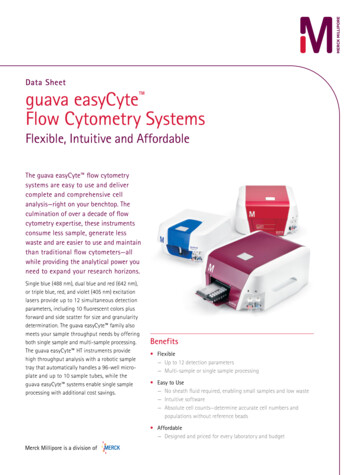
Why is Flow Cytometry important?Why we use it and what it is used for Analyze thousands of cells in a shorttime Statistical information obtained quickly Flexibility of data acquisition Ability to re-analyzePublications citing 'flow cytometry'1200010000The use of flow in research hasboomed since the 8197619740ImmunophenotypingDNA cell cycle/tumor ploidyMembrane potentialIon fluxCell viabilityIntracellular protein stainingpH changesCell tracking and proliferationSortingRedox stateChromatin structureTotal proteinLipidsSurface chargeMembrane fusion/runoverEnzyme activityOxidative metabolismSulfhydryl groups/glutathioneDNA synthesisPlus manyDNA degradationothers!Gene expression3
Overview What is Flow Cytometry Fluorescence The basics of a flow cytometer Fluidics Optics Electronics Data analysis How does flow cytometry data look like Gating Applications4
What is Flow Cytometry?Cytometry“kytos” Greek:Hollow/cell“Greek:MeasurementThe measurement canbe substrate-based 5
What is Flow Cytometry?FlowCytometry“kytos” Greek:Hollow/cell“Greek:Measurement or flow-based.6
What is Flow Cytometry?A means of measuring the physical and chemicalcharacteristics of particles in a fluid stream as they pass oneby one past a sensing point.*7
What can Flow Cytometry do?Analyze light signals to: Enumerate particles in suspension Evaluate 105 to 106 particles in less than 1 min Detection of rare cell populations Measure multiple parameters Sort single particles for subsequent analysis8
Fluorescence Intrinsic fluorescence Inheritent molecules within the cell Autofluorescence Extrinsic fluorescence Added to the cells by investigators Includes dyes and fluorescent proteins9
What is ationlightJablonski Diagram Excitation (Absorbance) with one color Emission (Fluorescence) with a different color Fluorophore: the part of the molecule that is fluorescent Fluorochrome: the whole molecule (can have severalfluorophores)10
Concepts of Excitation and EmissionFITC ExcitationFITC Emission11
FluorochromesPacific BlueFITCPEAPCMake use of spectral om/sg/research/multicolor/spectrum viewer/index.jsp12
Fluorescent ProbesAntibodiesFluorescent dyesFluorescent Fluor dyesPE-Cy5, PE-Cy7BV, BUVDAPIHoechst dyesPropidium iodideAcridine OrangeTO-PRO-3DyeCycle dyesSYTOX dyesCyan FPGreen FPYellow FPOrange FPRed FPmCherrymTomato Monoclonalantibodies Fluorochromes DNA, RNA andfunctional stains Computers andminiaturization ofelectronics Lasers13
What is inside the Flow Cytometer?14
The Many Parts of FlowFluidicsBasic components:OpticsElectronics15
The Basic ComponentsFluidicsCells in suspension flowin single-file through anilluminated volumewhere they scatterlight and emitfluorescence Optics that is collected,filtered andconverted Electronics to digital valuesthat are stored on acomputer.http://flow.csc.mrc.ac.uk/?page id 516
Fluidics – FunctionMove the cells through the cytometer andensure that: Cell passes through the center of the lightsource Cells pass one by one Flow is smoothno pulsingno turbulence More than one way to do thisInterrogation pointIllumination volumeInterceptLaser intersection point17
Fluidics – Hydrodynamic FocusingForwardScatterSignalFocused LaserBeamSheathfluidsampleInjector TipAdapted from Purdue University Cytometry Laboratories18
Fluidics – Laminar Flow Sheath and sample fluids stream go in parallel through theflow cell The sample flows in the very center of the sheath Sample and sheath fluids don’t mixWe need to keep asmooth laminar flow!no aggregatesno air19
Fluidics – Schematic Overviewwaste aspiratorInterrogation pointSheath FlowFlow cellSample FlowInterior reservoirSheath filterSample injectionprobe (SIT)Sheath tankSample tube20
Fluidics – Sample DifferentialLowMediumHighThe sample pressure determines the flow rate 21
Fluidics – Sample DifferentialLowMediumHigh and thus the core diameter.Increased differential pressure will increase the sample flowrate, but will also increase the incidence of multiple cellspassing through the laser at the same time.22
Fluidics – There is a Speed LimitWith a higher flow rate we increase coincidences get no single-cell analysis get sub-optimal data lose dataBADTo increase aquisitionrates you have toconcentrate yoursample23
Optics - Lasers Laser light is coherent and generally of a single wavelength Flow cytometers can have a single or up to 7 lasers (or more)UV (325, 355, 375nm)Violet (405nm)Blue (488nm)Green (532nm)Yellow (561nm)wikipediaRed (633nm)24
Optics – Laser Arrangement25
Optics – Optical ArrangementForward Scatterflow cellsamplestreamforward scatterdetector 2-20 of the laserintercept Based on MieScattercoherent lightsource (488nm)Light scatters inall directions!(FSC,FALS,FS)obscuration bar Scatterproportional tothe square ofthe diameter ofthe cell Based on‘sphericalparticles26
Optics – Notes on Scatter Using FSC to determine size only works when comparingapples to apples The definition fails when comparing cells and microspheres The refractive index of particles and cells are different Scatter signal is influenced by Cell size Refractive index Nuclear to Cytoplasmic ratio The refractive index can change in Viable and non-viable cellsFixed and unfixed samplesDrug treatment Granularity27
Optics – Optical Arrangementflow cellsamplestreamforward scatterdetectorSide Scatter(SSC, SS, orthogonalscatter) large anglescattering (15150 )coherent lightsource (488nm) darkfield complexity andgranularityobscuration barside scattercollection lens28
Optics – Optical Arrangementflow cellsamplestreamforward scatterdetectorFluorescenceemission Collected with thesame lens as theSSC (15-150 )coherent lightsource (488nm) Intrinsic or extrinsicfluorescenceobscuration barcollection lens forSSC and fluorescence29
Optics – Fluorescence488nmFITC30
Optics – Capture Fluorescence488nmFITC31
Optics – Capture Fluorescence488nmGFP32
Optics – Capture FluorescenceStokes shiftFITC /GFP33
Optics – Capture FluorescenceStokes shiftPE34
Optics – Capture Fluorescence488nmFITCPE35
Optics – Capture Fluorescence488nmFITCPE36
Optics – Optical Filters Filters transmit light of a specific wavelength while reflectingother wavelengths There are three types of dichroic filters: Shortpass (SP) filters Longpass (LP) filters Bandpass (BP) filters37
Optics - Filter PropertiesLongpass filterstransmitwavelengthsabove a cut-onwavelengthShortpass filterstransmitwavelengthsbelow a certainwavelength550SP550LP510/20BPEmission lightEmission lightEmission light 550nm 550nmLPBandpass filterstransmit wavelengthsin a narrow rangearound a specifiedwavelengthSP500-520nmBP38
Optics - Dichroic MirrorFilter placedat 45oWith a specific anglethe filter can be usedas a dichroic mirrorLight SourceTransmittedLightReflected lightDetector EFITCDetector DPE39
Optics –Instrument Configuration Excitation spectrum: will determine whether we can use thatfluorochrome Emission spectrum: will tell us which filter to use and whetherwe can combine the fluorochrome with others.Detector EKnow yourinstrumentconfiguration whenyou select forfluorescent probes.FITCDetector DPE40
Electronics – Light detection Photomultipliers (PMTs) simply detect photons Light needs to be optically filtered before Photon energy is converted into a signal that is dependenton: Number of photons Voltage applied to the PMTThe measurement is only relative!PMT voltage setup is importantControls, controls and controls!41
Electronics - Overview photons are filtered, collected, and multiplied by the PMT The current generated is converted to a voltage pulse The voltage pulse is digitized The values are stored into a List Mode FileVPMT42
Summary I: Channel Layout Photon-distribution to detectors according to energy-levels(wavelengths) Optical elements provide separation of channels andwavelength selectionFlow cellPI, PerCPPEFITC, Alexa 488, GFPSSCIlluminationVolumeFSC43
What does a cytometer give us? We get light scatter, fluorescence information and time We collect the data in a defined way We are in control of how the data is displayed
Flow Cytometry Data Files Listmode file: correlated data file where each event is listedsequentially, parameter by parameter Flow cytometry standard (FCS 3.1) Allows other software programs to recognize and analyze data Data and header portionFSCSSCFL1FL2 FLnCell 15020452000686Cell 2551847186760067234862134765 Cell n45
CountDisplay Options - Histogram0101001000Green Fluorescence Intensity10000FITC Univariate plot The farther to the right, the brighter the fluorescence Good to display normal distributions46
Display Options – Histogram Overlays Show differences between samples/populations Peak hight is a function of the CV (spread) and the numberof events47
Display Options – Dot PlotEach event is plotted according to its value inRed fluorescenceAPCthe x and y dimensionsQ1 Q2Q3 Q4xyGreen fluorescenceFITC48
Display Options – Dot Plot Bivariate plotsprovide moregraphicalinformation andmore dataCD4 (fluorescence 2 blue) Univariate plots showone dimensionCD8 (fluorescence 1 red)49
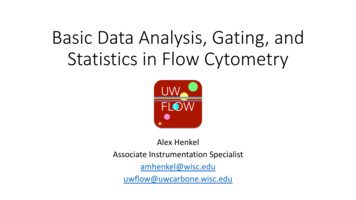
Side Scatter SSCMore GranularWhat we learn from Light ScatteringApoptotic CellsBigger Cells orAggregatesDeadCellsLive CellsForward Scatter FSCBigger50
Light Scattering in Whole Blood51
Common Modes for Dot Plots Forward scatter vs side scatterTo look at the distribution of cells based upon size and granularity Single color vs side scatterTo visualize the expression of the fluorescence of cells Two-color fluorescence plotTo differenciate between those cells that express only one of theparticular fluorescent markers, those that express neither andthose that express both52
Lots of Options! DOT plots mask the amount of data Density plots and Contours show where concentrations areheaviest Contours do not display rare events well - use Contourshowing outliers (Contour and Dot Plot combination)Display options:www.treestar.com53
N-Dimensional Plots Can rotate them and 4 parameters? For analysis only usually Statistics are hard to determine on these54
N-Dimensional Plots and 4 parameters? We have to reduce the data For this we define populations and gates55
Gates A region (or region of interest ROI) can be drawn on A histogram to define boundaries and calculate percentage ofpositive A bivariate plot to define populations and calculate percentages Gating should be based on some scientific basis Proper controls are essential Follow the density of the population
Gates Gates can be combined and are used to isolate subsets ofdata Gates are usually hierarchical organized, like a family treechildgrandchild57
Why Gating is useful Is used to isolate asubset of cells on aplotMixed T cell populationred We can use them toselect a population forfurther study Allows the ability tolook at parametersspecific to only thatsubsetgreendeadbothapoptoticgreenred3% double pos. 60% double pos.58
Why Gating is useful (2) Doublet exclusion based on FSC-A vs -H vs –W gating Eliminates false positive events and cleans up your plotsFrom Annual Flow Cytometry course, University Zürich59
Important Points on Analysis Flow data is primarily concerned with descriptive statistics Enumeration of subsets Level of fluorescence intensity Visualization What kind of data are you looking for? How much fluorescence?What percent are positive?How much more positive is x than y?What is the ratio between green and red fluorescence? What kind of statistics are available MFI%-agesCV 60
Summary II - the Main Points Keep a smooth laminar flow! Prevent air and aggregates. To increase acquisition rates you have to concentrate yoursample. The key to good results is good sample preparation. Know your instrument configuration when selecting forfluorescent probes. Gating helps to define your cells of interest. All measurements are relative, don’t forget the controls. Include a viability dye and doubletdiscrimination gating to eliminatefalse positive events.61
There is more Applications: Major applicacions phenotyping and fluorescent proteins Examples for special applications: RNAFlow & FRETBasic Use:ImmunophenotypingTransduction /TransformationconfirmationFunctionalanalysisDNA and RNAanalysisCell death62
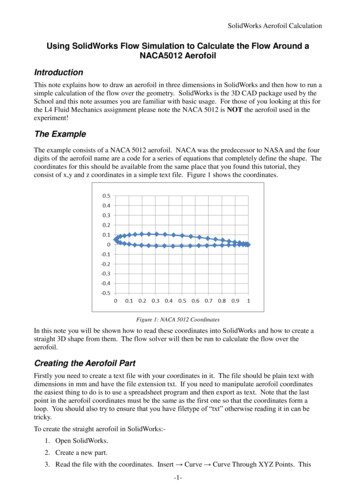
Immunophenotyping Establish the presence orlevel of an antigen Use of labeled antibodiesto identify cells of interestSSCB-cell marker Detection of cell surfacemolecules as examplecluster of differentiationLymphocyteT or B?FSCwww.med4you.atonly cells fromR1T-cell marker63
DNA Analysis DNA content of individualcells gives information abouttheir ploidy Suitable dyes: PI, 7-AAD, DAPI Combination with light scatteror immunofluorescence64
Cell DeathMeasurements of celldeath:Normal HL60 Expression of proteinsinvolved in apoptosis Activation of caspasesapoptotic HL60 Changes in themitochondrialmembrane potential Changes in theplasma membrane Cell shrinkage Chromatin changes DNA degradation65
Intracellular staining Intracellular staining ofcytokines, cytoskeleton,enzymes, transcriptionfactors, signalingmolecules Monitor signalingcascadesFixationPermeabilization66
Fluorescence Resonance EnergyTransfer Assays protein-protein interactions with thehelp of fluorescently labeled proteins distance between the two proteinsmust be less than 10nm The emission spectrum of the donorfluorophore must overlap theabsorption spectrum of the om/resources/applications/fret/67
RNA Flow AssayGene-specific oligonucleotide probe set and branched DNAtechnology: Compare RNA and protein kinetics in the same cell Parallel analysis of microRNA targets in combination withantibody staining Detect target-specific RNA for which flow cytometryantibodies are nonexistent68
Compare RNA and Protein Kinetics69
Gene Expression Genes well characterized andcan be cloned in frame withgene of interest Can be used to monitor ratesof gene expression Level of intensity can bevariable Great for cell sortingapplicationsyellow fluorescence Commonly used as marker oftransfectiongreen fluorescence70
Principle of Sorting Separating cells based onproperties measured inflow is also calledFluorescence-ActivatedCell Sorting (FACS) High-speed cell sorting isbased on dropletdeflection71
Microscopy vs Flow CytometryMicroscopyFlow Cytometry Poor enumeration of cellsubtypes Fast Localization of antigen is possible Can not tell you where antigen is Limiting number of simultaneousmeasurements Subpopulation analysis Multiparameter analysis Characterization of rare events72
You are not w.bdbiosciences.com/research/multicolor/spectrum htmljanine.boegli@unibas.ch73
Flow Cytometry Data Files Listmode file: correlated data file where each event is listed sequentially, parameter by parameter Flow cytometry standard (FCS 3.1) Allows other software programs to reco